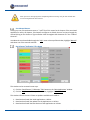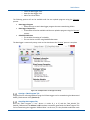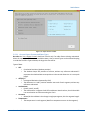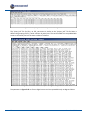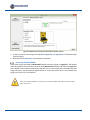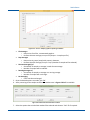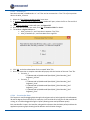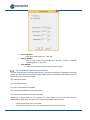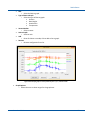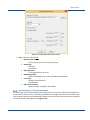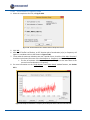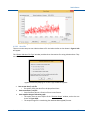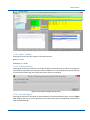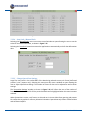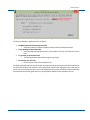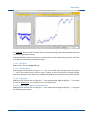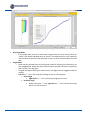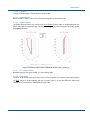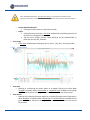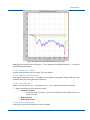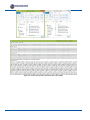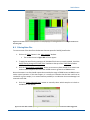
1
Instruction Manual SAA Software Measurand Inc. 2111 Hanwell Rd. Fredericton, NB, Canada E3C 1M7 tel: 506-462-9119 fax: 506-462-9095 Email: [email protected] http://www.measurandgeotechnical.com This page is left intentionally blank SAA Software Notices Measurand shall have no liability for incidental or consequential damages of any kind arising out of the sale, installation, or use of its products. Please read this document and any notes and instructions carefully before proceeding with installation and operation. The information herein is subject to change without prior notification. ShapeAccelArray (SAA) is covered by patents including: 6127672, 6563107, 7296363, WO 02/055958, WO 98/41815, 5352039, 2427421 and others pending. Measurand Software is copyrighted. Any unauthorized use is strictly prohibited. In addition to this manual, a prerequisite to installing and using SAA is to study the SAA Description & Installation Manual and any other manuals covering hardware or software relevant to use of SAAs in your particular installation. All manuals are available through our website (http://www.measurandgeotechnical.com/software.html) or through SAASuite. Revisions No: 1 December 2014 i This page is left intentionally blank ii December 2014 SAA Software Table of Contents Table of Contents ............................................................................................................ iii List of Figures..................................................................................................................xii 1. 2. Introduction .............................................................................................................. 1 1.1 System Requirements....................................................................................................1 1.2 Installation....................................................................................................................2 1.3 Manual Overview ..........................................................................................................2 SAASuite ................................................................................................................... 3 2.1 Main Application Tab ....................................................................................................3 Application Buttons ..........................................................................................................................3 User Manual Buttons ........................................................................................................................4 Get Software/”Calibration” files Button ...........................................................................................4 2.1.3.1 Communication Settings Button ..............................................................................................6 File Menu ..........................................................................................................................................6 Help Menu ........................................................................................................................................6 2.1.5.1 Manuals Menu Item .................................................................................................................7 2.1.5.2 Register Menu Item .................................................................................................................8 2.1.5.3 Get Software Menu Item .........................................................................................................8 2.1.5.4 About Menu Item.....................................................................................................................8 3. 2.2 SAACR_ Utilities Tab ......................................................................................................9 2.3 Legacy Applications Tab .............................................................................................. 10 SAACR_FileGenerator .............................................................................................. 11 3.1 SAACR_FileGenerator Tab ........................................................................................... 11 Open File Button .............................................................................................................................12 SAARecorder Folder Field ...............................................................................................................12 Project Title Field ............................................................................................................................12 Number of Preliminary Samples .....................................................................................................12 Reading Interval Field & Units Field ................................................................................................12 Logger Type Drop-Down List...........................................................................................................13 Sensor Fields ...................................................................................................................................13 3.1.7.1 SAA .........................................................................................................................................13 3.1.7.2 232(-5) Channel......................................................................................................................14 3.1.7.3 COM Port ...............................................................................................................................14 3.1.7.4 Serial Number ........................................................................................................................14 3.1.7.5 Averaging Level ......................................................................................................................14 Generate File Button ......................................................................................................................15 What to do with the File .................................................................................................................15 3.2 SAACR_Raw2DataConfiguration Tab ............................................................................ 15 Raw Data Folder Field .....................................................................................................................16 Data Logger Name Field ..................................................................................................................16 Time Zone Off set Drop-Down List .................................................................................................16 Export Settings Button ....................................................................................................................16 Non-SAA Sensors / Virtual SAAs / Convergence SAAs ....................................................................17 3.2.5.1 Checkboxes ............................................................................................................................18 December 2014 iii 3.2.5.2 “Site” file Path Field .............................................................................................................. 18 3.2.5.3 Additional Configuration Button ........................................................................................... 18 Sensor Fields .................................................................................................................................. 19 3.2.6.1 SAA ........................................................................................................................................ 19 3.2.6.2 Orientation ............................................................................................................................ 19 3.2.6.3 Reference End ....................................................................................................................... 19 3.2.6.4 Azimuth ................................................................................................................................. 19 3.2.6.5 Segments Used...................................................................................................................... 19 3.2.6.6 Slaved Segments ................................................................................................................... 19 Generate Config File Button .......................................................................................................... 19 What to do with the File ................................................................................................................ 20 4. LoggerNet ............................................................................................................... 21 4.1 Setting Up the CS Data Logger...................................................................................... 21 Setting up the Logger ..................................................................................................................... 22 4.1.1.1 Communication Setup........................................................................................................... 23 4.1.1.2 Data Logger Settings ............................................................................................................. 26 Creating a “Main Program” file ...................................................................................................... 27 Compiling SAA Program Files ......................................................................................................... 27 Uploading Program Files to the CR1000 ........................................................................................ 29 Data File Management .................................................................................................................. 32 4.2 Collecting Data from the CS Data Logger ...................................................................... 33 Manual Data Collection ................................................................................................................. 33 Automated Data Collection ........................................................................................................... 35 Manual Data Conversions .............................................................................................................. 36 Automated Data Conversions ........................................................................................................ 36 Saving Data in Overwrite File Mode .............................................................................................. 39 4.3 5. Files Created by the Logger .......................................................................................... 40 SAACR_raw2data .................................................................................................... 42 5.1 Starting SAACR_raw2data ........................................................................................... 42 5.2 “Calibration” files ........................................................................................................ 43 5.3 Files and Subfolders .................................................................................................... 44 PROJECT_INFO.dat File .................................................................................................................. 45 SAA_DATA.dat Files ....................................................................................................................... 45 SERIAL_ERRORS.dat File ................................................................................................................. 46 DIAGNOSTIC Files ........................................................................................................................... 47 Non-SAA Files ................................................................................................................................. 47 Export Files..................................................................................................................................... 48 5.3.6.1 DIY Subfolder ........................................................................................................................ 48 5.3.6.2 Archive Subfolder .................................................................................................................. 49 5.4 Utilities ....................................................................................................................... 50 5.5 Getting Started ........................................................................................................... 50 Logger Raw Data File Window ....................................................................................................... 51 5.5.1.1 Selecting a Project - Reset ..................................................................................................... 51 5.5.1.2 Selecting Files - Reset ............................................................................................................ 52 “Calibration” files ........................................................................................................................... 54 Selecting Settings ........................................................................................................................... 54 iv December 2014 SAA Software 5.5.3.1 Current Export Formats and Data Types ................................................................................57 5.5.3.2 DIY Format Definitions ...........................................................................................................58 Command-Line Operation ..............................................................................................................59 5.6 Reviewing the Files...................................................................................................... 60 Viewing the Data ............................................................................................................................62 5.7 Magnetometers .......................................................................................................... 62 Magnetometers in SAAs .................................................................................................................62 First Conversion Setup ....................................................................................................................62 5.8 “Site” Files .................................................................................................................. 68 Superset SAAs .................................................................................................................................68 Convergence SAAs ..........................................................................................................................69 5.9 Non-SAA Sensors......................................................................................................... 70 Piezometer (PZ) ..............................................................................................................................71 Earth Pressure Cells (EPCs) & Strain Gauges (SGs) .........................................................................79 “non_saa_coeffs.cal” File ...............................................................................................................80 6. SAARecorder ........................................................................................................... 82 6.1 Connecting Hardware .................................................................................................. 82 Connect SAA ...................................................................................................................................83 Connecting using the SAAFPU ........................................................................................................83 Connecting using the SAA232 .........................................................................................................86 Connecting using the SAA232-5......................................................................................................89 Connecting using the SAAUSB Adapter ..........................................................................................91 Connection Completion ..................................................................................................................93 Other Startup Window Options ......................................................................................................94 Once SAARecorder has started .......................................................................................................95 6.2 Saving and Exporting Raw Data (File) ........................................................................... 97 File | Auto-save raw data file(s)......................................................................................................97 File | Quick save button..................................................................................................................99 File| Save raw data file .................................................................................................................100 File| Open raw data file ................................................................................................................101 File| Close raw data file ................................................................................................................102 File | Export raw data to ...............................................................................................................102 6.2.6.1 SAAView ...............................................................................................................................102 6.2.6.2 A text file ..............................................................................................................................104 6.2.6.3 An Atlas file ..........................................................................................................................108 6.2.6.4 Grout Anchor Data ...............................................................................................................108 File | Save text snapshot of SAA data ...........................................................................................115 File | Generate Scan Reports from Current Data .........................................................................118 File | Generate Scan Reports from Text Snapshot(s) ...................................................................121 File | Concatenate horizontal pose data ..................................................................................122 Grouping Multiple Raw Data (or Text) Files Together ..............................................................122 6.3 Communications ....................................................................................................... 123 Communications | Baud Rate .......................................................................................................123 Communications | Check available COM ports ............................................................................124 Communications | Search for serial SAAs ....................................................................................124 Communications | Serial port connections ..................................................................................127 Communications | Advanced | Network | Network connections ................................................128 Communications | Advanced | Network | Search for network SAAs ..........................................128 December 2014 v 6.4 SAA Setup ................................................................................................................. 129 SAA Setup | View Basic Settings .................................................................................................. 129 SAA Setup | Averaging / AIA Mode ............................................................................................. 129 SAA Setup | Reference ................................................................................................................ 130 SAA Setup | Mode ....................................................................................................................... 131 SAA Setup | Site Properties ......................................................................................................... 131 SAA Setup | Units ........................................................................................................................ 133 SAA Setup | Sampling Rate .......................................................................................................... 134 SAA Setup | Displacement and Tilt Alarms .................................................................................. 135 6.4.8.1 Displacement Alarms .......................................................................................................... 137 6.4.8.2 Vector Alarms...................................................................................................................... 138 6.4.8.3 Tilt Alarms ........................................................................................................................... 138 SAA Setup | Piezometer Options ................................................................................................. 139 SAA Setup | Advanced | Constrain SAA Endpoint ................................................................... 140 SAA Setup | Advanced | Turn on / off section of SAA ............................................................. 140 SAA Setup | Advanced | Straighten section of SAA ................................................................ 141 SAA Setup | Advanced | Enable / Disable magnetometer twist correction............................ 141 SAA Setup | Advanced | Orientation sensor option ............................................................... 142 SAA Setup | Advanced | Hardware Triggering ........................................................................ 142 SAA Setup | Advanced | Use long time stamps ...................................................................... 142 6.5 Data and Graphs ....................................................................................................... 143 Data and Graphs | Raw Data ....................................................................................................... 143 Data and Graphs | Numeric Data ................................................................................................ 143 Data and Graphs | Graph Data .................................................................................................... 144 Data and Graphs | View snapshot of SAA data ........................................................................... 146 Data and Graphs | Vertical Displacements Relative to Reference SAA Shape ............................ 147 Data and Graphs | View +X-mark Roll Angle ............................................................................... 149 Data and Graphs | Magnetometer data ...................................................................................... 151 Data and Graphs | Get vibration data ......................................................................................... 151 6.5.8.1 Acceleration vs. Time Graph ............................................................................................... 152 6.5.8.2 Acceleration vs. Frequency Graph ...................................................................................... 154 6.5.8.3 Save File .............................................................................................................................. 155 6.6 Viewing SAAs and SAA Data (Display Options) ........................................................... 156 Display Options | Number of Views ............................................................................................ 156 Display Options | SAA Thickness ................................................................................................. 156 Display Options | SAA Display Color ............................................................................................ 157 Display Options | Magnify Vertical Displacement ....................................................................... 158 Display Options | Zooming In and Out ........................................................................................ 158 6.6.5.1 Zoom In ............................................................................................................................... 158 6.6.5.2 Zoom Out ............................................................................................................................ 158 6.6.5.3 Zoom to Fit .......................................................................................................................... 159 Display Options | View Data Rate ................................................................................................ 159 Display Options | Reset view settings ......................................................................................... 159 Display Options | Advanced | Change frame rate ....................................................................... 159 Display Options | Advanced | Show Inclination Warning Text .................................................... 159 Mouse Feature | Panning the View ......................................................................................... 160 6.7 Diagnostics................................................................................................................ 160 Diagnostic Tests ........................................................................................................................... 160 6.7.1.1 Voltage / Current Check ...................................................................................................... 161 6.7.1.2 Total Acceleration Check..................................................................................................... 161 6.7.1.3 Sensor Noise Test ................................................................................................................ 162 vi December 2014 SAA Software 6.7.1.4 6.7.1.5 6.7.1.6 6.8 Data Diagnostics ..................................................................................................................163 Communications Check........................................................................................................163 SAA Bend Angles ..................................................................................................................164 Calibrations............................................................................................................... 165 Calibrations | Roll calibration .......................................................................................................165 Calibrations | 2D shape alignment (mixed (convergence) mode only) ........................................166 Calibrations | Calibrate piezometer offset ...................................................................................167 Calibrations | Advanced | Horizontal Calibration ........................................................................167 6.8.4.1 Floor Survey Text File ...........................................................................................................168 Calibrations | Advanced | Vertical Calibration .............................................................................169 Calibrations | Advanced | Load previous vertical calibration ......................................................169 Calibrations | Advanced |Join SAAs together ..............................................................................169 6.9 Troubleshooting & Support (Help) ............................................................................. 169 Help | About SAARecorder ...........................................................................................................170 Help| Documentation ...................................................................................................................170 Help | Keyboard Shortcuts ...........................................................................................................170 Help | Tutorial Videos ...................................................................................................................170 Other ways of connecting SAAs ....................................................................................................170 7. SAAView ............................................................................................................... 171 7.1 Running SAAView...................................................................................................... 171 SAARecorder Selection .................................................................................................................171 CR Logger Selection ......................................................................................................................171 DL1_Logger Selection ...................................................................................................................172 Server Selection ............................................................................................................................172 7.1.4.1 New Project button ..............................................................................................................172 7.1.4.2 Delete Name Button ............................................................................................................174 7.1.4.3 Open Saved Project Button ..................................................................................................174 7.1.4.4 Incremental Download Button ............................................................................................174 7.1.4.5 Download All Files Button ....................................................................................................174 7.1.4.6 Get Server Listing Button .....................................................................................................174 7.2 Main Window Overview ............................................................................................ 174 File Menu ......................................................................................................................................178 7.2.1.1 Export Data ..........................................................................................................................178 7.2.1.2 Save image ...........................................................................................................................178 7.2.1.3 Delete SAA Filter File............................................................................................................178 7.2.1.4 Delete Sensor Filter File .......................................................................................................178 7.2.1.5 Delete Alarm File..................................................................................................................178 7.2.1.6 Delete AutoCall File..............................................................................................................178 Settings Menu ...............................................................................................................................179 7.2.2.1 Metric / English ....................................................................................................................179 7.2.2.2 Edit Project Name ................................................................................................................179 7.2.2.3 Elevation Offsets ..................................................................................................................179 7.2.2.4 Auto Scale / Manual Scale ...................................................................................................180 7.2.2.5 Change SparseView Settings ................................................................................................180 FilterSensor Button .......................................................................................................................182 FilterSAA Button ...........................................................................................................................182 7.2.4.1 File Menu .............................................................................................................................183 7.2.4.2 Settings Menu ......................................................................................................................183 7.2.4.3 Left Graph ............................................................................................................................183 7.2.4.4 Right Graph – Right-Click Dashed Lines ...............................................................................183 December 2014 vii 7.2.4.5 Sliders .................................................................................................................................. 187 7.2.4.6 Other Options ..................................................................................................................... 188 AzimuthSAA Button ..................................................................................................................... 188 7.2.5.1 Left-Click Dashed Lines........................................................................................................ 188 7.2.5.2 Right-Click Dashed Lines ..................................................................................................... 188 7.2.5.3 Azi and Aza .......................................................................................................................... 189 Quick View Button ....................................................................................................................... 190 7.2.6.1 File Menu ............................................................................................................................ 190 7.2.6.2 Rotating Graphs .................................................................................................................. 190 7.2.6.3 X Button .............................................................................................................................. 190 7.2.6.4 Z Button............................................................................................................................... 191 7.2.6.5 Default Button..................................................................................................................... 191 7.2.6.6 Capture Button.................................................................................................................... 191 7.2.6.7 EI = 0 Radio Button .............................................................................................................. 191 7.2.6.8 Zoom Slider ......................................................................................................................... 191 AlarmSet Button .......................................................................................................................... 192 7.2.7.1 File Menu ............................................................................................................................ 192 7.2.7.2 Settings Menu ..................................................................................................................... 192 7.2.7.3 Alarm Level Drop-Down List................................................................................................ 192 7.2.7.4 Parameters Button .............................................................................................................. 193 7.2.7.5 On / Off Button ................................................................................................................... 196 7.2.7.6 All On / Off Button .............................................................................................................. 196 7.2.7.7 ‘Copy 2 All’ Button .............................................................................................................. 196 7.2.7.8 Copy From Button ............................................................................................................... 196 7.2.7.9 Save Button ......................................................................................................................... 196 View Button ................................................................................................................................. 196 7.3 Unfiltered / Filtered Data View Windows ................................................................... 197 File Menu ..................................................................................................................................... 199 Settings Menu .............................................................................................................................. 199 7.3.2.1 Edit Site Photo Size ............................................................................................................. 200 7.3.2.2 Edit Message Box ................................................................................................................ 200 7.3.2.3 Change SparseView Settings ............................................................................................... 200 7.3.2.4 AutoCall ............................................................................................................................... 200 7.3.2.5 View menu .......................................................................................................................... 201 GraphAll(+Exports) ....................................................................................................................... 202 7.3.3.1 File Menu ............................................................................................................................ 202 7.3.3.2 Settings Menu ..................................................................................................................... 204 7.3.3.3 View Menu .......................................................................................................................... 205 7.3.3.4 Dashed Lines ....................................................................................................................... 205 7.3.3.5 Type Radio Buttons ............................................................................................................. 206 7.3.3.6 From Drop-Down Menu ...................................................................................................... 206 7.3.3.7 Skip Drop-Down Menu ........................................................................................................ 206 7.3.3.8 To Drop-Down Menu .......................................................................................................... 206 7.3.3.9 Single Radio Button ............................................................................................................. 206 7.3.3.10 Hilite Sliders ........................................................................................................................ 207 7.3.3.11 Zoom Sliders ........................................................................................................................ 207 7.3.3.12 Total Display ........................................................................................................................ 208 X Graph & Y Graph ....................................................................................................................... 208 7.3.4.1 Relative to 1st Vertex ........................................................................................................... 209 7.3.4.2 Relative to Selected Vertex ................................................................................................. 209 7.3.4.3 Place User Line .................................................................................................................... 209 7.3.4.4 Delete All User Lines ........................................................................................................... 209 viii December 2014 SAA Software 7.3.4.5 Select Vertex 1 / Vertex 2 ....................................................................................................210 Variable T Graph ...........................................................................................................................211 7.3.5.1 Select Time Subset ...............................................................................................................211 7.3.5.2 Selected Times Only .............................................................................................................212 7.3.5.3 Relative to 1st Selected Time ................................................................................................212 7.3.5.4 Restore All Times .................................................................................................................212 A. SAACR Utilties ....................................................................................................... 213 A.1 A.1.1 A.1.2 A.2 A.2.1 A.2.2 A.3 A.3.1 A.3.2 A.4 A.4.1 A.4.2 B. C. SAACR_raw2raw_concat ........................................................................................... 213 Preceding / Alternate Steps ..........................................................................................................213 The process ...................................................................................................................................213 SAACR_cart2cart ....................................................................................................... 218 Preceding / Alternate Steps ..........................................................................................................218 The Process ...................................................................................................................................218 SAACR_cart2cart_matchup ........................................................................................ 220 Preceding / Alternate Steps ..........................................................................................................220 The Process ...................................................................................................................................221 SAACR_cart2manycart ............................................................................................... 226 Preceding / Alternate Steps ..........................................................................................................226 The Process ...................................................................................................................................227 SAACR_DataChecker ............................................................................................. 230 B.1 Opening Raw Data Files ............................................................................................. 230 B.2 Viewing Individual Raw Data Samples ........................................................................ 232 B.3 Filtering Data Files ..................................................................................................... 233 B.4 Saving Data Files ....................................................................................................... 234 Using Network Data Concentrators ....................................................................... 235 C.1 Configuring Network Addresses ................................................................................. 235 C.2 Connecting Hardware ................................................................................................ 237 C.2.1 C.2.2 C.3 C.3.1 Recommended Hardware Connection Procedure ........................................................................237 Recommended Hardware Shutdown Procedure ..........................................................................238 Testing Hardware Connections .................................................................................. 238 Network Testing ...........................................................................................................................238 D. Maximum Achievable Clock and Data Rates .......................................................... 240 E. D.1 Two SAAs in 3-D Mode .............................................................................................. 240 D.2 Two SAAs in 2-D Mode .............................................................................................. 240 D.3 Four SAAs in 3-D Mode .............................................................................................. 240 D.4 Four SAAs in 2-D Mode .............................................................................................. 241 D.5 Six SAAs in 3-D Mode ................................................................................................ 241 D.6 Six SAAs in 2-D Mode ................................................................................................ 241 Using a PC and SAARecorder for Data Logging....................................................... 242 December 2014 ix F. E.1 Choosing an Averaging Setting ................................................................................... 243 E.2 Setting up a File and Folder System for Storing Raw Data ........................................... 243 E.3 Recording Raw Data .................................................................................................. 243 Connecting using the SAAR Interface Box ............................................................... 245 G. Integrating Other Sensors Into the Main CS Logger Program (Advanced) ................ 249 H. Legacy Formats (SAACR_raw2data) ....................................................................... 262 H.1 Legacy Format Definitions: ........................................................................................ 262 H.2 Reviewing the Files [Section 5.6]................................................................................ 262 H.2.1 H.2.2 H.2.3 I. Atlas (Legacy) ............................................................................................................................... 263 Vista Data Vision (Legacy) ............................................................................................................ 264 Tempc (Legacy) ............................................................................................................................ 265 Finding Azimuth..................................................................................................... 266 I.1 SAA X-mark Protractor .............................................................................................. 266 I.2 SAA Reference Segment Alignment............................................................................ 267 I.2.1 I.2.2 J. X-marking Visible ......................................................................................................................... 267 X-marking Not Visible .................................................................................................................. 268 Troubleshooting FAQs............................................................................................ 269 J.1 Adding / Removing SAAs to a Data Logger: ................................................................ 269 J.2 Adding an SAA to a Data Logger with Other Sensors: .................................................. 269 J.3 How to Collect & Convert Data Logger Data Automatically: ........................................ 269 J.4 Setting Alarms:.......................................................................................................... 269 J.5 SAACR_raw2data disappears: .................................................................................... 270 J.6 Combining Data Files From Different Data Loggers: .................................................... 270 J.7 Issues Installing SAASuite and SAACR Applications: .................................................... 270 J.8 Finding X & Y Directions with Magnetometers and No Azimuth Correction: ................ 270 J.9 Site File Issue: ........................................................................................................... 270 J.10 Quick Data Logger Verification:.................................................................................. 270 J.11 Updated Data Logger OS to Version 26:...................................................................... 271 J.12 Update Data Logger, Not Getting Data: ...................................................................... 271 J.13 COM Port Conflict: .................................................................................................... 272 J.14 Setting Azimuth:........................................................................................................ 272 J.15 Using Data From Damaged SAAs: ............................................................................... 272 J.16 Checking Magnetometers: ......................................................................................... 272 J.16.1 J.16.2 x Checking magnetometer data collected with SAARecorder ................................................... 272 Checking magnetometer data collected using SAACR_raw2data ........................................... 273 December 2014 SAA Software K. J.17 Checking Data Logger Data: ....................................................................................... 273 J.18 SAAView Showing One Frame:................................................................................... 273 J.19 Ignoring Segments:.................................................................................................... 274 Support (Help) ....................................................................................................... 275 K.1 Online Documents ..................................................................................................... 275 K.2 Online Tutorial Videos ............................................................................................... 275 K.3 Online Software Downloads ...................................................................................... 275 December 2014 xi List of Figures Figure 1.1: ShapeAccelArray (SAA) on a reel. ........................................................................................................ 1 Figure 1.2: Campbell Scientific CS Data Loggers: CR1000, CR800 & CR3000. ........................................................ 1 Figure 2.1: ‘Main Application’ tab of SAASuite with labeling. ............................................................................... 3 Figure 2.2: ‘Get Software / “Calibration” files’ window. ........................................................................................ 4 Figure 2.3: ‘Download’ buttons and application / utility status. ........................................................................... 5 Figure 2.4: The ‘Communications Settings’ window. ............................................................................................. 6 Figure 2.5: The drop-down list for any ‘Instruction Manual’ available from SAASuite. ......................................... 7 Figure 2.6: The website page that opens when 'Register' is selected from the ‘Help’ menu. ................................ 8 Figure 2.7: The ‘About’ window for SAASuite. ....................................................................................................... 8 Figure 2.8: The ‘SAACR_ Utilities’ tab window. ...................................................................................................... 9 Figure 2.9: The ‘Legacy Applications’ tab window. .............................................................................................. 10 Figure 3.1: The ‘SAACRFileGenerator’ tab window. ............................................................................................. 12 Figure 3.2: Sensor Fields. ..................................................................................................................................... 13 Figure 3.3: ‘SAA’ checkbox. .................................................................................................................................. 13 Figure 3.4: ‘SAA232 or SAA232-5 Channel’ selection. .......................................................................................... 14 Figure 3.5: ‘COM Port’ dropdown. ....................................................................................................................... 14 Figure 3.6: ‘Serial Number’ field. ......................................................................................................................... 14 Figure 3.7: ‘Averaging’ field. ................................................................................................................................ 14 Figure 3.8: Saving a CS Data Logger program created using the SAACR_FileGenerator utility. .......................... 15 Figure 3.9: The ‘SAACRRaw2DataConfiguration’ tab window. ............................................................................ 16 Figure 3.10: ‘DIY Export Settings’ window. .......................................................................................................... 17 Figure 3.11: The ‘Additional Configuration’ window. .......................................................................................... 18 Figure 3.12: Sensor Fields. ................................................................................................................................... 19 Figure 3.13: Saving a conversion preference file using the ‘SAACR_FileGenerator’ utility. ................................. 20 Figure 4.1: LoggerNet ‘Main’ menu. .................................................................................................................... 21 Figure 4.2: LoggerNet ‘Program’ menu. .............................................................................................................. 22 Figure 4.3: ‘Setup’ window for LoggerNet. .......................................................................................................... 22 Figure 4.4: ‘EZSetup Wizard’ introduction window.............................................................................................. 23 Figure 4.5: Data Logger types and name. ............................................................................................................ 23 Figure 4.6: ‘Communication Setup’ connection type. .......................................................................................... 24 Figure 4.7: ‘COM Port Selection’ window. ........................................................................................................... 25 Figure 4.8: ‘Data Logger Settings’ window. ......................................................................................................... 25 Figure 4.9: ‘Data Logger Security’ window. ......................................................................................................... 26 Figure 4.10: ‘Communication Setup Summary’ window. ..................................................................................... 26 Figure 4.11: A completed first run through of the Setup. .................................................................................... 27 Figure 4.12: Saving and Compiling the SAA logger program. .............................................................................. 28 Figure 4.13: After Compilation in the CRBasic program. ..................................................................................... 29 Figure 4.14: The files after compiling, "*.tdf" file is created................................................................................ 29 Figure 4.15: ‘Selecting File Control’ in the LoggerNet ‘Connect’ utility. ............................................................... 30 Figure 4.16: ‘File Control’ window, where files are uploaded to the data logger. ............................................... 30 Figure 4.17: ‘Select Run Options’ should only be selected for the “Main Program”. ........................................... 31 Figure 4.18: Compiling after “Main Program” was uploaded. ............................................................................ 31 Figure 4.19: ‘File Control’ window after the “Main Program” has been compiled, it is now running. ................ 32 Figure 4.20: Specifying the destination of data files using the LoggerNet ‘Setup’ utility. ................................... 32 Figure 4.21: Disabling scheduled data collection................................................................................................. 34 Figure 4.22: Collecting data using the LoggerNet ‘Connect’ utility. .................................................................... 35 Figure 4.23: Enabling scheduled data collection. ................................................................................................ 36 Figure 4.24: Creating a task using the LoggerNet 'Task Master' utility. .............................................................. 37 Figure 4.25: Configuring a task using the LoggerNet 'Task Master' utility. ......................................................... 38 Figure 4.26: Viewing the status of scheduled tasks in ‘Task Master’ utility. ....................................................... 39 xii December 2014 SAA Software Figure 4.27: Switching the ‘Data File Output’ option in the LoggerNet 'Setup' utility to 'Overwrite Existing File'. ..............................................................................................................................................................................40 Figure 5.1: Campbell Scientific Data Logger CR1000, CR800 & CR3000. ..............................................................42 Figure 5.2: SAACR_raw2data initial window. .......................................................................................................43 Figure 5.3: An example of an “XX_PROJECT_INFO.dat” file that contains two SAAs. ..........................................45 Figure 5.4: An example of an “XX_SAAn_DATA.dat” file. .....................................................................................45 Figure 5.5: An example of an “XX_SERIAL_ERRORS.dat” file. ...............................................................................47 Figure 5.6: The example" XX_SERIAL_ERRORS.dat" file copied into Excel. ...........................................................47 Figure 5.7: Common ‘DIY’ folder contents. ...........................................................................................................48 Figure 5.8: A view of the “saa_export_info.txt” file in the ‘DIY’ folder. ................................................................49 Figure 5.9: ‘Startup’ window with three options. .................................................................................................51 Figure 5.10: ‘Logger Raw Data File’ window. .......................................................................................................51 Figure 5.11: First time use ‘New Project’, only one select file window will open at a time. .................................52 Figure 5.12: The example folder that can be found in ‘C:\Measurand Inc\SAA3D\logger_files\’. .......................53 Figure 5.13: This is what the ‘Example’ project folder looks like, the “Errors” file will be ignored. ......................53 Figure 5.14: The ‘File Selection’ window displaying the files from the ‘Example’ folder. .....................................53 Figure 5.15: The ‘Settings’ window. ......................................................................................................................54 Figure 5.16: ‘Editing Slaved Segments’ for SAA with Serial Number 45821. ........................................................56 Figure 5.17: ‘Export Format’ window. ..................................................................................................................57 Figure 5.18: ‘Export format’ window for ‘Legacy’ formats. ..................................................................................59 Figure 5.19: SAACR_raw2data ‘Progress’ window. ..............................................................................................59 Figure 5.20: A view of the "saacr_raw2data_logfile.txt" which is a record of the ‘Progress’ window, see Figure 5.19 .......................................................................................................................................................................61 Figure 5.21: Most common files left by raw2data in the ‘Project’ folder. ............................................................61 Figure 5.22: A typical DIY data file, ‘SAAF_45821_60_500.dat’, copied into Excel. .............................................62 Figure 5.23: This “test” project includes one SAA two with magnetometers. ......................................................63 Figure 5.24: The ‘Settings’ window with the ‘Advanced (mag)’ button................................................................63 Figure 5.25: The notice appears on the first run through SAACR_raw2data when a mag is present. ..................63 Figure 5.26: The ‘magdata’ subfolder automatically created in the ‘Project’ folder. ...........................................64 Figure 5.27: The “magdata.mat” file to be saved in the ‘magdata’ subfolder. ....................................................64 Figure 5.28: The ‘Choose Mode’ window that appears. .......................................................................................64 Figure 5.29: The ‘Initial’ window of the ‘Magtool’. ..............................................................................................65 Figure 5.30: The menu that appears upon right-clicking the mouse on the dashed line. .....................................66 Figure 5.31: The ‘Magtool’ with the ‘tot’ button selected. ...................................................................................66 Figure 5.32: The menu available by right-clicking the mouse over a mag line while in ‘tot’ mode. .....................66 Figure 5.33: A notice announcing that a “roll_calibration.txt” file has been created and saved. ........................67 Figure 5.34: A reminder to run SAACR_raw2data over again to apply the magnetometer corrections. The next time that SAACR_raw2data is run, the user must click the ‘RESET’ button on startup. Thereafter, when they are converting additional data, they can click the ‘OK’ button to convert any new data. .........................................68 Figure 5.35: “Site” file for a SuperSet SAA. ...........................................................................................................69 Figure 5.36: “Site” file for a Convergence SAA. ....................................................................................................70 Figure 5.37: PZ1_vw sensor mounted to 27 mm ID PVC conduit (SAA inside). The VW piezometer (made by Geokon) is on the left and the Measurand microprocessor-based interface is on the right.................................72 Figure 5.38: Excerpt from a “Site” file which includes 5 PZ3 sensors. ..................................................................73 Figure 5.39: Excerpt from a “Site” file which includes 7 PZ1_vw sensors. ............................................................74 Figure 5.40: Excerpt from a “Site” file which includes 7 PZ1_a sensors. ..............................................................75 Figure 5.41: The “piezo_info” file for PZ1_a sensors from Figure 5.40. ................................................................76 Figure 5.42: Data table for one of the ports handling three PZ1_a sensors. ........................................................76 Figure 5.43: ‘Progress’ window showing the PZ1_a serial numbers reported by SAACR_raw2data during conversion. They match those of the “piezo_info.dat” file. ..................................................................................77 Figure 5.44: PZ1_a data appears in “pz1_data.txt” in the ‘Project’ folder. ..........................................................77 Figure 5.45: Example of a “Site” file with PZ1_a sensors being used with SAAs and “piezo_data.dat” files in SAACR_raw2data..................................................................................................................................................78 December 2014 xiii Figure 5.46: ‘Project’ folder for Figure 5.45. ........................................................................................................ 78 Figure 5.47: Example of a CS Data Logger data table from PZ3 sensors. ............................................................ 79 Figure 5.48: Excerpt from a “’Site” file which includes EPC3 sensors .................................................................. 80 Figure 5.49: Excerpt from a “Site” file which includes SG3 sensors. .................................................................... 80 Figure 5.50: A “non_saa_coeffs.cal” file for an EPC3 sensor (seen in Figure 5.48). ............................................. 81 Figure 5.51: A “non_saa_coeffs.cal” file for an SG3 sensor (seen in Figure 5.49). .............................................. 81 Figure 6.1: The ‘Configuration’ buttons on the left of the ‘Connect SAA’ window. ............................................. 82 Figure 6.2: The ‘Startup’ window. This window appears once SAARecorder has been initialized. ...................... 83 Figure 6.3: SAA Field Power Unit (SAAFPU) in center. ......................................................................................... 83 Figure 6.4: Model 003 SAA Field Power Unit Interface. (A) 4-pin circular connector wiring design, N.B. The physical connector is external (not shown here) located on the left side of the SAAFPU, (B) 5-pin terminal block, (C) Battery charge level meter, (D) Auxiliary 4-pin terminal block. ..................................................................... 84 Figure 6.5: SAARecorder ‘Connection’ window with the SAAFPU selected. ......................................................... 86 Figure 6.6: SAA232. The 4-pin green connector connects to the RS232 port of the PC. The 5-pin green connector connects to the SAA. ............................................................................................................................................ 87 Figure 6.7: SAA232-USB cable. This is a USB to serial converter for use with SAA232. The red wire shown above should be connected to a +12 volt supply, and the black wire should be connected to GND of the same supply. ............................................................................................................................................................................. 87 Figure 6.8: SAARecorder ‘Connection’ window with the SAA232 selected. ......................................................... 89 Figure 6.9: SAA232-5. 4-pin green connector connects to RS232 port of a PC. 5-pin green connectors connect up to five SAAs. ......................................................................................................................................................... 89 Figure 6.10: SAARecorder ‘Connection’ window with the SAA232-5 selected. .................................................... 91 Figure 6.11: SAAUSB adapter model SAAUSB-002............................................................................................... 91 Figure 6.12: SAARecorder ‘Connection’ window with the SAAUSB selected. ....................................................... 92 Figure 6.13: ‘Search’ tab while connecting SAA. .................................................................................................. 93 Figure 6.14: ‘Device Connection’ window. ........................................................................................................... 93 Figure 6.15: ‘Add Device’ window........................................................................................................................ 94 Figure 6.16: ‘Device Test’ window. ...................................................................................................................... 94 Figure 6.17: ‘Operational Mode’ window. ........................................................................................................... 95 Figure 6.18: Application view of SAARecorder showing a single SAA in 3D mode. This view shows three orthographic views of the SAA, plus a fourth perspective view (lower-right corner). ......................................... 96 Figure 6.19: ‘Basic Settings’ window. .................................................................................................................. 97 Figure 6.20: View of the ‘File’ drop down menu. ................................................................................................. 97 Figure 6.21: ‘Auto-Save Raw Data’ window. ....................................................................................................... 98 Figure 6.22: The green ‘Record Data’ button that appears when ‘File | Quick Save’ is selected. ....................... 99 Figure 6.23: The ‘Choose Raw Data Filename’ window that appears once recording is complete. .................. 100 Figure 6.24: ‘Playback / Recording’ window for recording raw shape array (.rsa) data. .................................. 101 Figure 6.25: ‘Playback / Recording’ window for playback of raw data files. Controls within this window allow one to move backwards or forwards through the file and control the playback speed. ................................... 101 Figure 6.26: ‘Save Subset of Raw Data File’ window. ........................................................................................ 102 Figure 6.27: ‘Time vs. Samples’ graph for exporting to SAAView. ..................................................................... 103 Figure 6.28: ‘SAA Conversion Parameters’ window. .......................................................................................... 103 Figure 6.29: ‘Export to Text Data’ window. ....................................................................................................... 105 Figure 6.30: ‘Select Data to Export to Text’ window. ......................................................................................... 106 Figure 6.31: ‘Sampling and Output Options’ window. ....................................................................................... 107 Figure 6.32: A view of the created text file in Notepad. .................................................................................... 107 Figure 6.33: ‘Choose Atlas File Format’ window. ............................................................................................... 108 Figure 6.34: ‘Export Grout Anchor Data’ window. ............................................................................................. 109 Figure 6.35: ‘Anchor View’ application opened while saving Anchor Grout Data. ............................................ 110 Figure 6.36: ‘Joint File Header + Notes’ window. ............................................................................................... 111 Figure 6.37: ‘User Attribution’ window.............................................................................................................. 111 Figure 6.38: ‘Set Manual Scaling’ window. ........................................................................................................ 112 Figure 6.39: ‘Set Polyfit Order’ window. ............................................................................................................ 112 xiv December 2014 SAA Software Figure 6.40: ‘Set Angle of Design Path’ window. ................................................................................................113 Figure 6.41: ‘Set Line Colors’ window. ................................................................................................................113 Figure 6.42: ‘Select Additional Normalization’ window......................................................................................114 Figure 6.43: The display view after clicking the ‘(X-Z)/(S-Z)’ button. ..................................................................115 Figure 6.44: Choose between live data and saved raw data. .............................................................................116 Figure 6.45: Options for saving text snapshot files. It is possible to specify a base reference file, in order to view displacement data relative to this reference file. ...............................................................................................116 Figure 6.46: The ‘XYZ Summary’ window. ..........................................................................................................117 Figure 6.47: ‘Graph Options’ for either XZ or YZ graph. .....................................................................................118 Figure 6.48: Scan Report Output window. ..........................................................................................................119 Figure 6.49: SAAScanReport application. ...........................................................................................................119 Figure 6.50: First page of Scan Report showing plain view of SAA Shape with fixed deviation limit circle. .......120 Figure 6.51: Second page of Scan Report showing section view of SAA shape (in XZ and YZ sections) with fixed deviation limits. ..................................................................................................................................................121 Figure 6.52: ‘Concatenate Horizontal Pose Data’ window. ................................................................................122 Figure 6.53: SAA_Concat.exe utility is used for concatenating multiple raw data files (or multiple “Text” files) together into one big long file. In the window above, five raw data files have been selected for concatenation. ............................................................................................................................................................................123 Figure 6.54: View of the ‘Communications’ drop down menu. ...........................................................................123 Figure 6.55: ‘Select Baud Rate’ window. ............................................................................................................124 Figure 6.56: List of available COM Ports. ............................................................................................................124 Figure 6.57: ‘Operational Mode’ window where 2-D or 3-D view is chosen. ......................................................124 Figure 6.58: ShapeAccelArray ‘Startup’ window where a file, configuration or a connections needs to be chosen. ............................................................................................................................................................................125 Figure 6.59: ‘Choose Serial Port’ window where a serial port must be chosen to connect to. ...........................126 Figure 6.60: ‘SAA Serial Numbers to Search’ window. ........................................................................................126 Figure 6.61: ‘Troubleshooting’ window. .............................................................................................................127 Figure 6.62: ‘SAA Serial Ports’ window. ..............................................................................................................128 Figure 6.63: ‘Network Connections’ window. .....................................................................................................128 Figure 6.64: View of the’ SAA Setup’ drop down menu. .....................................................................................129 Figure 6.65: ‘Averaging’ window. .......................................................................................................................130 Figure 6.66: Changing the SAA reference in the ‘SAASetup’ menu. ....................................................................130 Figure 6.67: Changing the Mode of SAARecorder in the ‘SAASetup’ menu. .......................................................131 Figure 6.68: ‘Site Properties’ window. ................................................................................................................132 Figure 6.69: ‘Azimuth Determination’ window. ..................................................................................................133 Figure 6.70: ‘Choose Units’ window. ..................................................................................................................134 Figure 6.71: ‘Enter New Sampling Frequency’ window used for setting the sampling frequency for all connected SAAs. ...................................................................................................................................................................134 Figure 6.72: Choose one or all available SAAs. ...................................................................................................135 Figure 6.73: ‘Email Settings’ for Displacement and Tilt Alarms. .........................................................................136 Figure 6.74: ‘Set Displacement and Tilt Alarms’ window with parameters for controlling whether or not to use displacement and / or tilt alarms, and what the limits for those alarms should be. ..........................................137 Figure 6.75: SAARecorder indicating a displacement alarm condition. In this case, the endpoints of all three SAAs have moved beyond the alarm radius limit. ..............................................................................................138 Figure 6.76: Screen shot showing how SAARecorder indicates a tilt alarm condition. .......................................139 Figure 6.77: ‘Piezo output’ window for controlling the output from Measurand’s piezometer sensors. ...........140 Figure 6.78: ‘Constrain Endpoint Position of SAA’ window used for specifying the endpoint height of an SAA in 2-D mode. Useful for situations in which both ends of the SAA are constrained. ..............................................140 Figure 6.79: Window for selecting which SAA segments to turn on or off. ........................................................141 Figure 6.80: ‘Straighten SAA Selections’ window for selecting which SAA segments to make “straight”. .........141 Figure 6.81: ‘Hardware Triggering’ window. ......................................................................................................142 Figure 6.82: View of the ‘Data and Graphs’ drop down menu. ..........................................................................143 Figure 6.83: Raw data for an SAA subsection (i.e. octet)....................................................................................143 December 2014 xv Figure 6.84: Numeric data for an SAA. .............................................................................................................. 144 Figure 6.85: Window prompting user to enter what data they would like to graph. ........................................ 144 Figure 6.86: Example graph for X-axis position of joints 1, 2, 3, and 4 of an SAA. ............................................ 145 Figure 6.87: ‘Graph Options’ window for ‘File | Graph Data’. ........................................................................... 146 Figure 6.88: ‘Real-Time Alarm Limits’ window for the current graph. ............................................................... 146 Figure 6.89: Snapshot view of SAA data. ........................................................................................................... 147 Figure 6.90: X-axis Barchart of relative displacements for an SAA. Displacements are relative to a previously saved text snapshot file (saved with the ‘File | Save text snapshot of SAA data’ menu item). ......................... 148 Figure 6.91: Y-axis Barchart of relative displacements. ..................................................................................... 148 Figure 6.92: ‘Graph Displacement Options’ window. ........................................................................................ 149 Figure 6.93: The prompt window for selecting a particular SAA segment for which to display the roll angle of the X-mark. ........................................................................................................................................................ 150 Figure 6.94: Roll angle graphic colored RED indicating that the X-mark of the selected segment is more than +/5.0 degrees from zero. ....................................................................................................................................... 150 Figure 6.95: ‘Magnetometer Data’. ................................................................................................................... 151 Figure 6.96: Select what type of vibration data and which part(s) of the SAA to view for vibration monitoring. ........................................................................................................................................................................... 152 Figure 6.97: ‘Choose Accelerometer View Options’. .......................................................................................... 153 Figure 6.98: ‘Vibration vs. Time Graph’ window. ............................................................................................... 153 Figure 6.99: ‘Choose Vibration Data’ window with FFT sample size text box.................................................... 154 Figure 6.100: Graph of acceleration vs. frequency for the SAA joint closest to the near end of the SAA. ......... 154 Figure 6.101: ‘Acceleration vs. Frequency Graph’ with Max Vibrations ON. ..................................................... 155 Figure 6.102: Window prompting user to select a type of vibration output file. ............................................... 155 Figure 6.103: View of the ‘Display Options’ drop down menu. .......................................................................... 156 Figure 6.104: ‘Number of Views’ on screen selection. ....................................................................................... 156 Figure 6.105: ‘Set SAA Thickness’ window. ........................................................................................................ 157 Figure 6.106: Window to select a color for the entire SAA or just subarrays (Octets). ...................................... 157 Figure 6.107: Color options for SAAs or Subarrays. ........................................................................................... 158 Figure 6.108: ‘Magnify Vertical Displacement’ window. ................................................................................... 158 Figure 6.109: View of data rates for each of the SAAs. ..................................................................................... 159 Figure 6.110: Found in menu 'Display Options | Advanced'. ............................................................................. 159 Figure 6.111: When the inclination warnings are on, they appear in Yellow text. ............................................ 160 Figure 6.112: View of the ‘Diagnostics’ drop down menu. ................................................................................ 160 Figure 6.113: ‘Diagnostic Tests’ Window. .......................................................................................................... 160 Figure 6.114: ‘Voltage / Current Check’. ............................................................................................................ 161 Figure 6.115: ‘Total Acceleration Check’. .......................................................................................................... 162 Figure 6.116: ‘Sensor Noise Test’. ...................................................................................................................... 162 Figure 6.117: ‘Data Diagnostics’. ....................................................................................................................... 163 Figure 6.118: ‘Communications Check’. ............................................................................................................. 164 Figure 6.119: SAA bend angles expressed as a radius of curvature (in m or ft) at each joint. ........................... 164 Figure 6.120: View of the Calibrations drop down menu. ................................................................................. 165 Figure 6.121: ‘SAA Roll Calibration’ window. Bar graphs are used to depict the roll offset error at each of the SAA's joints. ....................................................................................................................................................... 165 Figure 6.122: ‘Near End Roll Angle’. .................................................................................................................. 166 Figure 6.123: Window used for aligning initial 2-D shape. ................................................................................ 167 Figure 6.124: Window used for performing a horizontal calibration on an SAA. .............................................. 168 Figure 6.125: Window to select calibration. ...................................................................................................... 169 Figure 6.126: View of the ‘Help’ drop down menu. ........................................................................................... 169 Figure 6.127: ‘About SAARecorder’ window. ..................................................................................................... 170 Figure 6.128: ‘Keyboard Shortcuts’. ................................................................................................................... 170 Figure 7.1: ‘Initial’ SAAView window. ................................................................................................................ 171 Figure 7.2: The window for retrieving files from the Measurand Server. .......................................................... 172 Figure 7.3: ‘New Project’ button clicked, Username and Password required. ................................................... 172 xvi December 2014 SAA Software Figure 7.4: 'Submit' button clicked, project name appears. ...............................................................................173 Figure 7.5: The file "project" has been moved over to the left window, though the data is not yet downloaded. ............................................................................................................................................................................173 Figure 7.6: The message box that appears when there is no new data to download. .......................................174 Figure 7.7: The warning that appears when the data is from a Measurand's Legacy DL1 Logger.....................174 Figure 7.8: The ‘Main’ SAAView window of a vertical SAA (Project: large_shear). ............................................175 Figure 7.9: The ‘Main’ SAAView window of a horizontal SAA (Project: horiz_pz_epc). ......................................175 Figure 7.10: The ‘Main’ SAAView window when a non-SAA has been selected (Project: boston_uk_tides_pz). Note: the variations are due to tidal water height, not unstable data...............................................................177 Figure 7.11: The ‘File’ menu in the ‘Main’ window (Project: boston_uk_tides_pz). Note: the variations are due to tidal water height resulting in actual deformation, and do not represent unstable data. ............................178 Figure 7.12: The’ Settings’ menu in the ‘Main’ window (Project: boston_uk_tides_pz). ....................................179 Figure 7.13: The window to change a project’s name. .......................................................................................179 Figure 7.14: The ‘Select Elevations’ window. ......................................................................................................180 Figure 7.15: The ‘Manual Scale’ window. ...........................................................................................................180 Figure 7.16: ‘SparseView Settings’ window. .......................................................................................................181 Figure 7.17: ‘Filter Sensor’ window, note the scale is in days and kPa (Project: boston_uk_tides_pz). .............182 Figure 7.18: The ‘Filter Settings’ window for vertical SAA (Project: large_shear). .............................................182 Figure 7.19: The ‘Filter Settings’ window for a horizontal SAA (Project: horiz_pz_epc). ....................................183 Figure 7.20: Right Click menu (Project: large_shear). ........................................................................................184 Figure 7.21: Two points selected for viewing, and the legend is movable (Project: large_shear). .....................185 Figure 7.22: Three points selected for viewing in single mode (Project: horiz_pz_epc). ....................................185 Figure 7.23: The first section was deleted but can still be seen in grey in both graphs (Project: large_shear). .186 Figure 7.24: The first section was deleted but can still be seen in grey in both graphs (Project: horiz_pz_epc). ............................................................................................................................................................................186 Figure 7.25: ‘No Skip, No Average’ (Project: large_shear). ................................................................................187 Figure 7.26: ‘No average, no Skip’ (Project: horiz_pz_epc). ...............................................................................187 Figure 7.27: The 'AzimuthSAA Settings’ window (Project: boston_uk_tides_pz). ..............................................188 Figure 7.28: Max Deformation option is selected (Project: boston_uk_tides_pz). .............................................189 Figure 7.29: Changing the Aza (Project: boston_uk_tides_pz). ..........................................................................189 Figure 7.30: ‘QuickView’ window (Project: boston_uk_tides_pz). ......................................................................190 Figure 7.31: Results of 'Capture' button in 'QuickView' (Project: boston_uk_tides_pz). ....................................191 Figure 7.32: The ‘Main Alarm Settings’ window (Project: boston_uk_tides_pz). ...............................................192 Figure 7.33: Green ‘SAA Params’ button for Vertical SAA (Project: boston_uk_tides_pz). ................................193 Figure 7.34: Green ‘SAA Params’ button for Horizontal SAA (Project: horiz_pz_epc). .......................................193 Figure 7.35: Yellow ‘Sensor Parameters’ button showing Pzs (Project: boston_uk_tides_pz). ..........................194 Figure 7.36: Yellow ‘Sensor Parameters’ button showing EPCs (Project: horiz_pz_epc). ...................................194 Figure 7.37: ‘Actions Settings’ Window. .............................................................................................................196 Figure 7.38: A detailed list of alarms. .................................................................................................................197 Figure 7.39: ‘Unfiltered’ data view of a Vertical SAA (Project: large_shear). .....................................................197 Figure 7.40: ‘Filtered’ data view of a Vertical SAA with azimuth adjusted (Project: large_shear). ....................198 Figure 7.41: ‘Unfiltered’ data view of a Horizontal SAA (Project: horiz_pz_epc)................................................198 Figure 7.42: ‘Filtered’ data view for a Horizontal SAA (Project: horiz_pz_epc). .................................................199 Figure 7.43: ‘Filtered View’ window with labels for graphs. ...............................................................................199 Figure 7.44: ‘Edit Size of Photo’ window. ...........................................................................................................200 Figure 7.45: ‘Auto Call Setup’ window. ...............................................................................................................201 Figure 7.46: ‘GraphAll’ graph for a Vertical SAA and 7 PZ3s (Project: boston_uk_tides_pz). ............................202 Figure 7.47: ‘GraphAll’ graph for a Horizontal SAA, 12 PZz3s and 2 EPCs (Project: horiz_pz_epc). ...................202 Figure 7.48: Warning message after clicking ‘Export data’. ...............................................................................203 Figure 7.49: ‘Export Data Settings’ window. ......................................................................................................203 Figure 7.50: ‘FilterSAA’ and ‘FilterSensors’ have been turned ON (Project: boston_uk_tides_pz). ....................204 Figure 7.51: ‘Logarithmic Time’ and ‘Highlights’ ON (Project: boston_uk_tides_pz). ........................................205 December 2014 xvii Figure 7.52: Preparing for a ‘Time Subset’: turn Y and PZ off, set SAA to single and select the time frame (Project: boston_uk_tides_pz). .......................................................................................................................... 205 Figure 7.53: The view after turning ‘Time Subset’ on (Project: boston_uk_tides_pz). ...................................... 206 Figure 7.54: A single SAA is showing (Project: boston_uk_tides_pz). ................................................................ 207 Figure 7.55: All SAAs are showing (Project: boston_uk_tides_pz). .................................................................... 207 Figure 7.56: Notice the ‘Zoom’ in comparison to the scale (Project: boston_uk_tides_pz). .............................. 208 Figure 7.57: X Graph and Y Graph (Project: large_shear). ................................................................................. 208 Figure 7.58: X graph only for horizontal SAAs (Project: horiz_pz_epc). ............................................................. 209 Figure 7.59: ‘Vertex Selection’ window.............................................................................................................. 210 Figure 7.60: Vertex 1 = 30 and Vertex 2 = 40. Notice the two colors on the XY graph (Project: large_shear). .. 210 Figure 7.61: Vertex 1 = 1 and Vertex 2 = 24 (Project: horiz_pz_epc). ................................................................ 210 Figure 7.62: A time subset was selected in the Variable T graph and then reflected in all other graphs (Project: large_shear). ...................................................................................................................................................... 211 Figure 7.63: A time subset was selected in the Variable T graph and then reflected in the other graph (Project: horiz_pz_epc). .................................................................................................................................................... 211 Figure 7.64: Selected times in Variable T graph are displayed in all other graphs. Only two points can be selected at one time (Project: large_shear). ...................................................................................................... 212 Figure 7.65: Selected times in Variable T graph are displayed in the other graph. Only two points can be selected at one time (Project: horiz_pz_epc). .................................................................................................... 212 xviii December 2014 SAA Software This page is left intentionally blank December 2014 xix SAA Software 1. Introduction Figure 1.1: ShapeAccelArray (SAA) on a reel. Measurand’s ShapeAccelArray (SAA) is a flexible, calibrated 3D measuring system. It measures 2D and 3D shape and 3D vibration using a compact array of MEMs accelerometers and proven ShapeTape / ShapeRope algorithms. Unlike collections of tilt sensors or arrays of sensors that bend in a single direction, SAAs require no other guides or fixturing. They bend freely, without a preferred axis, in 2 degrees of freedom and may be mounted vertically or horizontally. Measurand develops software that converts raw data and software for viewing the converted data. All Measurand software is available free of charge on our website. This manual covers the use of most Measurand software available to the user as well as basic instruction on the use of third party software (Campbell Scientific LoggerNet). 1.1 System Requirements SAASuite is a portal to all Measruand and Campbell Scientific (CS) Data Logger software used in operating SAAs. It provides access to a variety of Measurand and Data Logger applications. Figure 1.2: Campbell Scientific CS Data Loggers: CR1000, CR800 & CR3000. Measurand recommends a PC with the following minimum system requirements: 1. 2. 3. 4. 5. 6. Windows XP or higher OS. 1 Gigabyte RAM 100 MB of hard drive space. 100 MB more for data storage. The system must be running Microsoft .Net 3.5 or higher. One available USB Port. December 2014 1 Note: If unsure about the Microsoft .NET version, go to ‘Control Panel -> Programs and Features’. Scroll through the list of Programs to find the .NET version available. If it is less than 3.5, update to the newest .NET framework from Microsoft. 1.2 Installation All SAAs come with a USB memory stick with the SAASuite software which includes all SAA applications. SAASuite Software, which gives access to all Measurand’s application and utilities, is also available for download through Measurand’s website from this location: http://www.measurandgeotechnical.com/software.html. Note: Ensure the latest version of SAASuite (Available on our website) and all required “Calibration” files (available through SAASuite) are installed. 1.3 Manual Overview When viewing this manual, there are a few conventions that may help. ‘buttons’ 2 When a word, or string of words, has single quotes AND is underlined then it is the name of a button, a specific window or menu item. ‘folder’ When a word, or string of words, has single quotes then it is a file/folder location or column name in a window. “file” When a word, or string of words, has double quotes then it is a file name, partial file name or standard use of double quotes. Sections & Figures When the word ‘Section’ or ‘Figure’ is bolded in the document then it can be used as a link to its ‘Section’ or ‘Figure’. Attention When a word, or a string of words, is in bold then it is meant to stand out and be paid attention to. December 2014 SAA Software 2. SAASuite SAASuite is the central access point to the various applications and utilities that exist for SAAs. It also provides updates and beta versions as well as this Software Manual in PDF format that will open to the chapter for each application and utility. 2.1 Main Application Tab This tab gives access to the most commonly used applications and utilities. Figure 2.1: ‘Main Application’ tab of SAASuite with labeling. Application Buttons Clicking any one of these buttons will open the application labeled on the button. If the button is green or blue then the application or utility is installed and ready to use, blue denotes that the downloaded version is Beta. If the button is red then the application or utility is not installed. To install required applications or utilities go to Section 2.1.3. December 2014 SAARecorder (Section 6) LoggerNet (Section 4) SAACR_raw2data (Section 5) SAAView (Section 7) SAACR_FileGenerator Utility (Section 3) 3 Note: If an error message appears complaining about a missing “.dll” file this could be due to the missing Runtime Environment. User Manual Buttons Clicking any one of these buttons opens a “*.pdf” file of this manual at the chapter of the associated application or utility. All chapters, sub-chapters and figures are linked, the user can jump through the manual clicking on the Section or Figure number either throughout the document or in the “Table of Contents”. User Manuals are also available through the ‘Help’ menu at the top of the window, highlight ‘Manuals’ and select one of the manuals available. Get Software/”Calibration” files Button Figure 2.2: ‘Get Software / “Calibration” files’ window. This window can be accessed in two ways: 1) Click the ‘Get Software / “Calibration” files’ button on the ‘Main Applications’ window. 2) Click the ‘Help’ menu at the top of the window, highlight ‘Get Software’. This window informs the user if there are updates available and is used to: 1. Download and install the initial Application or Utilities. 2. Download and install the updates for the Applications or Utilities. 3. Download and install the Beta Version of the Applications or Utilities. 4 December 2014 SAA Software Figure 2.3: ‘Download’ buttons and application / utility status. The Beta Version of an application or utility is a working version that has not completed the Validation testing process. These versions have the latest updates, but might not be as reliable as the most recent production versions since they have not been fully tested. The software available for download through SAASuite are as follows: SAARecorder (Section 6) o Used to view and record live data. o Used to test that the SAA(s) are setup and connected properly. SAAView (Section 7) o Used to view the data after conversion from raw data. o If an error message appears complaining about a missing “.dll” file this could be due to the missing Runtime Environment. SAACR_raw2data (Section 5) / SAACR_ Utilities (Section 3, Appendix A & Appendix B) o These utilities are required for converting and manipulating raw data. o If the Runtime Environment has not been downloaded and installed, it will automatically download and install with this option. Runtime Environment o Required to run SAAView and SAACR_raw2data and SAACR_ Utilities. SAACR_FileGenerator Utility (Section 3) o This application enables the user to automate the recording process of the CS Data Logger and create a file with conversion settings for the converter SAACR_raw2data. SAACR_DataChecker (Appendix B) o Used to view and filter raw SAA data that has been recorded with a Campbell Scientific CS Data Logger, to check for data issues. SAASuite (Section 2) o This is available for updates and Beta versions. “Calibration” files (Section Error! Reference source not found.) o Are required for all SAAs to work with the software. Download All o Choosing this will download all files, except Beta versions, and install them. December 2014 5 2.1.3.1 Communication Settings Button Figure 2.4: The ‘Communications Settings’ window. The default protocol for downloads, for Measurand Software, is FTP. This window allows users to change the network settings, depending on requirements, to HTTP or to setup a Proxy Server. The users internal Network or IT Administration will need to give the user all the Proxy Server settings. File Menu Clicking this menu provides an ‘Exit’ menu item, choosing this will exit SAASuite. This can also be achieved by clicking the red x at the top right corner of any SAASuite window. Help Menu The ‘Help’ menu gives quick access to Manuals, Software Registration, ‘Software Download’ window and contact information for Measurand. This menu is available for each tab. 6 December 2014 SAA Software 2.1.5.1 Manuals Menu Item Figure 2.5: The drop-down list for any ‘Instruction Manual’ available from SAASuite. There are three main manuals available from Measurand. They are: SAA Description & Installation Manual o This manual is considered a Field Manual and gives information and instructions for the SAA itself. SAAPZ o This manual gives information and instruction for the SAAPZ Digital / Vibrating Wire Piezometer. SAA Software o This manual gives information and instruction for all publically available Measurand Software. This includes all the SAA Applications, Utilities as well as SAASuite. December 2014 7 2.1.5.2 Register Menu Item Figure 2.6: The website page that opens when 'Register' is selected from the ‘Help’ menu. Measurand recommends users to register their software if they wish to receive notifications for software updates or software / hardware issues. 2.1.5.3 Get Software Menu Item This menu item opens the window in Section 2.1.3. 2.1.5.4 About Menu Item Figure 2.7: The ‘About’ window for SAASuite. 8 December 2014 SAA Software The ‘About’ window gives contact information for Measurand, the website, SAASuite version number and a link to the Software Registration web page (Section 2.1.5.2). This information is useful when issues arise and Measurand’s assistance is required. We will always ask for the Software Version of any application or utilities that is in question. 2.2 SAACR_ Utilities Tab Figure 2.8: The ‘SAACR_ Utilities’ tab window. This tab provides access to all the SAACR_ Utilities except SAACR_raw2data (Section 5) and SAACR_FileGenerator Utility (Section 3). These two utilities are so commonly used that they are available on the ‘Main Applications’ tab. December 2014 SAACR_DataChecker (Appendix B) SAACR_raw2raw_concat (Appendix A.1) SAACR_cart2cart (Appendix A.2) SAACR_cart2cart_matchup (Appendix A.3) SAACR_cart2manycart (Appendix A.4) 9 2.3 Legacy Applications Tab Figure 2.9: The ‘Legacy Applications’ tab window. This tab is for applications that are no longer supported by Measurand but is still used by some users. 10 December 2014 SAA Software 3. SAACR_FileGenerator This application allows the user to automate the recording process of the CS Data Logger with SAACR_FileGenerator Tab (Section 3.1) and to create a file with conversion settings for the converter SAACR_raw2data with SAACR_Raw2DataConfiguration Tab (Section 3.2). The SAACR_FileGenerator Utility can be found on the ‘Main Applications’ tab of SAASuite. Measurand highly recommends that all CS Data Logger users start by running this application. SAAs are interfaced to COM ports on the logger through either an SAA232 (one SAA per COM port), or an SAA232-5 (up to five SAAs per COM port). This application produces three files: Include file o Example “SAA_include_V3_06.cr8”. o From the SAACR_FileGenerator Tab o Specifically for SAAs and allows the CS Data Logger to communicate appropriately with the SAA. o Also handles Measurand non-SAA sensors that use the same communication protocol as SAAs. SAAPZ is an example of a Measurand non-SAA sensor. CS Data Logger “Main Program” file o From the SAACR_FileGenerator Tab. o This file is created based on the information entered in the SAACR_FileGenerator Tab. o This file is named by the user, it is recommended that the project name be used. Project preferences file o “pref_projects.txt”. o From SAACR_Raw2DataConfiguration Tab. o For automating SAACR_raw2data conversions. 3.1 SAACR_FileGenerator Tab This application enables the user to automate the recording process of the CS Data Logger. The user may set the file location, reading interval, SAA serial number and the channel they reside on (if an SAA232-5 is being used) as well as the number of samples to average. The hook up of the CS Data Logger must match exactly the description in the window. December 2014 11 Figure 3.1: The ‘SAACR_FileGenerator’ tab window. WARNING! It is recommended to either hook up the Campbell Scientific Data Logger while filling this information in or make accurate notes of the SAA serial number, Channel (if using an SAA232-5) and COM Port. Open File Button This button allows the user to select an existing Campbell Scientific data logger program that was used for SAA data collection. File associations are “.cr8”, “.cr3” or “.cr1”. The SAACR_FileGenerator Tab will be populated with the settings according to that program. This could be used to review CS Data Logger settings as well as altering the current settings. SAARecorder Folder Field This field needs to point to the local installation folder for SAARecorder. If SAARecorder has been installed in its default location then this does not need to be changed. Project Title Field This field allows the user to specify a title or name for the project which will be written into the program. This field is not required but recommended. Number of Preliminary Samples Preliminary samples are taken before the reading interval starts, this is intended to be a troubleshooting tool. It allows for an initial check that everything is working properly. The default is 5 samples. Reading Interval Field & Units Field Reading interval is the time between SAA observations made within the program (also known as “scan interval”). An SAA can perform measurements at 400Hz, thus taking an average of 1000 samples 12 December 2014 SAA Software (typical value) in less than 10 seconds. However, sufficient time must be included to account for other commands and functions within the CS Data Logger, some of which do not occur immediately with each collection. The number of SAAs connected to a CS Data Logger also affects the collection time. It has been Measurand’s finding that the logger can work properly for an extended period of time, but usually eventually malfunctions when the reading interval is less than 10 minutes. Therefore, the suggested minimum reading interval is 10 minutes. For greatest certainty, it is wise to increase this to 15 min allowing for circumstances and configurations not yet seen. Contact Measurand (Appendix K) if sampling intervals less than 10 minutes are required. WARNING! The fastest reading interval is 10 minutes, going faster could cause the CS Data Logger to eventually crash. Logger Type Drop-Down List The user must specify for which CS Data Logger this program is intended. CR800 creates a “*.cr8” file CR1000 creates a “*.cr1” file CR3000 creates a “*.cr3” file Sensor Fields This is the area where the SAAs and SAAPZs can be set up. The maximum number of SAAs is 10 for the CR800 and 20 for the CR1000 and CR3000. Figure 3.2: Sensor Fields. 3.1.7.1 SAA To turn an SAA/SAAPZ on or off click the numbered box. If there is a checkmark then the SAA is on. Figure 3.3: ‘SAA’ checkbox. December 2014 13 3.1.7.2 232(-5) Channel The user must specify if this SAA/SAAPZ is connected to an SAA232 or to which channel of a SAA2325 it is connected (see Figure 3.4). Figure 3.4: ‘SAA232 or SAA232-5 Channel’ selection. 3.1.7.3 COM Port The user must specify to which COM port the SAA/SAAPZ is connected on the CS Data Logger. Figure 3.5: ‘COM Port’ dropdown. 3.1.7.4 Serial Number In this field the user must enter a single SAA serial number or a comma separated list of 1 SAA and up to 3 SAAPZ (up to 4 SAAPZs if there is no SAA) serial numbers. The serial numbers are physically marked on the “cable-end” and the “top-pipe” of the SAA/SAAPZ. Figure 3.6: ‘Serial Number’ field. 3.1.7.5 Averaging Level The number of SAA samples used to compute an average reading, using the ‘Averaging’ feature of SAAs. Values can range from 100 to 25500. The larger the number of samples the better the precision, but computational time also increases. For most applications Measurand recommends using an averaging level of 1000 as this level provides a good balance between measurement precision and required computation time. Figure 3.7: ‘Averaging’ field. 14 December 2014 SAA Software Generate File Button Clicking this button creates Campbell Scientific data logger files according to the information entered in the SAACR_FileGenerator Tab. A ‘Save File’ window will start, allowing the user to save “program” and “Include” files wherever they choose. Enter the desired file name, Measurand recommends the project name, for the “Main Program” file and click ‘Save’. A separate “SAA_Include” file (see Figure 3.8 for example) will be generated at the same time as the “Main Program” file. Figure 3.8: Saving a CS Data Logger program created using the SAACR_FileGenerator utility. What to do with the File Both files, the “Include” file and the “Main Program”, must be loaded onto the logger for the “Main Program” file to work properly. The “Include” file needs to be loaded onto the logger FIRST with the “Main Program” file after. To compile and use these files please refer to the LoggerNet Section 4.1.3. The “Main Program” file can be viewed and edited to add other, non-Measurand, sensors. See LoggerNet Section 4.1.3 and Appendix G. 3.2 SAACR_Raw2DataConfiguration Tab Allows the user to create a file with conversion settings for the converter SAACR_raw2data (Section 5). The conversion settings are found in a file called “pref_project.txt”. This tab window can be used to configure any automatic data conversions that will be run using the SAACR_raw2data application by creating the “pref_project.txt” file. The “pref_project.txt” file is also created on the first run of SAACR_raw2data (Section 5.6). December 2014 15 Figure 3.9: The ‘SAACRRaw2DataConfiguration’ tab window. Raw Data Folder Field The folder containing (or that will contain) the raw data to be converted. The user must direct the utility to the folder where all the raw data for this project will be stored. Data Logger Name Field Enter the name of the CS Data Logger as it was set-up using LoggerNet (Section 4). Time Zone Off set Drop-Down List The default setting is 0:00. Any non-zero offset will change all the timestamps on the data by that amount. Most users leave the offset at 0:00. Export Settings Button By clicking the ‘Export Settings’ button the window in Figure 3.10 opens. The user must select an output format for the Cartesian data. The output formats are explained in Section 5.3.6.1 DIY Subfolder and Section 5.5.3.2 DIY Format Definitions, and also in Section 5.5.3.1 Current Export Formats and Data Types and Appendix H.1 Legacy Formats. 16 December 2014 SAA Software Figure 3.10: ‘DIY Export Settings’ window. Non-SAA Sensors / Virtual SAAs / Convergence SAAs PZ3: These are conventional vibrating-wire (VW) piezometers, using a conventional VW interface to the CS Data Logger. The “3” indicates they are “third-party”, or “non-Measurand” sensors. The CS Data Logger program creates a raw data table of “digits” and temperatures or frequencies and resistance depending on how the program was written. The “Site” file designates which columns of the data table are to be used in the conversion to pressure, and what units the raw data is in and what the desired unit for the pressure should be. It also contains other site-specific data such as elevations, depths, latitude and longitude. The non_saa_coeffs files contain the calibration constants of the sensors. EPC3 and SG3: Earth Pressure Cells (EPCs) and Strain Gauges (SGs) are handled almost the same as PZ3 sensors. These are conventional vibrating-wire (VW) sensors, using a conventional VW interface to the CS Data Logger. The CS Data Logger program creates a raw data table of “digits” and temperatures or frequencies and resistance depending on how the program was written. The “Site” file designates which columns of the data table are to be used in the conversion to engineering units, and what units the raw data is in and what the desired unit for the pressure should be. It also contains other site-specific data such as elevations, depths, latitude and longitude. The “non_saa_coeffs” files contain the calibration constants of the sensors. Virtual SAAs: Are when multiple SAAs are laid end-to-end (usually with some overlapping) and used as a single long SAA. Convergence SAA: December 2014 17 Are SAAs that are placed in a loop formation, usually around part or all of the circumference of a tunnel and includes both horizontal and vertical portions. 3.2.5.1 Checkboxes Measurand Piezometers Check if Measurand SAAPZ data needs to be converted. Piezometers Check if 3rd party (non-Measurand) Piezometers data needs to be converted. Strain Gauges Check if strain gauge data needs to be converted. Earth Pressure Cell Check if earth pressure cell data needs to be converted Virtual / Convergence SAA Check to combine 2 or more SAAs into 1 SAA or use the SAA in a convergence utility. 3.2.5.2 “Site” file Path Field Path to the “Site” file. A “Site” file is needed if any of the above checkboxes have been checked. For help creating a “Site” file, refer to Section 5.8 or contact Measurand (Appendix K). 3.2.5.3 Additional Configuration Button This button should only be used when using non-Measurand sensors or legacy Measurand Analog Piezometers. Once clicked a new window opens prompting the user to provide a little more information. Data tables are created by the CS Data Logger when third party sensors are attached to the CS Data Logger, these tables sometimes have a user defined name. They should be in the same folder as the raw data files. Figure 3.11: The ‘Additional Configuration’ window. The first information request (Measurand sensors) is whether the Piezometer is a ‘Measurand Analog Piezometer’. This is a legacy feature, unless otherwise told by Measurand do not check this checkbox. 18 December 2014 SAA Software In the next section (Non Measurand Sensors), see Figure 3.11, shows the dialog for entering “CR*.dat” data table names for non-Measurand, non-SAA sensors. Supported types are piezometers (PZ), strain gauges (SG), and earth pressure cells (EPC). The “3” in the default names refers to “third-party” (nonMeasurand) sensors. These files may have a user defined name but will be in the same folder as the raw data. Sensor Fields Figure 3.12: Sensor Fields. 3.2.6.1 SAA These text boxes will be filled with SAA serial numbers that have been entered in the SAACR_FileGenerator Tab. This is done once the raw data folder is selected (Section 3.2.1). 3.2.6.2 Orientation Select the orientation of the SAA, either horizontal or vertical. This information will be used in the modeling process (any orientation may be set for Convergence SAAs as it will be converted). 3.2.6.3 Reference End Select the reference end of the SAA, either “Near (Cable) End” or “Far End”. All data will be relative to the selected end. 3.2.6.4 Azimuth Enter any desired azimuth (compass heading) offset that should be applied to the SAA, positive degrees is clockwise. 3.2.6.5 Segments Used Enter the first and last segment that are used for the SAA. Only segments at either end should be turned off (1 is the first segment at the near end). Segments in the middle of an SAA that are not working should be slaved (see Slaved Segments below). 3.2.6.6 Slaved Segments Slaving enables virtual repair of a damaged segment. This is done by assigning it the tilt of the previous segment. This is done in the order of calculation, where “1” is the segment number at the cable-end. Enter a comma separated list of any segments of the SAA that should get the same tilt as the ‘previous’ segment. Segments should be slaved if they are not working properly. Note that at the cable-end of the SAA, there is no ‘previous’ segment so the utility assigns the tilt to the nearest un-slaved subsequent segment. Generate Config File Button Clicking this button creates a configuration preference file according to the information entered in the converter configuration tab. The configuration preference file, named “pref_project.txt”, is used by SAACR_raw2data to convert raw data with the settings selected in SAACR_FileGenerator Tab (or selected during the first run of SAACR_raw2data). A window will pop-up telling the user where the saved “pref_project.txt” file is saved. It will save in the folder specified in the ‘Raw Data Folder’ Field. To use this file please refer to the LoggerNet Section 4.2.4. December 2014 19 Figure 3.13: Saving a conversion preference file using the ‘SAACR_FileGenerator’ utility. What to do with the File Once the “pref_project.txt” file has been generated, it is possible to set up the PC to automatically convert the data into a format viewable in SAAView. This is accomplished using the LoggerNet ‘Task Master’ utility. 20 December 2014 SAA Software 4. LoggerNet 4.1 Setting Up the CS Data Logger Note: The CS Data Logger setup can be done prior to taking the earth station in the field for installation, saving time in the field. Setup of the CS Data Logger to collect SAA data requires a basic understanding of Campbell Scientific’s LoggerNet software. For more information on Campbell Scientifics’s LoggerNet software, visit the Campbell Scientific website to obtain the user manual (http://www.campbellsci.ca/). The LoggerNet toolbar is shown in Figure 4.1, for the purpose of this manual, the following utilities will be used: Setup o Utility used for connecting to or changing connection settings of a CS Data Logger (e.g, the CR1000, CR3000, or CR800). o This utility is found in the ‘Main’ menu. Connect o Utility used for managing device connection and manual data collection. o This utility is found in the ‘Main’ menu. Task Master o Utility used for automating data collection and conversion. o This utility is found in the ‘Main’ menu. Figure 4.1: LoggerNet ‘Main’ menu. CRBasic Editor o Editor and compiler used for Campbell Scientific programs. o This utility is found in the ‘Program’ menu. December 2014 21 Figure 4.2: LoggerNet ‘Program’ menu. Setting up the Logger Before connecting to the CS Data Logger with LoggerNet the Data Logger must be Setup. Under the ‘Main’ menu (See Figure 4.1) click ‘Setup’, the Setup window opens. Figure 4.3: ‘Setup’ window for LoggerNet. To start, click ‘Add’ and an EZSetup Wizard starts. 22 December 2014 SAA Software Figure 4.4: ‘EZSetup Wizard’ introduction window. Click ‘Next’. 4.1.1.1 Communication Setup Select the Campbell Scientific Data logger that is in use for this setup from the image based list in the middle of the window. Enter a name for the data logger, it is recommended the user choose a name that is memorable as it will be required in setting up SAACR_Raw2DataConfiguration (Section 3.2.2) and possibly elsewhere. Figure 4.5: Data Logger types and name. December 2014 23 Click ‘Next’. Select the mode of communication that will be used for this data logger. o Direct Connect Is selected when the data logger is communicating locally, using a PC and an interface device or cable connected to a PC’s RS232 port. (e.g. SAA232 or SAA232-5). o Phone Modem Is selected when the data logger is communicating using a phone modem and a PC is connected to another phone modem (either internal or external modem). o IP Port Is selected when a device at the data logger site accepts a static IP address and is connected to the internet. This device could be an NL100 or TCP/IP serial service interface. o RF95/RF3XX Is selected when RF95 or RF300 series modems are used for communication between a PC and the data logger. Repeaters are allowed in this configuration. o RF4XX (Non-PakBus) Is selected when RF400 series modems are used for communication between a PC and the data logger. (See LoggerNet Connection help for more details) o MD9 Is selected when communication with the data logger is accomplished over an MD9 network. A base MD9 is connected to the PC, and a remote is connected to the data logger. Figure 4.6: ‘Communication Setup’ connection type. 24 Click ‘Next’. Select the PC’s COM Port where the data logger is attached. December 2014 SAA Software The COM Port Communication Delay should be set to ‘0’ seconds. Figure 4.7: ‘COM Port Selection’ window. Click ‘Next’. The data logger settings are unique to each user’s setup. o Refer to the ‘Settings Help’ button on the bottom left of the window in Figure 4.8. o Refer to the LoggerNet Manual. o Contact Measurand for assistance, Appendix K. For Measurand communication devices like the SAA232 and SAA232-5, a high Baud Rate is acceptable. Figure 4.8: ‘Data Logger Settings’ window. Click ‘Next’. This section is only required if a security code was applied to the data logger itself. December 2014 25 Figure 4.9: ‘Data Logger Security’ window. 4.1.1.2 Data Logger Settings Click ‘Next’. The ‘Communication Setup Summary’ window gives a synopsis of the data logger setup just completed. If everything is accurate then click ‘Next’. Figure 4.10: ‘Communication Setup Summary’ window. At this point the user could click ‘Finish’, it is recommended to run the communication test and check the data logger clock by clicking ‘Next’. The options available: 26 Communication Test o This test will ensure the data logger has been set up correctly. The data logger clock December 2014 SAA Software o o o Check the data logger clock. Reset the data logger clock. Add a Time Zone Offset. The following options will not be available until the user uploads programs using the ‘Connect’ process. Data Logger Program o Allows the user to send a data logger program that was created using SCWin. Data Logger Output Files o These tables will not be available until the user uploads a program using the ‘Connect’ process. Scheduled Collection o This enables the setting of a schedule. o This can also be set later using SAACRFileGenerator. The data logger is now mostly setup, return to the wizard once the ‘Connect’ process is complete. Figure 4.11: A completed first run through of the Setup. Creating a “Main Program” file Program files for collecting SAA data using the CS Data Loggers can be created using the Measurand SAACR_FileGenerator Utility (Section 3). Compiling SAA Program Files Once the “Main Program” (“*.crn” where n is either 8, 1 or 3) and the “SAA_Include” file (SAACR_FileGenerator Tab Section 3.1.8) have been successfully generated, the “Main Program” file can be viewed using the LoggerNet ‘CRBasic Editor’. At this time, it is also possible to add other code December 2014 27 for instruments or powering the SW12V port on the logger. An example of a program in which additional sensors have been added is provided in Appendix 0. Once the code has been added, it should be compiled to make sure that there are no errors. To successfully compile the new program, the “SAA_Include” file generated with the program is also required. The “SAA_Include” file should be placed in the same directory as the “Main Program” to avoid compilation errors. Note that the “SAA_Include” file will not successfully compile alone, it gets compiled as part of the “Main Program”. Once the two files are located within the same directory, it is possible to save and compile the program as illustrated in Figure 4.12. Note: The “SAA_Include” file is not meant to compile on its own. The “SAA_Include” file should be placed in the same directory as the “Main Program” file. When the Main Logger program is compiled, the “SAA_Include” file is referenced and is compiled as well. Compile errors will appear if the “SAA_Include” file is compiled. Figure 4.12: Saving and Compiling the SAA logger program. Note: When using other sensors with the CR1000, it is advised to add the necessary code to the CR1000 program generated for the SAA rather than trying to integrate the SAA specific program with the other sensors. Appendix 0 provides examples for integrating other sensors into the program. 28 December 2014 SAA Software After CRBasic compiles the code a similar message seen in Figure 4.13 should appear. The message informs the user of the compiler used, version, the program compiled and how it was compiled, in this instance the program was compiled in sequential mode. Figure 4.13: After Compilation in the CRBasic program. The compiler creates a “*.tdf” file with the same name as the “Main Program”. Figure 4.14: The files after compiling, "*.tdf" file is created. Uploading Program Files to the CR1000 Once the program has successfully compiled, all the program files including the “SAA_Include” file must be uploaded to the CR1000 before the “Main Program” is run. This is accomplished in LoggerNet using the ‘Connect’ utility (Figure 4.15). December 2014 29 Figure 4.15: ‘Selecting File Control’ in the LoggerNet ‘Connect’ utility. Click on the Station (Data Logger) of interest. Click ‘Connect’, if there is only one the application will connect automatically. Click ‘File Control’ button. Figure 4.16: ‘File Control’ window, where files are uploaded to the data logger. In the ‘File Control’ window, repeat the following steps until all files have been sent to the data logger, ensure that the “Main Program” is selected last: 30 Click the ‘Send’ button. An ‘Open File’ window opens. December 2014 SAA Software Select the desired file. (First the “Include” file then the “Main Program”) A ‘Select Run Options’ window opens. o If the file selected IS NOT the “Main Program” then DE-SELECT the ‘Run Now’ and ‘Run On Power-up’ options. Figure 4.17: ‘Select Run Options’ should only be selected for the “Main Program”. Note since the run program options are selected, the “Main Program” will compile at this point (Figure 4.18). Alternatively the ‘Save, Compile and Send’ option in the CRBasic Editor in the ‘Program’ menu can be used. When prompted for Run Options, ‘Run Now’ and ‘Run On Power-up’ should be selected. Note: If the program is run to test the logger set-up, make sure to remove garbage data from the logger by clicking the ‘Stop Program’ button. When prompted, choose the ‘Clear the Program’ option. When finished setting up on the site, click ‘Run Options’ and select ‘Run Now’ and ‘Run on Power-up’ to start collecting data. To make sure no garbage data is left behind, when prompted select ‘Delete associated data tables created by’. Figure 4.18: Compiling after “Main Program” was uploaded. December 2014 31 Figure 4.19: ‘File Control’ window after the “Main Program” has been compiled, it is now running. Once the files have been uploaded, compiled and run it is now time to manage the files in Setup (Section 4.1.5). Ensure the program has been stopped by clicking ‘Stop Program..’ in the ‘File Control’ Window. Go to the ‘Main’ menu and select ‘Setup’ again. Data File Management It is critical that the data files generated by the CS Data Logger are effectively managed. The output folders for CS Data Logger data files are specified under the ‘Data Files’ tab in the LoggerNet ‘Setup’ utility (Figure 4.20). By default, the data is stored in the ‘C:\CampbellSci\LoggerNet’ directory and given a name of “DataloggerName_TableName_#.dat”. It is suggested that the output folder location be changed from this default location to another folder prior to collecting data. It is generally easiest to create a data folder in the ‘C:\Measurand Inc\SAA3D\logger_files\’ directory to facilitate automated data conversions later on. An ‘Archive_Raw’ folder should be manually created in the data folder for conversion purposes. Figure 4.20: Specifying the destination of data files using the LoggerNet ‘Setup’ utility. 1. Go To LoggerNet ‘Main’ menu – ‘Setup’. 32 December 2014 SAA Software 2. Double Click the desired Project on the left of the ‘Setup’ window (Figure 4.11). 3. Click ‘Data Files’ progress option on the left of the window (Figure 4.20). 4. Change the ‘Output File Name’ location, keeping the file name. (It is easier to do this manually (typing) rather than using the ‘Browse’ button) o The default is ‘C:\Campbellsci\LoggerNet\CRxxx_PROJECT_INFO.DAT’. o Change to ‘C:\Measurand Inc\SAA3D\logger_files\[ProjectName]\ [ProjectName]_PROJECT_INFO.DAT’. 5. Do this for all Tables. Note: If the output file name is changed, DO NOT change the output table name, only change the folder location. The ‘File Output’ option should be set to ‘Append to End of File’ (Figure 4.20). The CS Data Logger keeps track of the last record that was successfully sent to the destination folder. If the output file already exists, the new data will be appended to the end of the file. If the file does not exist or has been moved elsewhere, a new file will be created with all records that have not yet been recorded. The ‘Output Format’ should be left at the default ASCII Table Data, Long Header (TOA5). Note: Before a new project begins, any CS Data Logger data files residing in the output file directory should be removed. Otherwise, data from the new project may get concatenated to the existing data file, causing abnormalities in the results. 4.2 Collecting Data from the CS Data Logger Manual Data Collection For each Project setup, the data files that must be recorded are: “PROJECT_INFO” “SAAx_DATA” “SERIAL_ERRORS” “LOGGER_DIAGNOSTICS” “SAA_DIAGNOSTICS” Data files scheduled to be collected are listed in the ‘Data Files’ tab of the Setup utility and have a green ‘check mark’ next to them. Data Tables “Public” and ”Status” are not required for data collections as they only store one record of data at a time. They are used only for real time viewing. Ensure that these tables are not selected for Scheduled Collection by de-selecting the ‘Included for Scheduled collection’ option for that table. December 2014 33 Until data collection is properly configured, scheduled data collection should be disabled. This is accomplished by unchecking the ‘Scheduled Collection Enabled’ checkbox in the Schedule tab of the LoggerNet ‘Setup’ utility (Figure 4.21). Data can only be collected now by forcing a data download in the LoggerNet ‘Connect’ utility by clicking on ‘Collect Now’ (Figure 4.22). Whenever the CS Data Logger is connected using the ‘Connect’ utility in LoggerNet ‘Main’ menu, the station’s clock time should be checked to ensure that valid time stamps are being applied to the data. Correct time stamps cannot be easily recovered from erroneous values. The CS Data Logger’s clock is set by clicking on ‘Set Station Clock’ in the Connect utility, which will assign the time currently set on the PC in use to the CS Data Logger. Note: If the PC in use is using Daylight Savings Time, take care NOT to disrupt the time setting currently employed by the CS Data Logger. If the station clock is adjusted to match Daylight Savings Time on the PC in use, gaps or overwrites in the data file will occur. Figure 4.21: Disabling scheduled data collection. Once sufficient time has elapsed to ensure that data has been collected from the SAAs (based upon the reading frequency), data can be manually collected by clicking on ‘Collect Now’ in the Connect utility. A summary of the data collected is summarized as illustrated in Figure 4.22. 34 December 2014 SAA Software Figure 4.22: Collecting data using the LoggerNet ‘Connect’ utility. Note: Data is collected based upon scheduled interval, not upon elapsed time since the program was started. If the program is written so that data is collected every 30 minutes and it is 29 minutes after the hour, data will be collected in 1 minute. If it 31 minutes after the hour, data will be collected in 29 minutes. Automated Data Collection Once the manual data collection process has been tested, the data collection process can be automated by specifying the desired data collection interval in the ‘Scheduled Collection’ tab of the LoggerNet ‘Setup’ utility (Figure 4.23). Check the ‘Scheduled Collection Enabled’ checkbox. o As long as the destination CS Data Logger is connected (wired or wirelessly), data will be downloaded to the Output File Directory. o The Campbell Scientific Raven X manual provides details of configuring a wireless connection with the CS Data Logger. o The Campbell Scientific LoggerNet manual provides details of configuring a connection with the CS Data Logger using a land line. o A trial test should always be conducted before beginning a project to ensure that the system is performing as expected. December 2014 35 Figure 4.23: Enabling scheduled data collection. Manual Data Conversions It is possible to use the SAACR_raw2data utility to convert SAA data, and data from the following instruments: vibrating wire piezometers, strain gauges, and vibrating wire earth pressure cells. It is also possible to convert multiple SAAs into one long “superset” SAA (SAACR_raw2data Section 5.8). In order to use any functionalities beyond ordinary conversion of SAAs, the user will need to create a “Site” file for the project and place it in the appropriate SAARecorder folder (‘C:\Measurand Inc\SAARecorder\Calibrations\site\[site filename]’). If the site folder does not exist in the ‘C:\Measurand Inc.\SAARecorder\Calibrations’ folder, the user will need to create it to save the “Site” files there. The user will also need to place the “Calibration” files for the other instruments into the appropriate SAARecorder calibrations folder (‘C:\Measurand Inc\SAARecorder\Calibrations\non_saa_coeffs’). For more information on these aspects and how to use the converter, please refer to the SAACR_raw2data Section 5. Once the conversion is completed, the user will be prompted on whether or not they want to view the data using SAAView (Section 7). Automated Data Conversions Automated data conversion requires generating a “pref_project.txt” file. This can be done in two ways. This first way does not require having any raw data for conversion. In this case, the SAACR_Raw2DataConfiguration Utility in SAACR_FileGenerator Tab (Section 3.2) can be used to generate the “pref_project.txt” file which contains conversion settings needed when converting data automatically. Once the “pref_project.txt” file has been generated, it is possible to set up the PC to automatically convert the data into a format viewable in SAAView. This is accomplished using the LoggerNet ‘Task Master’ utility in the ‘Main’ menu. 36 December 2014 SAA Software To add a task in the Task Master: 1. Click on the CS Data Logger of interest. 2. Click the ‘Add After’ button, bottom of window. 3. Under ‘How Task_n Starts’ tab, a. In the ‘Station Event Type’, b. Select the ‘After Successful Call’ option (Figure 4.24). Figure 4.24: Creating a task using the LoggerNet 'Task Master' utility. 4. Under ‘What Task_n Does’ tab, a. Under ‘Execute File’, b. Check ‘Execute File’, c. File Name: ‘C:\Measurand Inc\SAA3D\SAACR_raw2data.exe’ Unless moved, this is the default location for the SAACR_raw2data executable. d. Command Line Options: “C:\Measurand Inc\SAA3D\logger_files\[project folder]\pref_project.txt” This entry MUST be In quotations (“ “) since there is a space in the C:\Measurand Inc\ path. Locate the “pref_project.txt” for the project. e. Start in: ‘C:\Measurand Inc\SAA3D’ This should be the parent folder where all the previous files are located. f. Check ‘Run Minimized’ (for it to run in the background). 5. Click ‘Apply’. December 2014 37 Figure 4.25: Configuring a task using the LoggerNet 'Task Master' utility. Note: The path name to the “pref_project.txt” file must be surrounded by double quotation marks since there is a space in ‘C:\Measurand Inc\’. 6. Go To the ‘Status’ tab, a. Verify that the ‘Pause All Tasks’ check box is unchecked, Figure 4.26. 7. SAACR_raw2data utility will run upon successful completion of a scheduled data download. a. A progress bar will appear after a scheduled data download indicating that the SAACR_raw2data utility is running. 38 December 2014 SAA Software Figure 4.26: Viewing the status of scheduled tasks in ‘Task Master’ utility. If any of the files required by SAACR_raw2data are open while the program is being executed an error message will be generated. Data which has already been automatically converted can be viewed at any point by running SAAView (Section 7). Note: Any of the files required by SAACR_raw2data (e.g., “Calibration” files, “multi_saa_allcart.txt”) cannot be open while the process is running. Otherwise an error will be generated. It is also possible to create the “pref_project.txt” file following a manual conversion of the data. In this case, it is necessary to collect and convert data manually at least once to create the “pref_project.txt” file. The file is then used in ‘Task Master’ as described previously to set up automated conversion. The procedure for automating the data conversion process in this case is: 1. 2. 3. 4. Disable scheduled data collection in the LoggerNet ‘Setup’ utility (Section 4.2.2). Send program files (both “Main Program” and “SAA_Include”) to the CS Data Logger. Set the path for data files in the LoggerNet ‘Setup’ utility. Manually download the data from the logger (Section 4.2.1) and perform a manual conversion (Section 4.2.3). This will generate the required “pref_project.txt” file. 5. Setup a new task using the ‘Task Master’ utility (previously described) 6. Manually download the data again (Section 4.2.1). 7. Enable scheduled data collection at the desired data collection interval (Section 4.2.2). If this procedure is not followed, the risk of having data gaps is higher. Saving Data in Overwrite File Mode If data is to be collected over long time periods, the “SAA Data” files will eventually become very large and require an increasing amount of time to process. Once the automated data conversion process has been setup, it is possible to switch the ‘File Output’ Option to ‘Overwrite Existing File’ (Figure 4.27) for the “SAA Data” files (the “PROJECT_INFO”, “SERIAL_ERRORS”, “LOGGER_DIAGNOSTICS”, and “SAA_DIAGNOSTICS” files should NOT be changed). December 2014 39 The SAACR_raw2data application will recognize that only the most current data is being collected. This data will be appended to the “multi_saa_allcart.mat” file so that a complete data history is maintained. The “multi_saa_allcart.txt” file (text file of all Cartesian coordinate records) will no longer be updated in this mode, just the “multi_saa_curcart.txt” (text file of most recent Cartesian coordinate records). Figure 4.27: Switching the ‘Data File Output’ option in the LoggerNet 'Setup' utility to 'Overwrite Existing File'. If the “SAA Data” file is viewed when ‘Overwrite File’ is implemented, only the most recent data records will be contained in the file. 4.3 Files Created by the Logger The following files can be expected on the logger and need to be copied/moved to the project folder. (Note: the XX below refers to the station name of the CS Data Logger. This is set by the user in LoggerNet Section 4.1.1.1). XX_PROJECT_INFO.dat o “Project Information” file summarizing the SAA serial numbers. XX_SAA1_DATA.dat o Data file from the first SAA, all subsequent “SAA Data” files will be similar with sequential numbering (XX_SAAn_DATA.dat). XX_SERIAL_ERRORS.dat o A summary of communications and check sum errors for each record. This is present if there are errors or not. XX_LOGGER_DIAGNOSTICS.dat o This file contains the voltage, and temperature data for each CS Data Logger. XX_SAA_DIAGNOSTICS.dat o This file contains the voltage, current and temperature data for the SAAs. These two files will be present if one or more Measurand SAAPZ piezometers are used: 40 December 2014 SAA Software XX_PIEZO_INFO.dat o This file contains serial numbers for all SAAPZ’s connected to the CS Data Logger. XX_PIEZO_DATA.dat o This file contains the piezometer data for all the SAAPZ’s connected to the CS Data Logger. December 2014 41 5. SAACR_raw2data SAACR Applications are used to enable acquisition of and convert raw data acquired from one or more SAAs that are attached to a Campbell Scientific CR800, CR1000, or CR3000 data logger (similar to Figure 5.1). The raw data are converted into Cartesian (x, y, z) data that can be viewed in Measurand’s Viewer: SAAView (Section 7), or exported and sent to spreadsheets or other storage and viewing applications. It also converts piezometer, earth pressure cell, and strain gauge raw data for greater integration of data sets. If this is done, then SAA and non-SAA data may be viewed together on a single graph with a unified time base in SAAView (Section 7). Figure 5.1: Campbell Scientific Data Logger CR1000, CR800 & CR3000. Raw data are collected from one or more SAAs and stored on a CS Data Logger. Data files are then retrieved from the CS Data Logger. This process is repeated as desired, each time appending a file which holds multiple frames of raw data. The raw data are meaningless without being converted into engineering units, using Measurand “Calibration” files and 3D algorithms. SAACR Applications and Utilities are used to manipulate and convert raw data. The converted data file (“multi_saa_allcart.mat”) can be opened and viewed using Measurand’s SAAView (Section 7) viewer software. When a subsequent data conversion is made, any new data is stored in the same file so that all the data can be viewed as a complete series. This means the “multi_saa_allcart.mat” file grows over time. 5.1 Starting SAACR_raw2data SAACR_raw2data application takes raw data files, usually created by a CS Data Logger, and converts them into Cartesian data files that can be viewed in SAAView or exported to other applications. SAACR_raw2data not only converts raw SAA data but can convert raw data for non-SAA sensors like Piezometers, Earth Pressure Cells and Strain Gauges. When converted in SAACR_raw2data, the nonSAA sensors can be viewed in SAAView (Section 7) along with the SAA data in the same graph with a unified time base. 42 December 2014 SAA Software Figure 5.2: SAACR_raw2data initial window. 5.2 “Calibration” files “Calibration” files are required for SAACR_raw2data to work. The default location for Measurand “*.cal” “Calibration” files is in the ‘C:\Measurand inc\saarecorder\calibrations’ folder. Files for all production SAAs are placed there automatically whenever SAARecorder (Section 6) is installed or updated through SAASuite (Section 2). Manual installation of individual files is rarely required. If it is required each SAA has a “*.cal” file for the entire SAA with the following format: SAAF_45002_48.cal (The _48 indicates the number of segments, and is not always present; some older SAAs may have a word or words in place of the “45022” or similar serial number). For Model 2 SAAs there will also be one or more “subarray” files (one for every group of 8 segments in an SAA) with the following format: Subarray_45033.cal Note: The first number in an SAA “*.cal” file is the same as the number in the near-most (cable end) “subarray cal” file for that SAA. December 2014 43 In the SAARecorder installation folder SAA “Calibration” files must be in the ‘Calibrations\Arrays’ folder and the Subarray “Calibration” files must be in the ‘Calibration\Subarrays’ folder. Each folder can contain any number of “Calibration” files. Note: DO NOT RENAME OR MOVE THE FOLDERS! Additional files will be required if the following sensors are being used: Measurand PZ1_vw or PZ1_a piezometers (“SAAPZ”). Non-Measurand PZ3, EPC3, or SG3 vibrating wire sensors, where the “3” stands for “nonMeasurand” or “third party” sensor. Multiple SAAs laid end-to-end (usually with some overlapping) and it is desired to form a “virtual SAA” which acts as a single long SAA (“SuperSet SAA”). A “Convergence” or “Looped” SAA. The above require: 1. A “Site” calibration file describing the attached devices and any interrelationships. 2. A “non_saa_coeffs” calibration file for each non-SAA sensor (not needed for SuperSet OR Convergence SAA) containing calibration coefficients for the non-SAA sensors. These additional “Calibration” files can be found here: ‘C:\Measurand Inc\SAARecorder\calibrations\site\’ ‘C:\Meaurand Inc\SAARecorder\calibrations\non_saa_coeffs\’ More information on “Site” files can be found in Section 5.8. Please contact Measurand (Appendix K) if there are any issues and to ensure the correct files are obtained. There are example files installed automatically at ‘C:\Measurand Inc\SAAView\logger_files\site_file_examples’ and (with installation of SAARecorder (or SAASuite) which is essential to operation of SAACR_raw2data) in ‘C:\Measurand Inc\SAARecorder\calibrations\site’. These are very useful for practice or troubleshooting. 5.3 Files and Subfolders It is recommended, to ensure the application easily retrieves the correct “Project” files, that the CS Data Logger files be moved/copied to ‘C:\Measurand Inc\SAA3D\logger_files\[Project Name]’. If non-Measurand piezometers (3rd party piezometers), or other non-SAA, non-Measurand sensors are used then there must be a raw data file for each type, such as “XX_PIEZO_DATA.dat”, “XX_EPC_DATA.dat”, etc. 44 December 2014 SAA Software To practice using the application or to see the application working, there is an example project that has been installed in the ‘C:\Measurand Inc\SAAView\logger_files’ folder. The example folder contains some “*.dat” files produced by a Campbell Scientific Data Logger. PROJECT_INFO.dat File The “XX_PROJECT_INFO.dat” file contains information on all the SAAs attached to the CS Data Logger. Figure 5.3: An example of an “XX_PROJECT_INFO.dat” file that contains two SAAs. SAA_DATA.dat Files There is a data file for each SAA in the project, “XX_SAA1_DATA.dat” … “XX_SAAn_DATA.dat”. They contain raw data which cannot be directly interpreted without being calibrated and converted by SAACR_raw2data. Figure 5.4: An example of an “XX_SAAn_DATA.dat” file. December 2014 45 SERIAL_ERRORS.dat File This file is created whether there are errors or not during the communication process between the logger and the SAAs. Looking at Figure 5.6, row 1 is information about the CS Data Logger: Column Description 1 Time Stamp 2 Record Number 3 Serial Numbers (1,1) 4 Serial Number (2,1) 5 Serial Number (3,1) 6 Number of CRC Errors (1) 7 Number of CRC Errors (2) 8 Number of CRC Errors (3) 9 Number of COM Errors (1) 10 Number of COM Errors (2) 11 Number of COM Errors (3) Row 2 to 4 are column titles for the data that follows. Column 1 is the timestamp, column 2 is the record number (sequential), the columns after that are the serial numbers (one column per serial number), and the following columns are for the error counts (one CRC and COM column per serial number). If there are numbers other than zero in any of these columns then there was an error in communication. The CRC Error column(s) count packet errors (determined using an 8 bit sum of all data bytes) and COM Error column(s) count communication errors. Communication errors occur when not enough or no bytes are received. If errors occur then the first step is to double check all connections and power sources. Ensure enough power is getting to the SAAs, Non-SAAs and the CS Data Logger(s) and that all connections are secure and dry. Once this is complete the logger should be run again. If there are still errors in the “XX_SAAn_DATA.dat” file then contact Measurand for assistance (Appendix K). 46 December 2014 SAA Software Figure 5.5: An example of an “XX_SERIAL_ERRORS.dat” file. Figure 5.6: The example" XX_SERIAL_ERRORS.dat" file copied into Excel. DIAGNOSTIC Files The “XX_SAA_DIAGNOSTIC.dat” file presents voltage (in volts), current (in mA), and temperature (in deg C) for the SAAs connected. Each line of this file has the following information: timestamp, record #, SAA #1 serial number, SAA #2 serial number, ..., SAA #n serial number, SAA #1 voltage, SAA #1 current, SAA #1 temperature, SAA #2 voltage, SAA #2 current, SAA #2 temperature, ..., SAA #n voltage, SAA #n current, SAA #n temperature. The “XX_LOGGER_DIAGNOSTIC.dat” presents voltage (in volts), and temperature (in deg C) for the CS Data Logger. Each line of this file has the following info: Timestamp, record #, temperature, voltage Non-SAA Files There can also be “non-SAA sensor” files present. These can include conventional data tables from vibrating-wire piezometers, earth pressure cells, or strain gauges. Other “non-SAA sensor” files December 2014 47 include those from Measurand piezometers which have a digital interface like that of the SAA. If Measurand piezometers are present, there will be an “XX_PIEZO_INFO.dat” file and an “XX_PIEZO_DATA.dat” data file or files (one for each COM port serving the piezometers). For more information on non-SAA sensors see the Non-SAA Sensors Section 5.9 or SAACR_Raw2DataConfiguration Tab Section 3.2 on automating conversion. Export Files The default export type is “DIY” (Do-it yourself), these files can be configured by the user to include data in various formats. The base export is the “multi_saa_allcart.mat” file holding converted Cartesian data, it is always created and found in the project folder. This file is viewable in SAAView (Section 7) and useable in Matlab. If the default DIY type folder is selected for export then all exports will appear in a DIY subfolder. If older legacy formats are selected, they will appear in the project folder or in auto-named folders like “Atlas”. 5.3.6.1 DIY Subfolder DIY Subfolders are created after file conversion in conjunction with requested converted files to ease the process of using converted data wherever the user prefers. The subfolder holds two or more files depending on the number of SAAs. There is a text file, “saa_export_info.txt” that provides the settings from the last conversion as well as export format definitions. The other file(s) are titled using the SAA type (SAAF, SAAScan…), the calibration file number, the number of segments (not always included) and the segment size (SAAF_46528_60_500.dat). These files are comma delimited text files that can be opened in any text reading software. Figure 5.7: Common ‘DIY’ folder contents. 48 December 2014 SAA Software Figure 5.8: A view of the “saa_export_info.txt” file in the ‘DIY’ folder. 5.3.6.2 Archive Subfolder Every time SAACR_raw2data runs, it creates a “Binary” file called multi_saa_allcart.mat, containing the Cartesian data. To avoid long processing times for SAACR_raw2data, an “Archive” file for previously-converted data can be created. An “Archive” file is the above “Binary” file, renamed to “multi_saa_allcart_archive.mat”, and placed in a subfolder of the ‘Project’ folder, named “Archive”. Whenever SAACR_raw2data runs, it will look for the “multi_saa_allcart_archive.mat” file. If it finds the “Archive” file, it will convert any new raw data and concatenate it to the “Archive” file. It will then place the result in the project folder as a new multi_saa_allcart.mat, with all available data. This means that the application needs only new raw data, and the “Archive” file, to run. The conversion and concatenation will happen in both ‘OK (Auto)’ and ‘Reset’ opening modes. The “multi_saa_allcart.mat” file will eventually grow again, in which case the “multi_saa_allcart_archive.mat” file can be replaced again by renaming and moving the “multi_saa_allcart.mat” file. This can be done any number of times. It is prudent to first save all the files into a backup folder in case mistakes are made. Note that ‘OK (Auto)’ only does something if there really is new raw data. December 2014 49 5.4 Utilities Various utility programs are installed with SAACR_raw2data and can be accessed in SAASuite (Section 2). They are included in this manual and are located in Appendix A. SAACR_raw2raw_concat: concatenates raw data files (SAA or non-SAA), Appendix A.1. SAACR_cart2cart: concatenates two or more Cartesian “SAA Data” files, Appendix A.2. SAACR_cart2cart_matchup: concatenates two data files (SAA or non-SAA) including when the sensors have been moved, added, or deleted so the data are “unmatched”, Appendix A.3. SAACR_cart2manycart: breaks up a “multi_saa_allcart.mat” file into one file per SAA, Appendix A.4. 5.5 Getting Started Note: Hovering the mouse over most of the controls will cause a definition of the control to appear. The SAACR_raw2data application can be started by one of the following options: 1. Clicking on the desktop icon for SAASuite then clicking on the ‘SAACR_raw2data’ button. 2. Running SAACR_raw2data.exe directly from its installation folder, “C:\Measurand Inc\SAA3D”. The window in Figure 5.9 opens and three options are available: 1. Click Reset’ Is used for initial setup and troubleshooting. This mode enables file selection and settings. It behaves as though no conversions have previously been performed. Therefore any existing converted data will be over-written, and all raw data (old or new) will be converted. 2. Click OK (Auto) Use AFTER an initial conversion using ‘Reset’. ‘OK (Auto)’ mimics the behavior of the application when running automatically, such as from a command-line call from LoggerNet Software. (If ‘Reset’ was NOT used before on the current data then ‘OK (Auto)’ will behave like ‘Reset’). When called from the command-line (Section 5.5.4) the application willrun without interruption and will provide feedback to the user through a “Log” file “saacr_raw2data_logfile.txt”, but not reviewable on the ‘Main View’ window. In contrast, the ‘Reset’ or ‘OK (Auto)’ mode, through SAACR_raw2data, provides a reviewable record of operations on the ‘Main View’ window and in “saacr_raw2data_logfile.txt” showing the same thing. 3. Click Quit To close SAACR_raw2data. 50 December 2014 SAA Software Figure 5.9: ‘Startup’ window with three options. Logger Raw Data File Window To begin a new project, or to troubleshoot or make new settings to an existing project use the ‘Reset’ button to open the “Logger Raw Data File”. ‘OK (Auto)’ button is for use after the project is set up, to confirm automatic (Auto) behavior consistent with a command-line call from LoggerNet. By clicking the ‘Reset’ button the ‘Logger Raw Data File’ window will open, shown in Figure 5.10. This window should be clear unless previously used. If previously used, the last project run will appear. Figure 5.10: ‘Logger Raw Data File’ window. 5.5.1.1 Selecting a Project - Reset If the ‘Logger Raw Data File’ window is blank OR the files listed are not the current project then click the ‘New Project’ button. This opens a file browser where the current project can be selected. Browse to the “Project” file (found in “C:\measurand inc\saa3d\logger files”) and click on any file in the project folder. When naming a project be clear and distinct to avoid confusion with other projects. December 2014 51 5.5.1.2 Selecting Files - Reset This is the first conversion therefore three things need to be done here: 1. Select a project. 2. Select data. 3. Are there non-SAA sensors or a SuperSet (two or more SAAs to be made into one longer SAA)? If so, add a “Site” file (Section 5.8). In most cases a project folder can be selected containing the files, and SAACR_raw2data will automate the rest of the process by assigning the files to “Types” including raw data files and a “project_info” file. Unusual file names can lead to improper selection, so it is recommended that the results are checked. SAACR_raw2data will remember the selections and apply them automatically during the next conversion. The next conversion will be performed on files with the same names, acquired since the first conversion. SAACR_raw2data will concatenate new data onto old data, saving a record of all converted data. If this is a first time use, the file selection dialog will be blank as seen in Figure 5.11. Click on ‘New Project’ at the top of the window, select the “example” folder, as seen in Figure 5.12, and then any file in that folder. Figure 5.11: First time use ‘New Project’, only one select file window will open at a time. 52 December 2014 SAA Software Figure 5.12: The example folder that can be found in ‘C:\Measurand Inc\SAA3D\logger_files\’. Figure 5.13: This is what the ‘Example’ project folder looks like, the “Errors” file will be ignored. SAACR_raw2data will select the files it needs and assign them a “type”. In this case SAACR_raw2data detected more than one SAA so has highlighted the ‘Browse’ and ‘Info’ buttons associated with selection of a “Site” file. A “Site” file is only needed if a “SuperSet SAA” or a “Convergence SAA” (see Section 5.8) is being formed or there are non-SAA sensors present (see Section 5.9). The ‘Info’ button provides details on “Site” files, also see Section 5.8. Figure 5.14: The ‘File Selection’ window displaying the files from the ‘Example’ folder. Note: The ‘info’ and ‘Browse’ buttons for the “Site” file at the bottom right of the window turn yellow when a “Site” file is required. SAACR_raw2data assigns file types based on the project and data file names. Default names contain “PROJECT_INFO” for “Project” files and “SAA#_DATA” for SAA raw data files (where # is the number of the SAA, such as 1, 2, etc.). If these file names are too creative, SAACR_raw2data may fail to assign December 2014 53 types properly. So, it is important to review the files and their types! This shouldn’t be a problem if the files were created using a logger program created using SAACR_FileGenerator Tab (Section 3.1). If SAACR_raw2data did not correctly choose files or file types there are ‘Clear’ and ‘Browse’ buttons available to make corrections manually. Once the file and type selections are completed click ‘OK’ The files and type selections will not have to be checked again. A re-start of SAACR_raw2data will present the list of files and types used in the latest completed conversion. The ‘New Project’ button is used to select a different project previously saved and will automatically load that project’s files and types. “Calibration” files If the “Calibration” files are not present a prompt will appear requesting them. To retrieve them, download the “Calibration” files directly from SAASuite (see Section 2.1.3) or download and install the most recent versions of SAASuite and SAARecorder (Section 1.2). SAASuite will place the “Calibration” files where SAACR_raw2data can find them. Selecting Settings A “Settings” window will appear mid-way through the conversion, after calibration and data files have been examined for content. The settings must match the physical state of the SAA or the conversion will be incorrect! Each SAA, if not convergence (XZ Section), is either near-vertical (3D calculations) or near-horizontal (2D calculations). Convergence SAAs do not use the ‘Vertical’ checkbox. The reference location for each SAA is either at the far end (lowest point for vertical SAA) or near end (the cable end, top for vertical SAA). Figure 5.15: The ‘Settings’ window. The ‘Settings’ window will appear similar to Figure 5.15. Follow the subsequent steps to complete the settings setup: 1. Sernum: (Read only) is the list of all the SAA Serial Numbers in the files selected. 2. Vertical: 54 December 2014 SAA Software 3. 4. 5. 6. 7. 8. Check if the SAA is within 60 degrees of vertical, rather than mostly horizontal. If “Site” file indicates an “XZ Section” (convergence shape), then ‘XZSect’ text appears. Ref=far: Check if the data are to be calculated from the FAR end (cable is at NEAR end). Az, deg: Enter any desired Azimuth (Heading) offset (degrees, clockwise is positive) for each SAA. NumSeg: The number of segments in the SAA. StartSeg: Segment = 1 at cable (near) end. If a number larger than 1 is entered then all previous segments will be ignored. EndSeg: Default: EndSeg = NumSeg. If a number smaller than the total number of segments is entered than all segments after will be ignored. SlavedSeg: Use ‘Edit Slaved’ button to enter any desired Slaved Segments (slaved segments will be assigned the tilt of the previous segment in order of calculation). Note that although the assignment of tilt is always in the order of calculation, 1 is always the NEAR (Cable) end. For example, if the reference end is the non-cable end, and 1 is selected for slaving, then the segment nearest the cable (1) will be assigned the tilt of segment 2. If the far most segment is slaved and the reference is at the far end, there is no ‘previous’ segment. In this case the tilt of the nearest non-slaved segment will be assigned. Note: Although the assignment of tilt is always in order of calculation, 1 is always the NEAR (cable) end. 9. Edit Slaved Button: Click to select which segments to Slave. Figure 5.16 will appear with the SAA Serial Number and selection box for each individual segment where 1 = cable end. 10. Export Format Button: Select an ASCII or MATLAB export format (see Sections 5.5.3.1 & Appendix H.1). A “DIY” format is recommended over “legacy” formats. 11. UTC Offset, Hours: Offset from CS Data Logger clock in hours. This is optional. 12. **Advanced (mag) Button: Saves and displays a file of magnetometer data, if the SAA is equipped with magnetometers. On first conversions, the user must choose “quiet” mag data to use for azimuth corrections. December 2014 55 The mag data selection on the first conversion is used on all subsequent conversions. This is to avoid problems from magnetic fluctuations such as from passing vehicles or equipment. Note: If the SAA is equipped with magnetometers, an additional button called ‘Advanced (mag)’ will appear. See Section 5.7. Figure 5.16: ‘Editing Slaved Segments’ for SAA with Serial Number 45821. Note: There is no longer a checkbox for export mode. ‘Export Format’ button raises an export dialog with “DIY” formats as the default. To select the export formats click the ‘Export Format’ button, this opens a new window. The following is a listing of available formats and what they are. 56 December 2014 SAA Software Figure 5.17: ‘Export Format’ window. 5.5.3.1 Current Export Formats and Data Types De-select the ‘Use a Legacy Format’ check box. Check it only if an older format is being maintained. Select the option(s) that best suit the available viewer. One to several Types can be selected keeping in mind that the more Types selected, the larger the files will be. Types of Data: XYZ: o o Cumulative Deviation (absolute position) The absolute shape: XYZ positions of vertices, without any reference subtracted. Z represents the absolute SAA vertex positions in the vertical dimension. It is not a path length. diff (XY), Z: o Incremental Deviation (expected by VDV) o The difference in X and Y position between two ends of each segment, without any reference subtracted. Accelerations o (accelX, accelY, accelZ) o The accelerations in segment local XYZ coordinates. Note that here, the third variable is an acceleration not a distance along the Z axis. Curvature o dtheta/ds where dtheta is the change in angle per segment, ds is the segment length. Temperature o The temperature in each segment (NaN if no temperature sensor in that segment). December 2014 57 5.5.3.2 DIY Format Definitions One file per SAA will be created. Select types of data to export either in ASCII “*.dat” or MATLAB “*.mat” format. All selected ASCII types appear in the same “*.dat” file row per timestamp in the order of this dialog (MATLAB format is a binary structure). Z data (unless accelZ) will appear only once per row. Formats: 58 ASCII “*.dat” file o Export a “.dat” file. MATLAB “*.mat” file o Export a “.mat” file. Metric Units o Millimeter lateral, Meter axial, Degrees Celsius. Imperial Units o Inches lateral, Feet axial, Degrees Fahrenheit. All Data o All data for all time will be exported, including any new data. New Data Only o Any new (not exported before) data will be exported and must be retrieved before the next export. Unique Stamped Files o ASCII files will not over-write existing files and their filenames will include a unique PC timestamp. Raw Filenames o Each ASCII filename will include the name of the raw data file associated with that SAA, instead of the serial number for that SAA. IF ‘Unique Stamped Files’ is not selected, the export files can have the same names as the raw data files. They will be in the ‘DIY’ folder. Chunk the Files o Data files will be limited to 500 frames each, each nth file will have a “_n” suffix. As each chunk is filled, a new chunk file will appear. Use a Header (Mandatory for VDV) o Include a DAT-style header in ASCII “*.dat” files. December 2014 SAA Software Figure 5.18: ‘Export format’ window for ‘Legacy’ formats. Progress and results can be viewed in the SAACR_raw2data progress window, see Figure 5.19 . Figure 5.19: SAACR_raw2data ‘Progress’ window. Command-Line Operation To convert files automatically, a program can be written that calls SAACR_raw2data with a filename argument. The argument is the full-path filename of the “pref_project.txt” file, e.g. Saacr_raw2data.exe “C:\measurand inc\saaview\logger_files\example\pref_project.txt” Before using this command-line call the “pref_project.txt” file must be created. There are two ways to generate the “pref_project.txt” file: 1. Run SAACR_raw2data manually once. December 2014 59 During the first run using the ‘Reset’ option, details can be changed or added such as DIY export format or changing the reference end of an SAA. 2. Run SAACR_FileGenerator Tab (Section 3.2) If no raw data files are available this is the only way to generate a “pref_project.txt” file for the command-line operation. Note that SAACR_FileGenerator Tab will produce a basic “pref_project.txt” file sufficient for SAACR_raw2data to run. During a first run using the ‘Reset’ option details can be changed or added such as changing the reference end of an SAA. Refer to Section 4.2.4 (Automated Data Conversions) for using the Task Master utility of LoggerNet to call SAACR_raw2data automatically. Note: The “pref_project.txt” file is only required to run the command-line operation but it is not required to run SAACR_raw2data. 5.6 Reviewing the Files SAACR_raw2data will have left up to five files in the project folder (possibly more for a new “server_mat” export option) and the DIY folder (Section 5.3.6.1). File descriptions: 60 multi_saa_allcart.mat o MATLAB concatenated Cartesian data. o Always contains all converted data. It is the source for any selected formatted ASCII “*.txt” files. pref_project.txt o Settings and other project specific information, used by SAACR_raw2data. file_setup.mat o A list of files used for this conversion. settings_reload.mat o Tells SAACR_raw2data which project to reload on start-up and project information. saacr_raw2data_logfile.txt o Stores all data that was available in the ‘Progress’ window during the conversion. December 2014 SAA Software Figure 5.20: A view of the "saacr_raw2data_logfile.txt" which is a record of the ‘Progress’ window, see Figure 5.19 Note: Except when using some special MATLAB only exports, MATLAB current Cartesian data files (“multi_saa_curcart.mat”) are no longer formed. Instead, pointers keep track of current and older data in “multi_saa_allcart.mat”. Formation of files depends on CS Data Logger settings. Figure 5.21: Most common files left by raw2data in the ‘Project’ folder. Cartesian data formats can vary, depending on selection Please examine the file and get familiar with its contents, Figure 5.22 is a good example. December 2014 61 Figure 5.22: A typical DIY data file, ‘SAAF_45821_60_500.dat’, copied into Excel. Viewing the Data The “multi_saa_allcart.mat” file is viewable in the SAAView application. (Section 7). 5.7 Magnetometers Some SAAs contain magnetometer(s), to determine the direction of the earth’s magnetic field. The magnitude of the Earth’s magnetic field is normalized to be 1.0 at Measurand’s factory location in New Brunswick, Canada. Magnetometers in SAAs Some SAAs are equipped with magnetometers (mags), upon request. These are used in vertical SAAs to: Automatically make the XY data relative to magnetic north, regardless of the direction of the X-mark on the SAA. Correct any twist between magnetometers, using interpolation; and beyond the top magnetometer, using extrapolation. The user selects a set of magnetometer data to use for the above purposes, and may “turn off” any magnetometer that shows evidence of being influenced by external fields (such as from buried ferrous metal). The set of magnetometer data used is a user selected frame or an average of many frames also user selected, and all magnetometers can be used. Once magnetometer settings have been made by the user, the same set of data is used automatically in all subsequent conversions. First Conversion Setup If magnetometers are used in any SAA attached to a CS Data Logger, SAACR_raw2data will automatically guide the user through setup steps on the first conversion. 62 December 2014 SAA Software Figure 5.23: This “test” project includes one SAA two with magnetometers. 1. For help starting from the beginning go to Section 5.5.3. 2. The “Settings” window, seen in Figure 5.24, shows the ‘Advanced (mag)’ button. This is only to be used for the first run, click this button. Figure 5.24: The ‘Settings’ window with the ‘Advanced (mag)’ button. 3. The ‘Advanced (mag)’ button should be ignored on all subsequent runs. 4. The notice in Figure 5.25 will appear. Figure 5.25: The notice appears on the first run through SAACR_raw2data when a mag is present. 5. The user will be asked to save magnetometer data in the “magdata” subfolder (automatically created in the project folder) see Figure 5.26. o It is saved as “magdata.mat” as seen in Figure 5.27. At this point it is best to use this default format. December 2014 63 Figure 5.26: The ‘magdata’ subfolder automatically created in the ‘Project’ folder. 6. Click ‘Save’. 7. The user will be asked to select a “magdata.mat” (or other user-named “Magdata” file) in the same folder, select it (see Figure 5.26). It should be the file created in the previous step. Figure 5.27: The “magdata.mat” file to be saved in the ‘magdata’ subfolder. 8. Click ‘Open’. 9. A message similar to Figure 5.28 will appear. It is recommended that the ‘Specific Settings’ button be clicked. Figure 5.28: The ‘Choose Mode’ window that appears. 10. SAACR_magtool will open, see Figure 5.29, and will show changes in the magnetometer headings over time. Make all desired alterations using the following information: 64 December 2014 SAA Software Figure 5.29: The ‘Initial’ window of the ‘Magtool’. Legend o A list of the Magnetometers within the selected SAA and their location; top, middle, bottom. ‘az’ Button - SAACR_raw2data opens in “az” (azimuth, or headings) mode. The object is to select headings that are not influenced by some disturbance, such as a large vehicle parked near the SAA. In “az” mode, the vertical dashed line is controlled by the right mouse button. Date and time are read out at the top of the line. o One per SAA. o Displays the change in Azimuth per mag for the selected SAA. Dashed Line on ‘az’ Graph o Only available when ‘az’ is clicked. Figure 5.30 o Drag the dashed line to where there is a quiet time, Right-click the dashed line to select the quiet mag time by clicking ‘Select This Time’. The ‘az’ button turns green indicating that the selection process is complete. December 2014 65 Figure 5.30: The menu that appears upon right-clicking the mouse on the dashed line. ‘tot’ Button - Select the ‘tot’ button. The magnitude of the magnetic field at each mag of an SAA will be shown, for all times. The vertical line (now dotted) is still available, but is not used to make selections. By selecting any mag line with the right mouse button the user can turn off that mag if desired, see Figure 5.32. o One per SAA. o Displays total magnitude per mag for selected SAA. Mag Lines on ‘tot’ Graph o Only clickable when ‘tot’ is clicked. Figure 5.31 o Right-click a colored mag line to turn it off or on, The mag that is turned off becomes a dashed line indicating that it is off. To turn a mag back on, right-click the dashed-line and select ‘Cancel/Restore’. Figure 5.31: The ‘Magtool’ with the ‘tot’ button selected. Figure 5.32: The menu available by right-clicking the mouse over a mag line while in ‘tot’ mode. 66 AutoScale / DefaultScale o Clicking this tab switches between the two options. Mags Off / Mags On o This tab allows the user to turn off all Magnetometers. December 2014 SAA Software OK Button o Click when selections are complete to continue. Note: Hovering the mouse over most of the controls will cause a definition of the control to appear. 11. Repeat this process with all the SAAs. 12. Click ‘OK’. Note: the magnitude of the magnetic field is different for different geographic locations. Values seen in the graph should be assessed according to the local expected field, which can be found by searching the internet. 13. A notice (see Figure 5.33) will show that: A “roll_corrections.txt” file has been saved. This is the file used by SAACR_raw2data to make corrections to all subsequent raw data. A “headings.txt” file will also be saved. It can be used to review magnetometer data in more detail. 14. Click ‘OK’. Figure 5.33: A notice announcing that a “roll_calibration.txt” file has been created and saved. 15. Another notice (see Figure 5.34) will appear to remind the user to run SAACR_raw2data again to apply the magnetometer corrections. The next time that SAACR_raw2data is run, the user must click the ‘RESET’ button on startup. Thereafter, when they are converting additional data, they can click the ‘OK’ button to convert any new data. 16. Click ‘OK’. December 2014 67 Figure 5.34: A reminder to run SAACR_raw2data over again to apply the magnetometer corrections. The next time that SAACR_raw2data is run, the user must click the ‘RESET’ button on startup. Thereafter, when they are converting additional data, they can click the ‘OK’ button to convert any new data. 17. 18. 19. 20. Close SAACR_raw2data and re-open it. Click ‘Reset’. Choose the current project and click ‘OK’. For assistance with this process as there will be no Mag data requests, go to Section 5.5.3. 5.8 “Site” Files “Site” files are required when using Superset SAAs, Convergence SAAs and/or non-SAA sensors. “Site” files can normally be found in ‘C:\Measurand Inc\SAARecorder\calibrations\site\’. If a “Site” file is not available one can be created by the user using a notepad program, an example “Site” file and knowledge of the non-SAAs. Otherwise contact Measurand for assistance (Appendix K). There can be only one “Site” file for a project. All “Site” file fields can appear in a single “Site” file. For instance, a “Site” file might configure a superset SAA and three piezometers. Superset SAAs Multiple SAAs may be associated to make one longer SAA: a “Super-SAA” or “SuperSet SAA”. The individual SAAs must be laid end-to-end, and normally are overlapping by one or two segments, and tied together mechanically. The association is done in a “Site” file. The following Figure 5.35 is the “Site” file for a SuperSet SAA. The Super-SAA is defined pair-wise. Since it is possible, particularly for horizontal SAAs, that some might be turned around end-to-end, the definition includes “far_ref”, which means “referenced to the far end”. “Total Extents” are the beginning and ending segments that are to be included in the Super-SAA. Overlaps define the segments that are common between the two SAAs in a pair. 68 December 2014 SAA Software Figure 5.35: “Site” file for a SuperSet SAA. Note: It is possible for an SAA to overlap and then “keep going” but the part beyond the overlap can be “ignored” by manipulating the “total_extents” entries. “Site” files for Super-SAAs are the same “Site” files used to define non-SAA sensors. If a project includes Super-SAAs and non-SAA sensors, a single “Site” file is used, with fields for each purpose. Super-SAAs will appear in SAAView along with individual SAAs. For instance, if there are five SAAs combined into one Super-SAA, SAAView will show the five, plus one additional Super-SAA (autolabeled as such). Convergence SAAs “Convergence” SAAs include both horizontal and vertical portions. Typically these travel in a “loop” around part or all of the circumference of a tunnel. They must be converted using special mathematics. This is accomplished by selecting a “Site” file created for the purpose, near the bottom of the ‘File Selection’ window. It is MANDATORY that Version 5.70 or higher of SAARecorder be installed since SAARecorder is involved automatically in the conversion process. December 2014 69 The “Site” file for two Convergence SAAs (also called “Section” or “Loop”) is shown in Figure 5.36 and is installed automatically at 'C:\Measurand Inc\SAA3D\logger_files\site_file_examples’. Read the description at the top and then edit this example file to suit the number of Convergence-SAAs. Once it has been edited for the setup, it should be copied to ‘C:\Measurand Inc\SAARecorder\calibrations\site’. Figure 5.36: “Site” file for a Convergence SAA. Also in ‘C:\Measurand Inc\SAA3D\logger_files\site_file_examples’, “site_convergence_xz_section_51796.cal” can be found, which if moved to ‘C:\Measurand Inc\SAARecorder\calibrations\site’, will serve for the example project folder “loop_example_top_out_right_in”, found in ‘C:\Measurand Inc\SAA3D\logger_files\’. These example files are automatically installed for “practice” conversions and viewing of “Convergence-SAA” data. 5.9 Non-SAA Sensors Non-SAA Sensors include Piezometers (PZs), Earth Pressure Cells (EPCs) and Strain Gauges (SGs). If any of these sensors are attached to the CS Data Logger they can be included in Measurand data sets by including them in the SAACR_raw2data conversion process. All non-SAA sensors require a common “Site” file and an individual “non_saa_coeffs” calibration file, one per sensor. The default locations for these are: ‘C:\Measurand Inc\SAARecorder\calibrations\site\’ ‘C:\Meaurand Inc\SAARecorder\calibrations\non_saa_coeffs\’ 70 December 2014 SAA Software Note: Don’t forget to include the “Site” file before running SAACR_raw2data when there are non-SAAs present. Piezometer (PZ) Piezometers (PZ) sensors can be of three general types: PZ3: These are conventional vibrating-wire (VW) piezometers, using a conventional VW interface to the CS Data Logger. The “3” indicates they are “third-party”, or “non-Measurand” sensors. The CS Data Logger program creates a raw data table of “digits” and temperatures. The “Site” file designates which columns of the data table are to be used in the conversion to pressure, and what the units shall be. It also contains other site-specific data such as elevations, depths, latitude and longitude. The “non_saa_coeffs” files contain the calibration constants of the sensors. PZ1_a: These are legacy Measurand piezometers used in one development project. PZ1_vw (SAAPZ): These are conventional VW piezometers fitted with a Measurand microprocessor-based interface at the sensor. The microprocessor converts the VW frequency to digital. Digital data enter the CS Data Logger through a Measurand SAA232 or SAA232-5 interface. The CS Data Logger creates a “*PZ_INFO*.dat” file containing the serial numbers of the PZ1_vw microprocessors. It also creates a raw data file containing the digital data and temperatures from digital temperature sensors in the PZlocal microprocessor. The “Site” and “non_saa_coeffs” files are the same as for PZ3 (above). Because the data handling and cabling can be very similar to that of an SAA, PZ1_a and PZ1_vw sensors are sometimes called “SAAP”. The three types of Piezometer all look similar (Figure 5.37 shows a PZ1_vw) except that the PZ3 does not have a microprocessor-based interface December 2014 71 Figure 5.37: PZ1_vw sensor mounted to 27 mm ID PVC conduit (SAA inside). The VW piezometer (made by Geokon) is on the left and the Measurand microprocessor-based interface is on the right. The following is a breakdown of a “Site” file using Figure 5.38 as an example: 72 cr_sernum o The serial number of the CS Data Logger. Essential to prevent misuse of this file with other sets of sensors. The serial number can be found on the data logger. num o The number of PZ3 sensors attached. data_format o The format in which the data is in. raw2engr_cols o The columns in the data table to use for conversion to pressures. raw2engr_polynomial_calc: o 1 for polynomial calculation; 0 for linear already in data file. raw2tempc_cols: o The columns in the data table to use for conversions to temperatures. raw2tempc_polynomial_calc: o 1 for polynomial calculation; 0 for linear already in data file. raw2tempc_Coefficients_abc: o Temperature coefficients for thermistors. p_raw_units: o These can be digits, frequency, degrees Celsius or resist. t_raw_units: December 2014 SAA Software o These can be digits, frequency, degrees Celsius or resist. [pz3_01]: o The first piezometer (order must match the column order of the data table). serialnumber: o Mandatory so SAACR_raw2data can find the corresponding “non_saa_coeffs.cal” file. label, latitude, longitude, notes: o Not essential. elev_m: o May be needed, depending on data format. elev_offset_m: o Essential. In Figure 5.38, under [pz3] num listed “5”, therefore 5 PZ3s will be listed [pz3_01] through [pz3_05]. Figure 5.38: Excerpt from a “Site” file which includes 5 PZ3 sensors. December 2014 73 Figure 5.39: Excerpt from a “Site” file which includes 7 PZ1_vw sensors. Figure 5.39 is almost identical to Figure 5.40 except that “cr_sernum” is not shown. The “*project_info*.dat” file and “pz_data” files, along with the unique serial numbers built into PZ1 interfaces, ensure that the “Site” file cannot be used with unintended sensors. 74 December 2014 SAA Software Figure 5.40: Excerpt from a “Site” file which includes 7 PZ1_a sensors. The “Site” file in Figure 5.40 does not include any column definitions like in Figure 5.38. This is because PZ1_a and PZ1_vw sensors have microprocessors with unique addresses, they have a “piezo_info” file that lists the serial numbers and one data table per serial port. Each serial port can have more than one sensor attached through an SAA232 or SAA232-5 interface. December 2014 75 Figure 5.41: The “piezo_info” file for PZ1_a sensors from Figure 5.40. The “piezo_info” file for PZ1_a or PZ1_vw sensors is similar to the “project_info” file for SAAs. It defines the grouping of PZ1_a serial numbers by serial port. The serial number lists are padded with zeroes so that each port has the same number of columns. Figure 5.42: Data table for one of the ports handling three PZ1_a sensors. Temperatures in Figure 5.42 are from a digital sensor and are reported directly as degrees Celsius. 76 December 2014 SAA Software Figure 5.43: ‘Progress’ window showing the PZ1_a serial numbers reported by SAACR_raw2data during conversion. They match those of the “piezo_info.dat” file. Figure 5.44: PZ1_a data appears in “pz1_data.txt” in the ‘Project’ folder. Note: When converting, additional information appears in the SAACR_raw2data ‘Progress’ window and is logged in “saacr_raw2data logfile.txt”. December 2014 77 Figure 5.45: Example of a “Site” file with PZ1_a sensors being used with SAAs and “piezo_data.dat” files in SAACR_raw2data. Figure 5.46: ‘Project’ folder for Figure 5.45. 78 December 2014 SAA Software There are 9 SAAs and three ports in Figure 5.46 each handling multiple PZ1_a’s (total of 7). Each port has a “piezo#_data.dat” files associated with it. The “diagnostics” and “serial _errors” files are not used by SAACR_raw2data. Figure 5.47: Example of a CS Data Logger data table from PZ3 sensors. In Figure 5.47 there are five PZ3s (columns 3 - 7) and five thermistor temperatures (already converted by the CS Data Logger, columns 8 - 12). The column contents are defined in the “Site” file. The conversion method for temperature (none) is also defined in the “Site” file. Earth Pressure Cells (EPCs) & Strain Gauges (SGs) Earth Pressure Cells (EPCs) and Strain Gauges (SGs) are handled almost the same as PZ3 sensors. These are conventional vibrating-wire (VW) sensors, using a conventional VW interface to the CS Data Logger. The CS Data Logger program creates a raw data table of “digits” and temperatures. The “Site” file designates which columns of the data table are to be used in the conversion to engineering units, and what the units shall be. It also contains other site-specific data such as elevations, depths, latitude and longitude. The “non_saa_coeffs” files contain the calibration constants of the sensors. In keeping with the PZ3, PZ1_a and PZ1_vw nomenclature, these sensors are called “EPC3” and “SG3” non-SAA sensors. December 2014 79 Figure 5.48: Excerpt from a “’Site” file which includes EPC3 sensors Figure 5.49: Excerpt from a “Site” file which includes SG3 sensors. “non_saa_coeffs.cal” File The “non_saa_coeffs” cal file is the same for any of the non-SAA sensors (PZ1, PZ3, EPC, SG). The serial number in the file is assigned by the manufacturer (Measurand or third party) and must match the serial number entry for that sensor in the “Site” file. Also, the [psi] field is never used by SAACR_raw2data, so can be left blank. 80 December 2014 SAA Software Figure 5.50: A “non_saa_coeffs.cal” file for an EPC3 sensor (seen in Figure 5.48). Figure 5.51: A “non_saa_coeffs.cal” file for an SG3 sensor (seen in Figure 5.49). December 2014 81 6. SAARecorder SAARecorder is the Measurand PC software used to view and record data from ShapeAccelArrays (SAAs). SAA shape, motion, and accelerations can be viewed numerically or in graphical format in realtime. SAARecorder can save data from SAAs in either raw binary format, or a variety of different text formats. It can also export saved raw data to Measurand's SAAView application (Section 7). A number of diagnostic functions are provided within SAARecorder to verify correct functioning of any connected SAAs. 6.1 Connecting Hardware Note: If an older system is being used with a separate Ethernet data concentrator, then please refer instead to the instructions found in Appendix C for connecting hardware. At any time during the connection process (‘Connect SAA’) the user can save or open a configuration. On the left of the ‘Connect SAA’ window, under all tabs, are configuration buttons. New Configuration Button o Clicking this button clears all previously made selections in the ‘Connection’ window. Open Configuration Button o An ‘Open File’ window allowing the user to select a previously saved configuration. Save and Exit Button o A ‘Save File’ window opens allowing the user to name and save the current connection selections and then closes SAARecorder. *_[serial number].txt Button o All recently saved configuration files are listed as buttons under the ‘New Configuration’ Button. Figure 6.1: The ‘Configuration’ buttons on the left of the ‘Connect SAA’ window. Also, under the ‘Test’ tab is a ‘Save and Continue’ button, see Figure 6.16. 82 December 2014 SAA Software Save and Continue Button o A ‘Save File’ window opens allowing the user to name and save the current connection selections and then opens SAARecorder. Connect SAA 1. Start SAARecorder application to collect data. Once the application starts trying to communicate with the SAA, the red LED on the SAA232 should light up and the red & green lights on the USB will light up as well. 2. The ‘Startup’ window will appear (Figure 6.2) Figure 6.2: The ‘Startup’ window. This window appears once SAARecorder has been initialized. 3. Click ‘Connect SAA’. Connecting using the SAAFPU Single SAAs or an SAAPZ can be connected to Measurand’s SAA Field Power Unit (SAAFPU) shown in Figure 6.3. The SAAFPU is a portable unit designed for collecting SAA data manually in either the field or in the office. It serves as a portable interface between one SAA and a PC running the SAARecorder application, or between one SAA and an Android device running the SAADroid application. Figure 6.3: SAA Field Power Unit (SAAFPU) in center. December 2014 83 Figure 6.4: Model 003 SAA Field Power Unit Interface. (A) 4-pin circular connector wiring design, N.B. The physical connector is external (not shown here) located on the left side of the SAAFPU, (B) 5-pin terminal block, (C) Battery charge level meter, (D) Auxiliary 4-pin terminal block. Power to the SAA is controlled via SAARecorder or SAADroid. Therefore the following steps should be taken when using the SAAFPU with an SAA or SAAPZ: 1. Connect the SAA or SAAPZ to the SAAFPU with either the 4-pin circular connector or the 5-pin terminal block. (See Figure 6.4 A & B). Note: Only one SAA or daisy chained SAA/SAAPZ can be connected to the SAAFPU at one time. Two or more SAAs CANNOT be connected to the SAAFPU at one time! 2. To connect the SAA or SAAPZ to the green 5-pin connector, the wiring is as follows: Pin 1: White SAA cable (RS485 A) Pin 2: Blue SAA cable (RS485 B) Pin 3: Red SAA cable (+12 V to SAA) Pin 4: Black SAA cable (GND) Pin 5: Shield 84 December 2014 SAA Software Note: If an older SAA is being used, the wiring may use different colors for the RS485 A and B communications wires, please check with Measurand if the user is unsure how to connect these wires. 3. There are two methods to connect the SAAFPU to a PC running SAARecorder: a. Connecting the SAAFPU directly to a PC: Connect the serial to USB cable provided with the SAAFPU (shown on the right in Figure 6.3) to the serial cable on the front facing plate of the SAAFPU. Once this is done, plug the USB connector into a USB port on the PC. The serial connection does not have any screws because it is meant to act as a quick release point in case the cable is snagged or the SAAFPU falls. b. Connecting the SAAFPU wirelessly to a PC: The SAAFPU comes equipped with a set of two wireless adapters (shown on the left in Figure 6.3). One adapter in the pair is equipped with a 9-pin connector and connects to the serial cable on the front facing plate of the SAAFPU. The other adapter is equipped with a USB plug to connect to a PC. These two adapters are "paired" and programmed at the factory and require no user setup. To the PC these adapters look the same as the directly connected cable. A new serial COM port will be installed the first time the SAAFPU is connected to a PC using the wireless pair. The communication range of the wireless pair is approximately 20 m. 4. Click the 'SAAFPU' choice under the 'Connection' tab, the window should appear as it is in Figure 6.5. Click the Serial Port that the SAA(s) is/are connected to. a. Click 'Next' or the ‘Search’ tab. The ‘Search’ tab can be used to automatically detect SAAs on individual COM ports. b. If it is necessary to manually add certain devices (older SAAs or piezometers for example) then the ‘Devices’ tab should be used to enter in the serial numbers of those devices. c. The ‘Test’ tab can be used to perform basic connectivity and voltage / current checks of the SAA. d. By clicking the grey and green button, 'Start with Found SAAs ' that may appear beside the 'Serial Port(s):' box, the application will launch the data collection portion of SAARecorder (GO TO Section 6.1.8) for the detected SAA(s). The ‘Start with Found SAAs’ button might not be visible for older SAAs. Note: If the SAAFPU is connected wirelessly to a PC ensure the ‘Wireless’ checkbox is checked. December 2014 85 Figure 6.5: SAARecorder ‘Connection’ window with the SAAFPU selected. 5. IF there are issues connecting to the SAAs GO TO Appendix J or Appendix K (‘Troubleshooting & Support (Help)’). 6. Otherwise GO TO Section 6.1.6 (Connection Completion). Connecting using the SAA232 Single SAAs can be connected to Measurand’s SAA232 converter (shown in Figure 6.6). The SAA232 converts the RS232 communications protocol from Measurand’s SAA232-USB cable (see Figure 6.7) to the RS485 communications protocol that the SAA uses. It also incorporates a resettable fuse and surge protection, and automatically applies power to an SAA only when there is serial RS232 data being sent from the PC to the SAA232. Note: The wireless adapters work as a pair, and each adapter will only work with its mate when using a PC. 86 December 2014 SAA Software Figure 6.6: SAA232. The 4-pin green connector connects to the RS232 port of the PC. The 5-pin green connector connects to the SAA. Figure 6.7: SAA232-USB cable. This is a USB to serial converter for use with SAA232. The red wire shown above should be connected to a +12 volt supply, and the black wire should be connected to GND of the same supply. The following steps should be taken when using the SAA232 converter with an SAA: 1. The SAA232-USB cable must be plugged into a USB port on the PC that will be running SAARecorder application. (Built-in PC serial ports can also be used to connect to an SAA232, see step 3 below with regards to wiring) 2. Connect the SAA into the green 5-pin connector on the SAA232 (Figure 6.6). The SAA wiring is as follows: Pin 1: White SAA cable (RS485 A) Pin 2: Blue SAA cable (RS485 B) Pin 3: Red SAA cable (+12 V to SAA) Pin 4: Black SAA cable (GND) Pin 5: Shield December 2014 87 Note: If an older SAA is being used, the wiring may use different colors for the RS485 A and B communications wires, please check with Measurand if the user is unsure how to connect these wires. 3. If connected using a USB port, Measurand’s SAA232-USB cable as shown in Figure 6.7 will be needed. The green 4-pin connector will connect into the four pin terminal block in the SAA232. Make sure that the USB connector is plugged into an available USB port on the PC that will be running the SAARecorder application. The red wire should be connected to a +12 V power supply. The black wire should be connected to Ground on the same power supply. 4. If connecting to the SAA232 via a serial port on the PC, connect the PC serial port to the green 4pin connector on the SAA232, using the following wiring: Pin 1: PC serial port receive (RX) Pin 2: PC serial port transmit (TX) Pin 3: +12 V Power Pin 4: GND (must be connected to both power supply and PC serial port) 5. Click the 'SAA232' choice under the 'Connection' tab, the window should appear as it is in Figure 6.8. Click the Serial Port that the SAA(s) is/are connected to. a. Click 'Next' or the ‘Search’ tab. The ‘Search’ tab can be used to automatically detect SAAs on individual COM ports. b. If it is necessary to manually add certain devices (older SAAs or piezometers for example) then the ‘Devices’ tab should be used to enter in the serial numbers of those devices. c. The ‘Test’ tab can be used to perform basic connectivity and voltage / current checks of the SAA. d. By clicking the grey and green button, 'Start with Found SAAs ' that may appear beside the 'Serial Port(s):' box, the application will launch the data collection portion of SAARecorder (GO TO Section 6.1.8) for the detected SAA(s). The ‘Start with Found SAAs’ button might not be visible for older SAAs. 88 December 2014 SAA Software Figure 6.8: SAARecorder ‘Connection’ window with the SAA232 selected. 6. IF there are issues connecting to the SAAs GO TO Appendix J or Appendix K (‘Troubleshooting & Support (Help)’). 7. Otherwise GO TO Section 6.1.6 (Connection Completion). Connecting using the SAA232-5 Figure 6.9: SAA232-5. 4-pin green connector connects to RS232 port of a PC. 5-pin green connectors connect up to five SAAs. Multiple SAAs can be connected to Measurand’s SAA232-5 converter. A picture of the SAA232-5 is shown in Figure 6.9. The SAA232-5 works in much the same way as the SAA232 (converts RS232 to RS485, provides surge protection for the SAA and applies power to a single SAA at a time) but it can accept up to five SAAs and connects them all to one serial port of the PC. The SAA232-5 is used to sample one SAA at a time through the same PC serial port. For applications where very fast readings are required, multiple SAA232 or SAAUSB devices, or the SAAR Interface (for SAAR research SAAs) should be used instead. The following steps should be taken when using the SAA232-5 converter with two or more SAAs: 1. If using a USB to RS232 converter such as Measurand’s SAA232-USB cable, make sure that it is plugged into an available USB port on the PC that will be running the SAARecorder application. 2. Plug the SAA(s) into the green 5-pin connectors on the SAA232-5. The SAA wiring is as follows: Pin 1: White wire of SAA cable (RS485 A) Pin 2: Blue wire of SAA cable (RS485 B) December 2014 89 Pin 3: Red wire of SAA cable (+12 V to SAA) Pin 4: Black wire of SAA cable (GND) Pin 5: Shield Note: If an older SAA is being used, the cable may have different colors for the RS485 A and B communications wires, please check with Measurand if the user is unsure how to connect these wires. 3. Connect the PC serial port to the green 4-pin connector on the SAA232-5, using the following wiring: Pin 1: PC serial port receive (RX) Pin 2: PC serial port transmit (TX) Pin 3: +12 V Power Pin 4: GND (must be connected to both power supply and PC serial port) 4. Click the 'SAA232-5' choice under the 'Connection' tab, the window should appear as it is in Figure 6.10. Select the channels being used. a. Click 'Next' or the ‘Search’ tab. The ‘Search’ tab can be used to automatically detect SAAs on individual COM ports and SAA232-5 channels. b. If it is necessary to manually add certain devices (older SAAs or piezometers for example) then the ‘Devices’ tab should be used to enter in the serial numbers of those devices. c. The ‘Test’ tab can be used to perform basic connectivity and voltage / current checks for the SAAs connected to the SAA232-5. d. By clicking the grey and green button, 'Start with Found SAAs ' that may appear beside the 'Serial Port(s):' box, the application will launch the data collection portion of SAARecorder (GO TO Section 6.1.8) for the detected SAA(s). The ‘Start with Found SAAs’ button might not be visible for older SAAs and SAA232-5 units. 90 December 2014 SAA Software Figure 6.10: SAARecorder ‘Connection’ window with the SAA232-5 selected. 5. IF there are issues connecting to the SAAs GO TO Appendix J or Appendix K (‘Troubleshooting & Support (Help)’). 6. Otherwise GO TO Section 6.1.6 (‘Connection Completion’). Connecting using the SAAUSB Adapter Single SAAs can be connected to Measurand’s SAAUSB adapter as shown in Figure 6.11. The SAAUSB adapter appears as a serial port when it is connected to the PC running SAARecorder. Older versions of SAAUSB are not recommended for long-term data collection, as they apply power constantly to the SAA. Any upsets to the system, such as a momentary interruption of the application of communication could lead to lock-up of one or more of the microprocessors in the SAA. Without periodic cycling of power applied to the SAA (such as when using SAA232 or SAA232-5 or a recent SAAUSB (model SAAUSB-003 or higher)), collection could eventually cease. Figure 6.11: SAAUSB adapter model SAAUSB-002. December 2014 91 Note: Measurand's SAAUSB adapter allows the user to interface to a single SAA; it appears as a RS-232 serial port on the PC. The SAAUSB is supplied with a +12 volt power supply that plugs directly into the SAAUSB. The USB plug end of the SAAUSB should be plugged into the PC before plugging in the SAA and before finally plugging in the +12 volt power supply. The following steps should be taken when using the SAAUSB with an SAA: 1. Plug the USB plug into an available USB port on the PC where SAARecorder is installed. 2. Mate the data cable from the SAA to the round connector of the SAAUSB. 3. Apply power to the SAA by plugging in the +12 VDC power supply into the power injector socket on the SAAUSB. 4. Click the 'SAAUSB' choice under the 'Connection' tab, the window should appear as it is in Figure 6.12. a. Click 'Next' or the ‘Search’ tab. The ‘Search’ tab can be used to automatically detect SAAs on individual COM ports. b. If it is necessary to manually add certain devices (older SAAs or piezometers for example) then the ‘Devices’ tab should be used to enter in the serial numbers of those devices. c. The ‘Test’ tab can be used to perform basic connectivity and voltage / current checks of the SAA. d. By clicking the grey and green button, 'Start with Found SAAs ' that may appear beside the 'Serial Port(s):' box, the application will launch the data collection portion of SAARecorder (GO TO Section 6.1.8) for the detected SAA(s). The ‘Start with Found SAAs’ button might not be visible for older SAAs. Figure 6.12: SAARecorder ‘Connection’ window with the SAAUSB selected. 5. IF there are issues connecting to the SAAs GO TO Appendix J or Appendix K (‘Troubleshooting & Support (Help)’). 92 December 2014 SAA Software 6. Otherwise GO TO Section 6.1.6 (‘Connection Completion’). Connection Completion Figure 6.13: ‘Search’ tab while connecting SAA. 1. The Search tab. SAARecorder looks for SAAs on each of the previously selected serial ports and / or SAA232-5 channels and tests communications with each microprocessor of an SAA. Each microprocessor has a unique serial number and is responsible for one “octet” (group of 8 segments). If the search is successful (see Figure 6.13) and the expected device(s) are found, click 'Next'. a. IF there are issues connecting the SAAs GO TO Appendix J or Appendix K (‘Troubleshooting & Support (Help)’). 2. Some devices are not automatically detected, the ‘Devices’ tab is where they would be added manually, the window should look similar to Figure 6.14. Figure 6.14: ‘Device Connection’ window. December 2014 93 Devices that have been previously found in the ‘Connection’ or ‘Search’ tab should appear here automatically. Some devices, such as piezometers and older SAAs, need to be added manually however. This can be done by clicking on the ‘Add Device’ link in the ‘Devices’ tab. Enter the Serial Number and COM Port. Figure 6.15: ‘Add Device’ window. Click ‘OK’. Repeat until all desired devices have been added Once all the devices have been selected click 'Next'. 3. The ‘Test’ tab runs Basic and Voltage/Current tests on the devices before starting SAARecorder application. The window should look similar to Figure 6.16. Both tests can be performed if desired. The SAARecorder interface for viewing and recording data can be started by clicking the ‘Continue’ or ‘Save and Continue’ button. Figure 6.16: ‘Device Test’ window. 4. GO TO Appendix J or Appendix K (‘Troubleshooting & Support (Help)’). Other Startup Window Options The following are other options to the ‘Start Up’ window (Figure 6.2) for SAARecorder. 94 December 2014 SAA Software 1. Open Raw Data o To open a raw data “*.rsa” file previously stored by the PC using SAARecorder. 2. Load Configuration o This option opens a previously saved configuration by the user through SAARecorder. o An ‘Open File’ window opens seeking a “[name]_[serial number].txt” file in a project folder. o Once a file is selected the ‘Hardware Connection’ window opens to allow for testing or adding devices. o See Section 6.1. 3. Just Start SAARecorder o Opens SAARecorder without going through the Connection process or opening files. o This option is available in case, either, There have been difficulties connecting the SAAs, A startup procedure identical to that of older SAARecorder versions is preferred. To view the application whether an SAA is connected or not. Once SAARecorder has started 1. SAARecorder may ask for confirmation of using 2-D or 3-D mode Figure 6.17: ‘Operational Mode’ window. ‘3D Mode’ IF the SAAs are vertical (or have all segments inclined at least 30 degrees from horizontal) then use ‘3D Mode’ so that the full 3-D shapes of the SAAs can be modeled. ‘2D Mode’ should not be used in this situation, as it depends on sensors that have less accuracy when vertical. 3-D mode also provides the full XYZ data set. ‘2D Mode’ IF the SAAs are horizontal or mostly horizontal, with all segments within 30 degrees of horizontal, then the ‘2D Mode’ option should be selected. If there are some segments near vertical and some near horizontal, then the ‘2D Mode’ + ‘some segments more than 60 degrees from horizontal’ options should be selected. December 2014 95 Note: For more complete explanation of these modes of operation, please see Section 6.4.4, ‘SAA Setup | Mode’. 2. The ‘Program’ window with the ‘Basic Settings’ window shown in Figure 6.19 will open. SAA Reference Drop-down Menu See Section 6.4.3 Averaging See Section 6.4.2 Use Averaging-in-Array (AIA) mode Checkbox See Section 6.4.2 Modeling Mode See Section 6.4.4 Figure 6.18: Application view of SAARecorder showing a single SAA in 3D mode. This view shows three orthographic views of the SAA, plus a fourth perspective view (lower-right corner). 96 December 2014 SAA Software Figure 6.19: ‘Basic Settings’ window. Note: Clicking on the lower right view and then keying “1” will change to a single 3-D rotatable view. 6.2 Saving and Exporting Raw Data (File) Figure 6.20: View of the ‘File’ drop down menu. File | Auto-save raw data file(s) December 2014 97 Note: Before saving raw data files, ensure that ‘SAA Setup | Averaging / AIA Mode’ (Section 6.4.2) and ‘SAA Setup | Sampling Rate’ (Section 6.4.7) have been set to sensible values Selecting 'File | Auto-save raw data file(s’ allows the user to automatically record raw data at selected time intervals after filling in a few settings shown in Figure 6.21. Figure 6.21: ‘Auto-Save Raw Data’ window. 1. Raw Data Recording Type Specifies whether the recordings will be saved as individual files or as one growing file where every new recording is added to the end. 2. Folder To Store Raw Data Files Where the files are to be stored It is recommended to save them under ‘C:\Measurand Inc\SAARecorder\[project_name]’, or somewhere easily found. 3. Raw Data Filename Prefix Text to be applied at the beginning of each raw data file to be created. 4. Raw Data Filename Suffix Puts a date or number stamp at the end of the raw data files to be created. 5. Record new raw data every: Specifies the time between recordings. 98 December 2014 SAA Software 6. 7. 8. 9. Remember to consider the length of time it takes to record one file, if the time between recordings is too short it will not work. The time specified is from the beginning of one recording to the beginning of the next. Stop saving raw data: Choose how to end each raw data recording (ex: apply a sample limit or time for each recording). Save Joint Positions and Data as Text Snapshot File If selected will save an additional text snapshot file per raw data recording. Save Joint Positions in Atlas Format Saves an additional text output file of position data using the “Atlas_3” file format. Stop sampling when not recording to raw data file Toggle whether or not to stop sampling altogether when not recording to a raw data file. This option should be selected for battery-powered installations. File | Quick save button When clicked a large green 'Record Data' button appears on the bottom left of the window Figure 6.22. When clicked it records one sample for all segments of each SAA and then creates a raw data file prompting for a unique file name Figure 6.23. The button remains until the menu item is un-checked. For more information on the ‘Text Snapshot File’ option available on the ‘Choose Raw Data Filename’ window, see Section 6.2.7. Figure 6.22: The green ‘Record Data’ button that appears when ‘File | Quick Save’ is selected. December 2014 99 Figure 6.23: The ‘Choose Raw Data Filename’ window that appears once recording is complete. By selecting the ‘Save Scan Report Files’ the SAAScanReport application will open (Figure 6.49), go to Section 6.2.8. File| Save raw data file Note: Before saving raw data files, ensure that ‘SAA Setup | Averaging / AIA Mode’ (Section 6.4.2) and ‘SAA Setup | Sampling Rate’ (Section 6.4.7) have been set to sensible values. The 'Save Raw Data File' menu item (or pressing the Spacebar) is similar to the ‘Quick Save’ button except that 1) there is no green button and 2) it allows the user to record as many samples as desired. The ‘Save Raw Data File’ records SAA data to a "raw shape array" (“.rsa”) file on the PC. The following ‘Recording’ window shown in Figure 6.24 will appear. Selecting the 'File | Save Raw Data File' menu item saves the raw data as soon as the recording is manually stopped: Hitting the ‘Stop’ button or Closing the ‘Recording’ window or Selecting the ‘File | Close Raw Data File’ menu item, see Figure 6.23. The raw data that is saved can be exported to text or can be exported to Measurand’s SAAView application. 100 December 2014 SAA Software Figure 6.24: ‘Playback / Recording’ window for recording raw shape array (.rsa) data. File| Open raw data file A "raw shape array" (.rsa) file can be played back in SAARecorder by selecting the 'File | Open Raw Data File' item from the ‘Main’ menu. This brings up the window shown in Figure 6.25. Figure 6.25: ‘Playback / Recording’ window for playback of raw data files. Controls within this window allow one to move backwards or forwards through the file and control the playback speed. If playing back a very large raw data file, it is possible to save a subset of that file to a smaller raw data file. This can be done by clicking on the ‘File | Save Subset’ menu item of the ‘Playback’ window see Figure 6.25. This brings up a window similar to that shown in Figure 6.26 that allows for specifying the range of samples to copy over to the new raw data file. December 2014 101 Figure 6.26: ‘Save Subset of Raw Data File’ window. File| Close raw data file The recording can be stopped by: Closing the ‘Playback / Recording’ window o The ‘X’ at the top right corner of the window. clicking the ‘Stop’ button in the above window o The button with the black square in the center of the window. Or selecting 'File | Close Raw Data File' from the ‘Main’ menu. Once the recording has been stopped, a dialog appears prompting to select a filename for the recorded data, similar to Figure 6.23. File | Export raw data to Exports raw data to: 6.2.6.1 SAAView Raw data recorded in SAARecorder as “.rsa” files can be converted to a “multi_saa_allcart.mat” file that can be opened in Measurand’s SAAView application (Section 7). SAAView has many graphical interfaces and options available for viewing SAA data over a long period of time. In order to convert one or more “.rsa” files to a “multi_saa_allcart.mat” file that can be opened in SAAView: 1. 2. 3. 4. 102 Select the ‘File | Export raw data to SAAView’ menu item. A ‘Select Files’ window opens allowing the user to select one or more files at a time. Once the files have been selected, click ’Select’. The ‘Time vs. Samples’ window will open, see Figure 6.27. December 2014 SAA Software Figure 6.27: ‘Time vs. Samples’ graph for exporting to SAAView. File Averages o Data arrives from files, concatenated together. o Performs discrete averages, one per file (Output = 1 sample per file). Step Averages o Data arrives in groups (steps) with pauses in between. o Performs discrete averages, one per “step” (Number of samples will be reduced). Discrete Average(s) of: o Set number of samples to average in each discrete average. o Number of samples will be reduced. Running Averages of: o Set number of samples to average as a running average. o Number of samples will not change. No Averaging o Leave raw data unchanged. 5. Once the desired options are made, click ‘OK’. 6. After processing all the samples and files the window seen in Figure 6.28 will be available. Figure 6.28: ‘SAA Conversion Parameters’ window. 7. Select the options that suit the SAA raw data files selected and choose a “Site” file if required. December 2014 103 Sernum o The Serial Number of the SAA. Vertical o Is the SAA vertical? Ref=Far o Is the reference end the far end? Az. Deg o The offset of Azimuth in degrees. NumSeg o The number of Segments in this SAA. StartSeg o The segment to start with. o This allows for skipping starting segments. EndSeg o The segment to end with. o This allows for skipping end segments. SlavedSegs o A comma separated list of slaved segments. Site File o This file is only required for: SuperSets of SAAs Convergence SAAs Non-SAA sensors 8. Click ‘OK’. 9. SAACR_raw2data will be run for the conversion, once complete a window will pop-up with the location of the new files for SAAView. ‘C:\Measurand Inc\SAARecorder\Data\multi_saa_allcart.mat” 6.2.6.2 A text file The converted text files can contain comma-separated position, bend angles, acceleration data, and temperatures. Files in this format can be opened by spreadsheet software. 1. Select the ‘File | Export raw data to text’ menu item. 2. A ‘Choose a raw data file to export to text’ window will open, select the file or files and click ‘Open’. 3. The ‘Export to Text Data‘ window will open, see Figure 6.29. 104 December 2014 SAA Software Figure 6.29: ‘Export to Text Data’ window. 4. Select the options that suit the SAA raw data files selected. Export data for all SAAs o Check this check-box to export all available SAAs in the ‘Available SAAs’ list. Available SAAs o A list of all available SAAs for this export. o This list is dictated by the files selected in the ‘File Selection’ window. Selected SAAs o All the SAAs selected. Add to Selected Button o Highlight one or more SAAs in the ‘Available SAAs’ list then click this button to move them to the ‘Selected SAAs’ list. Remove from Selected Button o Highlight one or more SAAs in the ‘Selected SAAs’ list then click this button to remove them from the list. Export all data samples o Check this check-box to export all the data. Export Sample From: o Ensure the ‘Export All Data Samples’ check-box is un-checked. December 2014 105 o Enter the start and end times to export. o There will be one start and end time for each SAA. View Text Output in Text Editor o Checking this check-box will open a text editor when the conversion is complete. o This option will only work if there is a text editor associated with “.txt” files. Select Data to Export Button o Clicking this button opens the window in Figure 6.30. o Each SAA in the ‘Selected SAAs’ list will be represented as a tab. o Select data to be included in the export for EACH SAA: SAA Joints to Export o Type a hyphenated range of joint numbers OR o Type comma-separated joint numbers OR o Type ‘All’ for all joints. Acc. X, Acc. Y, Acc. Z o Acceleration at X, Y, and/or Z. Pos. X, Pos. Y, Pos. Z o Position of X, Y and/or Z. Rot. X, Rot. Y o Rotation angles around X and/or Y. Absolute Tilt Temperature Time (sec) o Click ‘OK’ when selections for ALL SAAs have been made. Start Conversion Button o Start conversion of raw data to text. Figure 6.30: ‘Select Data to Export to Text’ window. 106 December 2014 SAA Software 5. A ‘Choose a text filename for SAA SAAF_[serial number]_[number of segments]’ window opens to allow the user to select a location and name for the newly created “Text” file. 6. Once a name and location for the “Text” file have been selected and the ‘OK’ button clicked, the window in Figure 6.31 opens. 7. ‘Sampling and Output Options’ window is to select how the data should be sampled for the output “Text” file. Leave Sampling Unchanged Resample at xx Hz One Averaged Sample per Data Collection Interval 8. Click ‘OK’. 9. Once the conversion is complete a window will pop-up with the location of the new “Text” file. ‘C:\Measurand Inc\SAARecorder\Data\**.txt” Figure 6.31: ‘Sampling and Output Options’ window. Figure 6.32: A view of the created text file in Notepad. December 2014 107 6.2.6.3 An Atlas file Raw data recorded in SAARecorder as “.rsa” files can be converted to a “Text” file of joint position data in the Atlas_3 format. 1. Select the ‘File | Export raw data to Atlas’ menu item. 2. A ‘Choose a raw data file to export to Atlas’ window will open, select the file or files and click ‘Open’. 3. The ‘Time vs. Samples’ window will open, see Figure 6.27. 4. Once the desired options are made, click ‘OK’, see Section 6.2.6.1 for details. 5. The window in Figure 6.33 opens. Atlas_1 places X, Y, and Z axis data in separate “Text” files. Atlas_3 combines X, Y, and Z axis data into a single file. Figure 6.33: ‘Choose Atlas File Format’ window. 6. Click ‘OK’, and select a destination for the created “Atlas” file. 7. Once the conversion is complete a window will pop-up with the location of the new “Text” file. For Atlas_3 o ‘C:\Measurand Inc\SAARecorder\Data\SAAF_[Serial Number]_[# of Segments]_XYZ.txt” For Atlas_1 o ‘C:\Measurand Inc\SAARecorder\Data\SAAF_[Serial Number]_[# of Segments]_X.txt” o ‘C:\Measurand Inc\SAARecorder\Data\SAAF_[Serial Number]_[# of Segments]_Y.txt” o ‘C:\Measurand Inc\SAARecorder\Data\SAAF_[Serial Number]_[# of Segments]_Z.txt” 6.2.6.4 Grout Anchor Data This function is used for dragging SAAs through inclined grout anchor holes (typically inclined between 30 and 70 degrees from horizontal). For example, a hole could be 50 m long, but an SAA could be 10 m long, so it could be dragged through in 6 poses (allowing some overlap between poses). Each raw data file is input in the interface, along with the distance that the SAA is pulled, and then the application presents graphs showing lateral deviation and inclination changes. 108 December 2014 SAA Software 1. Select the ‘File | Export Grout Anchor Data’ menu item. 2. The window in Figure 6.34 will open: Figure 6.34: ‘Export Grout Anchor Data’ window. Distance of Hole to Measure: o The total distance the SAA will travel. Raw Data Filename Pose #1, #2…#n o The raw data file pose, in order. Move Dist Pose #1, #2, … #n o The distance that pose moved. o If the SAA was moved towards the near (cable) end then the number is negative. o If the SAA was moved towards the far end then the number here is positive. Add Raw Data File o Add another line for a raw data file. 3. Click ‘OK’. 4. A ‘Save the Source File with a Distinctive Name’ window will open allowing the user to name the file with a distinctive name. Click ‘Save’. 5. The Anchor View application will open, see Figure 6.35. December 2014 109 Figure 6.35: ‘Anchor View’ application opened while saving Anchor Grout Data. 110 File | Re-Save Source File o This allows the user to save changes, add notes and titles to the current file. File | Export Header/Notes/Data o Creates a text file, e.g. “accSummary_01-3600_xyz.txt”, with header information, Notes and Data. o User is prompted to select location and change the default file name. File | Save Figure Image o Creates an image file, e.g. “accSummary_01-3600_xyz.png”, of the window view. o User is prompted to select location and change the default file name. View | View Details / Notes o Opens a window view of the file header containing SAA details. o See Figure 6.36. December 2014 SAA Software Figure 6.36: ‘Joint File Header + Notes’ window. View | Edit Notes o Allows the user to makes notes that are added to the Header and details. View | Edit Attribution o Allows the user to add a title to the window. o See Figure 6.37. Figure 6.37: ‘User Attribution’ window. Settings | ZOOM +/o Allows scaling for views. Settings | Manual Scaling December 2014 111 o o Allows the user to change various aspects of the display. See Figure 6.38. Figure 6.38: ‘Set Manual Scaling’ window. Settings | Auto Scaling o When checked all scaling is done by default. Settings | Polyfit Order o See Figure 6.39. Figure 6.39: ‘Set Polyfit Order’ window. 112 Settings | Design Angle o See Figure 6.40. December 2014 SAA Software Figure 6.40: ‘Set Angle of Design Path’ window. Settings | Line Color/Visible o See Figure 6.41. Figure 6.41: ‘Set Line Colors’ window. Advanced | Set Additional Normalization o Enables additional normalization of selected poses by a selected pose. o This should ONLY be used if some of the poses are self-consistent in pattern of roll angles in the ‘normalization’ graphs which appear when this option is selected. o “Additional” means in addition to the near-most pose being used to “calibrate” or “normalize” all the poses, which is always done automatically. o Pose number (1 is FAR), roll angle (0 means X is up), and Standard Deviation of roll angles along Pose (STD) are shown as an aid to judging pattern. o CAUTION! Additional Normalization can remove real curvature, thereby underreporting the deformation. o If no patterns are seen, do not use this feature. o To remove this feature, uncheck all Poses. o See Figure 6.42. December 2014 113 Figure 6.42: ‘Select Additional Normalization’ window. 114 Advanced | Legacy Mean Normalization o When checked, enables a normalization of roll of all non-NEAR poses by the mean of the rolls along all non-NEAR poses. Advanced | Additional Filtering o When checked, filters accelerations in individual poses before they are combined. X – Z Graph o Inward (x), m vs Elevation (z), m Y – Z Graph o Lateral (y), m vs Elevation (z), m X – Y Graph o Inward (x), m vs Lateral (y), m Y – VertDeviation Graph o Lateral (y), m vs Vertical Deviation, m ZOOM +/- Button o Same as ‘File | ZOOM +/-‘. (X-Z)/(S-Z) Button o Dimension S is co-linear with the starting center-line of the anchor. o Use the ‘(X-Z)/(S-Z)’ button to change relevant views from/to “along the anchor”. December 2014 SAA Software o o Before clicking the ‘(X-Z)/(S-Z)’ button, see Figure 6.35. After clicking the ‘(X-Z)/(S-Z)’ button, see Figure 6.43. Figure 6.43: The display view after clicking the ‘(X-Z)/(S-Z)’ button. File | Save text snapshot of SAA data At any time when viewing live SAA data, or when playing back a recorded raw data file, the Cartesian XYZ locations for all of an SAA's joints can also be captured by clicking on the 'File | Save text snapshot of SAA data' menu item. This brings up a window asking for a “Text” file name to be selected, and then brings up the ‘Choose Position Format’ window shown in Figure 6.45. Select the 'File | Save text snapshot of SAA data' menu item. The window in Figure 6.44 will appear requesting the user to select which data to save a snapshot of. Current Live Data o Save a snapshot of the current data that is running in SAARecorder. Select Raw Data Files o Save a snapshot of raw data that has been previously saved. o Selecting this will open a ‘Choose File’ window for the user to select the raw data file. December 2014 115 Figure 6.44: Choose between live data and saved raw data. After selecting which data to save, the window in Figure 6.45 will open. Select Data to Save Button o Choose which columns are to appear in the output text data file. o See Figure 6.30. Base Reference Text File o This is Optional, used for tracking relative displacements instead of actual displacements. o Leave blank if no reference “Text” file is used. View Created Text File o View output text data in a text editor once ‘OK’ is clicked. Relative to “Straight” o Modifies all output XYZ data to be relative to a “straight”, unbent condition of the SAA. Create Graphical Report o View a graphical report of the output Cartesian data. Create Scan Report (.DOC and .PDF file formats) o Once ‘OK’ is clicked the SAAScanReport application opens, see Section 6.2.9. Figure 6.45: Options for saving text snapshot files. It is possible to specify a base reference file, in order to view displacement data relative to this reference file. 116 December 2014 SAA Software Once all choices are made and ‘OK’ is clicked, The ‘XYZ Summary’ Graph window will open see Figure 6.46. A window displaying the saved file location. o ‘C:\Measurand Inc\SAArecorder\Data\SAAF_[serial number].txt’ A text editor showing the “Text” file Header if ‘View Created Text File’ was selected. Figure 6.46: The ‘XYZ Summary’ window. Make Selections and close the window when complete. XZ Graph Options o Change graph limits and other graph settings for the XZ data graph. o See Figure 6.47. YZ Graph Options o Change graph limits and other graph settings for the YZ data graph. o See Figure 6.47. December 2014 117 Figure 6.47: ‘Graph Options’ for either XZ or YZ graph. Save Polyfit Data o Save polynomial fit data to a “Text” file. Capture Window o Save a screen capture of this window to a “bitmap” (“.bmp”) or “portable network graphic” (“.png”) file. Print Window Send a screen capture of this window to a local printer. File | Generate Scan Reports from Current Data If an SAA is being used for a scanning application (i.e. to measure the shape of a borehole) it is possible to generate report documents in Microsoft Word (DOC format) and Adobe Acrobat (PDF format). This functionality can be accessed through: File | Quick Save Button File | Save Raw Data File File | Save Text Snapshot of SAA Data File | Generate Scan Reports from Current Data File | Generate Scan Reports from Text Snapshots Selecting this option allows for the creation of a “Scan Report” from current data using the SAAScanReport application. This menu item requires that SAARecorder be either: i. ii. 118 Collecting data form one or more SAAs. Playing back a raw data (“.rsa”) file containing data from one or more SAAs. December 2014 SAA Software Once selected a window gives the user the option to create a filename prefix and a save location, see Figure 6.48. Figure 6.48: Scan Report Output window. As shown in Figure 6.49 the user may enter in text and / or an image to appear in the header of the report, as well as an image in the footer of the report. Limits can be specified as either fixed deviation limits (in mm) or percentage deviation limits (deviation expressed as a percentage value of the distance along the SAA) or angular deviation limits (deviation expressed as an angular separation from the desired borehole direction). The desired borehole direction can be expressed as either “Deviation Relative to Vertical / Horizontal” or “Deviation Relative to Line”. For boreholes which are nominally vertical or horizontal, the “Deviation Relative to Vertical / Horizontal” option should be selected. Otherwise, the “Deviation Relative to Line” option should be selected and point values in mm should be entered for the starting point and ending point of the hole, see Figure 6.49. Figure 6.49: SAAScanReport application. December 2014 119 Figure 6.49 is an example of settings used for generating a report for a non-vertical (and nonhorizontal) borehole. In this example the start point of the borehole is set to 0, 0, 0 and the end point is set to 12000,0,12000 mm. So the borehole is at a 45 ° angle from vertical in the XZ plane. After the deviation settings and the header / footer settings have been selected, the ‘Generate Report(s)’ button can be clicked to generate the “.doc” and “.pdf” report files. SAA Serial Number: Borehole Deviation (bottom): Borehole Deviation (top): 56369 0.0 mm 532.1 mm Maximum permissible hole deviation: 1000.0 mm Within the allowable deviation (yes / no): yes Figure 6.50: First page of Scan Report showing plain view of SAA Shape with fixed deviation limit circle. 120 December 2014 SAA Software Figure 6.51: Second page of Scan Report showing section view of SAA shape (in XZ and YZ sections) with fixed deviation limits. File | Generate Scan Reports from Text Snapshot(s) This menu option requires the availability of one or more text snapshot files to convert into report documents of the scanned shape. Selecting this option opens the window in Figure 6.49, see previous section for instructions. Once the ‘Generate Report(s)’ button is clicked, the ‘Open Existing “Text Snapshot” file(s)’ window will open December 2014 121 prompting the user to select “.txt” files previously created using the ‘File | Save Text Snapshot of SAA Data’ menu option. File | Concatenate horizontal pose data Selecting this option uses the same sort of interface as 'Export grout anchor data' (see Figure 6.34), except that it is used for pulling a short SAA through a long horizontal hole. An “.rsa” raw data file is entered for each pose, and then "stitched" together by the application to determine the total shape of the horizontal hole (i.e. the 2-D elevation profile along its length). The view and options are similar though less than Section 6.2.6.4. The graphical view only shows the raw data and overlap. For more information on available options see Section 6.2.6.4. Figure 6.52: ‘Concatenate Horizontal Pose Data’ window. Grouping Multiple Raw Data (or Text) Files Together If there is a number of raw data files (or a number of “Text” files) that have been separately created for an SAA or group of SAAs, they can be concatenated together using the “SAA_Concat.exe” utility which is included in the installation folder of SAARecorder. Simply run the “SAA_Concat.exe” utility to bring up a window similar to that shown in Figure 6.53. If “Text” files are being concatenated, an optional XYZ “Base Reference” file (created using the ‘File | Save text snapshot of SAA data’ menu item) can be specified. Specifying a “Base Reference” file makes all of the position measurements in the concatenated output relative to the base reference positions. 1. Click ‘C:\Measurand Inc\SAARecorder\SAA_Concat.exe’. 122 December 2014 SAA Software 2. 3. 4. 5. Browse for all files to be concatenated. Add a “Base Reference” File if desired. Click ‘OK’. A window will open giving the location of the newly created “Text” file. Figure 6.53: SAA_Concat.exe utility is used for concatenating multiple raw data files (or multiple “Text” files) together into one big long file. In the window above, five raw data files have been selected for concatenation. 6.3 Communications Figure 6.54: View of the ‘Communications’ drop down menu. Communications | Baud Rate This menu option is available for all SAAs with serial numbers 40000 and higher. It allows the user to set the communications baud rate to either 38400, 57600, 115200, or 230400 bps. Information specifying how the baud rate influences the maximum data rate attainable can be found in Appendix D. Unless there is a particular need, the lowest rate should be used. December 2014 123 Figure 6.55: ‘Select Baud Rate’ window. Communications | Check available COM ports This function gives a list of all the COM ports available and is only available when there are more than the current in use COM port. Figure 6.56: List of available COM Ports. Communications | Search for serial SAAs This menu option is available if SAARecorder is open but not connected to any SAAs. Choosing this menu item will start the connection process for SAAs. The following windows will open: 1. ‘Operational Mode’ window where 2-D or 3-D view is chosen. Figure 6.57: ‘Operational Mode’ window where 2-D or 3-D view is chosen. 124 December 2014 SAA Software No SAA is connected: 2. ‘ShapeAccelArray Startup’ window where a file, configuration or a connection needs to be chosen. Figure 6.58: ShapeAccelArray ‘Startup’ window where a file, configuration or a connections needs to be chosen. Using Serial-to-Ethernet Device Checkbox o Make sure that the ‘Using Serial-to-Ethernet Device’ option is checked if using a serial to Ethernet (or Wireless Ethernet) converter, such as Lantronix, WiBox or an RF4XX wireless serial modem. o If this option is checked, an additional ‘Timeout’ field appears to the right of the checkbox allowing the user to enter a value for the added communications delay. The default value of 500 ms will work for most wireless installations. Use Last SAA Configuration Button o If the same SAAs are about to be used in the current SAARecorder session that were used in the previous SAARecorder session, then the ‘Use Last SAA Configuration’ button can be used to start collection data from those same SAAs. Using SAA232-5 Device(s) Checkbox o The ‘Using SAA232-5 Device(s)’ checkbox should be checked if the SAA(s) are connected to one or more SAA232-5 devices. Network SAAs | Use Network SAAs Button o The ‘Use Network SAAs’ button should only be clicked if an older SAA system is being used with an Ethernet data concentrator. Instructions are found in Appendix A for connecting this type of hardware. Test | Voltage / Current Check Button o Clicking this button brings up a window prompting the user to select a serial COM port for communications with the SAA and an SAA232-5 channel, if an SAA232-5 is in use. A window then appears displaying voltage, current, and temperature data from the top segment of the SAA. This window is described in Section 6.7.1.1. Open Raw Data File Button December 2014 125 o This button opens a previously “Recorded Raw Data” (.rsa) file for viewing in SAARecorder. Serial Port SAAs | Use Serial SAAs Button o This button is used to connect to one or more SAAs through a serial communication link. o After clicking this button the steps listed below should be followed to select the correct serial (COM) port and select which SAA serial numbers should be used. An SAA is connected: 2. ‘Choose Serial Port’ window where a serial port must be chosen to connect to. Figure 6.59: ‘Choose Serial Port’ window where a serial port must be chosen to connect to. 3. ‘SAA Serial Numbers to Search’ window where only the serial numbers of the SAAs to be recorded are listed. An ‘Add / Remove’ button is available. Figure 6.60: ‘SAA Serial Numbers to Search’ window. 126 December 2014 SAA Software 4. ‘SAA Startup’ window opens (see Figure 6.58) just as it processes and then closes to open the ‘Basic Settings’ window (see Figure 6.19). This window is where averaging is turned off or on and the referencing point is chosen. See Section 6.4.1. An SAA is connected but Serial Numbers are NOT Responsive: 2. A ‘Troubleshooting’ window opens, see Figure 6.61. Figure 6.61: ‘Troubleshooting’ window. All troubleshooting questions in the ‘Troubleshooting’ window have a ‘more…’ link that opens a window giving more information on how to answer the questions. Try Finding SAA(s) Again o Opens the window in Figure 6.60. Start With Found SAAs o Opens the window in Figure 6.58. Communications | Serial port connections This function opens a window listing the SAA names and the COM port(s) they are associated with. See Figure 6.62. December 2014 127 Figure 6.62: ‘SAA Serial Ports’ window. Communications | Advanced | Network | Network connections This function lists the IP addresses associated with the PC, there is an ‘Add / Remove’ button as well. It is only for use with a Network Data Concentrator (see Appendix C). Figure 6.63: ‘Network Connections’ window. Communications | Advanced | Network | Search for network SAAs This function is used for finding SAA(s) connected to a Network Data Concentrator. See Appendix C for details. 128 December 2014 SAA Software 6.4 SAA Setup Figure 6.64: View of the’ SAA Setup’ drop down menu. SAA Setup | View Basic Settings This menu item opens the ‘Basic Settings’ window (see Figure 6.19). The ‘Basic Settings’ window allows the user to view and change the reference point for the SAA (near or far), the amount of averaging to perform, whether or not to use the “Averaging-in-Array” (AIA) mode, and the modeling mode (2-D or 3-D). It also displays an indication of how much sleep time is left, if the SAA(s) are currently in sleep mode (see Section 6.4.7 ‘SAA Setup | Sampling Rate’) and not collecting data. SAA Reference Drop-down Menu o See Section 6.4.3 for more information. Averaging o See Section 6.4.2 for more information. Use Averaging-in-Array (AIA) mode Checkbox o See Section 6.4.2 for more information. Modeling Mode o See Section 6.4.4 for more information. SAA Setup | Averaging / AIA Mode This option allows the user to modify how many samples of raw data are averaged on an ongoing basis. If the ‘Averaging mode’ option check box is not available (older SAAs with serial numbers less than 47100) or is not checked then the averaging value can be set to anywhere between 1 (i.e. no averaging) and 1000 (i.e. average the last 1000 samples for computing displayed shape, position, and acceleration data). December 2014 129 Note: Averaging-in-Array (AIA) Mode should be used if static data are to be collected. AIA Mode can collect and average many more samples in the same time. Figure 6.65: ‘Averaging’ window. If the ‘Averaging Mode’ option check box is available, then it should be checked if collecting static shape data. In AIA mode, samples are collected within the SAA at a rate of 400 samples per second, and output from the SAA once the requested averaging level has been reached. For example, if the AIA averaging level were set to 1000, then averaged results would be sent from the SAA after a period of about 3.5 seconds. (2.5 seconds of collection at 400 s/s, plus some overhead) When using AIA mode, the averaging level can be set to as low as 100 samples, or as high as 25500 samples. SAA Setup | Reference Allows the user to select which end of the SAA (near (cable) end or far (tip) end) to use as the reference end or starting point for SAA calculations. Figure 6.66: Changing the SAA reference in the ‘SAASetup’ menu. 130 December 2014 SAA Software SAA Setup | Mode Calculations for the SAA(s) can be made in one of three possible modes: (i) Near Horizontal (2D), (ii) Mixed (Convergence), and (iii) Near Vertical (3D). Figure 6.67: Changing the Mode of SAARecorder in the ‘SAASetup’ menu. Near horizontal (2D) mode o Appropriate when no segments of the SAA are inclined more than 60 degrees relative to the horizontal. o It assumes that the SAA is moving in the vertical plane only; i.e. it does not model any lateral or horizontal bending of the SAA. Mixed (convergence) mode o Appropriate when some SAA segments are inclined less than 30 degrees from horizontal and some SAA segments are inclined more than 60 degrees from horizontal. o It also assumes that the SAA is moving in the vertical plane only; i.e. with no lateral or horizontal bending of any SAA segments. o This mode is normally used for SAAs that are being used to monitor circular shapes, such as the circumference of a tunnel. Near vertical (3D) mode o The SAA is assumed to be bending about the two horizontal (X and Y) axes. o The near vertical mode can generally be used if all segments of the SAA are greater than 30 degrees relative to the horizontal. SAA Setup | Site Properties This menu item allows the user to specify the base position, azimuth angle, and an optional site location name for each SAA. December 2014 131 Figure 6.68: ‘Site Properties’ window. 132 X, Y, Z Positions o Determine a base or start position of the SAA, use those coordinates here. Azimuth Angle o See Appendix I (‘Finding Azimuth’) OR o Click the ‘Determine Azimuth’ button. Determine Azimuth Button o Clicking this button opens the ‘SAA Azimuth Determination’ window. o Use this window to determine the base azimuth for the site properties. o This is the preferred method of determining azimuth if there are no visible X-marks located near the top of the borehole bring measured. Location Name o Give the location of this SAA a name. December 2014 SAA Software Figure 6.69: ‘Azimuth Determination’ window. SAA Azimuth Determination window o Side and Top View The red segment is the segment chosen. o SAA segment to use for determining azimuth: Choose which segment to reference for base azimuth. o Enter an angle of SAA going into hole: The angle relative to north of the SAA reference segment. Requires sighting of this segment towards the near (cable) end of the SAA. o Acc. X of Segment #n: The x-axis acceleration of the segment used for determining SAA azimuth. Un-editable. o Acc. Y of Segment #n: The y-axis acceleration of the segment used for determining SAA azimuth. Un-editable. o SAA Azimuth: The currently calculated azimuth of the SAA. I.e. the direction relative to north in which the X-mark of the SAA is pointing. Un-editable. SAA Setup | Units This menu function allows the user to specify whether inches, millimeters, or meters will be used in the numeric display and file outputs. December 2014 133 Figure 6.70: ‘Choose Units’ window. SAA Setup | Sampling Rate This menu option allows the user to select a data sampling interval or frequency for all connected SAAs. The data sampling rate is controlled through SAARecorder application, and as such the instantaneous sampling rate may vary slightly, although the average sampling rate should be exact. For more precise timing, a hardware-based clock can be used to trigger data (see Section 6.4.15 ‘SAA Setup | Advanced | Hardware Triggering’) Also, it is possible to have SAARecorder “go to sleep” periodically (with no data collection) for a specified length of time, before collecting data for a specified length of time. Figure 6.71: ‘Enter New Sampling Frequency’ window used for setting the sampling frequency for all connected SAAs. 134 Sample as quickly as possible o SAA data will be sampled as quickly as possible o When SAARecorder is NOT in Sleep Mode. Sample at selected data rate o Sample at the data rate specified below. o When SAARecorder is NOT in Sleep Mode. Sample at constant rate Go to sleep Periodically December 2014 SAA Software o Awake interval Length of time from the end of one sleep interval to the beginning of the next sleep interval. Can also be thought of as the ‘Awake’ or ‘Sampling’ time. o Sleep Interval Length of time that SAAs are asleep before data collection begins. Frequent Sampling o Use this option for specifying frequencies >= 1Hz. o Sampling Frequency Data sampling frequency (in Hz) for acquiring SAA data. Infrequent Sampling o Use this option for specifying frequencies < 1 Hz. o Sample Every: Number of hours between samples. For example, if the ‘Sampling Frequency’ is 10 Hz and an average 100 samples per 60 second interval is selected, then make sure that ‘Go to sleep periodically’ (not ‘Sample at constant rate’) is set. The averaging value should be set to 100 (see Section 6.4.2 ‘SAA Setup | Averaging / AIA Mode’), the ‘Awake Interval’ should be at least 10 sec to allow for enough samples to be averaged per interval, and the ‘Sleep Interval’ should be 60 minus the value of the ‘Sample Every’ parameter. SAA Setup | Displacement and Tilt Alarms This option allows the user to set alarms that are activated whenever the horizontal displacement of any part of a vertical SAA (or the vertical displacement of any part of a horizontal SAA) exceeds some user-defined limit, or whenever any of the SAA's accelerometers exceed some pre-defined limits. Select the ‘SAA Setup | Displacement and Tilt Alarms’ menu item. The window will open requesting to select an individual SAA or all: Figure 6.72: Choose one or all available SAAs. After selection, click ‘OK’. The window in Figure 6.74 will open. o Displacement Alarms o Triggers an alarm if the displacement of an SAA goes beyond the specified value. o The values are in mm from either ‘Straight’ or ‘Base Reference’. December 2014 135 o o If ‘Base Reference’ is chosen, then a valid XYZ Cartesian “Text” file as the base reference for the SAA must be selected. o The XYZ Cartesian test file can be created from the ‘Set Displacement and Tilt Alarms’ dialog by clicking the ‘Save New Base Reference’ button, or it could have been previously created by selecting the ‘File | Save text snapshot of SAA data’ (Section 6.2.7) menu item. Tilt Alarms o Trigger an alarm if the acceleration of one or more of the SAA sensors goes beyond the specified range of values. o Values can be set for Upper and Lower X, Y, or Z Accelerations. Notifications o A sound can be played if an alarm occurs. o An email can be sent. Click ‘Email Settings’ to set this feature up. Figure 6.73: ‘Email Settings’ for Displacement and Tilt Alarms. o 136 Joint Range for Alarms o Specify a joint range for the SAA over which the above alarm settings apply. December 2014 SAA Software Figure 6.74: ‘Set Displacement and Tilt Alarms’ window with parameters for controlling whether or not to use displacement and / or tilt alarms, and what the limits for those alarms should be. 6.4.8.1 Displacement Alarms If displacement alarms are being used and a single scalar displacement is specified for the limit, a yellow ring appears around the portion of each SAA where the maximum deflection is occurring. The radius of the ring corresponds to the scalar value entered in the ‘Set Displacement and Tilt Alarms’ dialog (ex: “50.0” in Figure 6.75). If any portion of an SAA goes beyond the prescribed radius limit, the color of the ring changes from yellow to red, and warning text appears on the window. December 2014 137 Figure 6.75: SAARecorder indicating a displacement alarm condition. In this case, the endpoints of all three SAAs have moved beyond the alarm radius limit. If SAA displacement along a particular axis is more of a concern, a vector value for the displacement limit instead of a magnitude limit can be specified. 6.4.8.2 Vector Alarms Vectors are entered as 2 or 3 comma-separated values. If 2 values are used, it is assumed that these correspond to the maximum displacements along the X and Y axes. If 3 values are used it is assumed that these correspond to the maximum displacements along the X, Y, and Z axes. Setting to zero any vector component for the maximum displacement indicates that no displacement alarm exists in that direction. For example, if the displacement limit is specified as 15, 0, 0 mm then an alarm would occur if the SAA moved more than 15 mm from vertical (or from its reference shape) in the X-axis direction. 6.4.8.3 Tilt Alarms If tilt alarms are being used, the SAA segment that exceeds the alarm limits the most is colored red (for example see Figure 6.76). If the SAA is colored red anyway, then the segment that exceeds the alarm limits the most is colored yellow instead. 138 December 2014 SAA Software Figure 6.76: Screen shot showing how SAARecorder indicates a tilt alarm condition. If monitoring alarms for certain segments of an SAA is desired, the user can specify which segments to use by entering a valid ‘Joint Range for Alarms’ in the field at the bottom of the ‘Set Displacement and Tilt Alarms’ dialog. Joint 0 is assumed to be at the reference end of the SAA. To monitor all joints, enter ‘All’ in the field. SAA Setup | Piezometer Options This option is available when using one or more of Measurand’s SAAPZ piezometer sensors. It displays the window shown in Figure 6.77. The ‘Piezo Output’ window can be specified to be in kPa (kilopascals), Digits, or as the measured frequency of the piezometer sensor(s). Also, there is an option to choose how the pressure in kPa is to be calculated. The default method uses the polynomial calibration coefficients for the device, but the linear calibration coefficients can be used instead by modifying the settings in the ‘Piezometer Calculation Mode’ control. December 2014 139 Figure 6.77: ‘Piezo output’ window for controlling the output from Measurand’s piezometer sensors. SAA Setup | Advanced | Constrain SAA Endpoint This option allows the user to specify the height (Z-axis position) of the endpoint of the SAA in a window similar to that shown in Figure 6.78. It is only available when the SAAs are being operated in Near Horizontal (2-D) Mode, see Section 6.4.4 (‘SAA Setup | Mode’), When the user elects to constrain both ends of an SAA in 2-D mode, angular corrections are applied to each of the SAA’s joints. The amount of angular correction applied is the same for each joint, and is determined using numerical methods in application to ensure that the endpoint height matches the value specified by the user. Figure 6.78: ‘Constrain Endpoint Position of SAA’ window used for specifying the endpoint height of an SAA in 2-D mode. Useful for situations in which both ends of the SAA are constrained. SAA Setup | Advanced | Turn on / off section of SAA This option should be selected if there are one or more segments of an SAA near either end that is not being used. 140 December 2014 SAA Software For example, if a hole was only 65 feet deep but the SAA was 80 feet long (80 one foot segments), then it would make sense to turn off the last two octets (i.e. the last 16 feet) using this option (Figure 6.79). Figure 6.79: Window for selecting which SAA segments to turn on or off. SAA Setup | Advanced | Straighten section of SAA This menu option should be used if there are one or more segments of the SAA that have become damaged in some way, and it is necessary to still get data from the rest of the SAA. Checking this option for an SAA segment makes that segment “straight”. This means it will have the same tilt as the adjoining segment closer to the reference side of the SAA (Figure 6.80). Figure 6.80: ‘Straighten SAA Selections’ window for selecting which SAA segments to make “straight”. SAA Setup | Advanced | Enable / Disable magnetometer twist correction When ‘Magnetometer Twist Correct’ is enabled for any two magnetometers in an SAA, any difference in axial rotation (rotation about the long axis of the SAA) between those two magnetometers is assumed to vary linearly. The linear twist profile between the two magnetometers is used to apply "twist corrections" to the accelerometer data between the two magnetometers. If there are accelerometers situated between one end of an SAA and an enabled magnetometer, any linear twist variation modeled by enabled magnetometers within the SAA is assumed to vary linearly beyond the outermost magnetometers. So in effect the linear twist profile is extrapolated to the accelerometers in the outermost segments. December 2014 141 Twist corrections can be disabled for an entire SAA by disabling the magnetometer twist correction for each available magnetometer. SAA Setup | Advanced | Orientation sensor option This function is for magnetometer SAAs only. It allows the user to specify whether or not to use true north or magnetic north, and if true north, asks what the magnetic declination is at the current location. SAA Setup | Advanced | Hardware Triggering This function is used to select how the clock and record data inputs will be used to trigger and save data samples. Selecting this menu option brings up the window shown in Figure 6.81. Enable hardware triggering for all SAAs o If using a TTL-level clock signal on pin 4 of the DB-9 connector on the SAAR Interface Box to trigger SAA data. Enable hardware control for saving of raw data files o If using pin 3 of the DB-9 connector on the SAAR Interface Box to signal when raw data should be saved. o It is necessary to specify a serial port for the DB-9 connector on the SAAR Interface Box. o If using a SAAR Interface Box, it should not be necessary to change this port, as it is set by Measurand during factory installation. (See Appendix F) Raw data file name prefix o Is used to provide a name for any data that is automatically saved whenever the 'record data' line (pin 3) goes from low to high. Figure 6.81: ‘Hardware Triggering’ window. SAA Setup | Advanced | Use long time stamps When turned on, this function affects raw data. It will record time and date in long form (YYYY:MM:DD HH:MM:SS). 'File | Export raw data to text' will also be affected. 142 December 2014 SAA Software 6.5 Data and Graphs Figure 6.82: View of the ‘Data and Graphs’ drop down menu. Data and Graphs | Raw Data Raw accelerometer outputs (in A to D counts) can be viewed for any given SAA subsection by selecting this menu option. This brings up a window similar to that shown in Figure 6.83. Figure 6.83: Raw data for an SAA subsection (i.e. octet). Data and Graphs | Numeric Data Each of the three orthographic views has scaling numerals listed along its border. These numbers indicate position within the window in mm or inches. Also, data for joint positions, angles, accelerations, and temperature are available. Joint angles (rarely used) are the “bend” angles between segments. Joint position (X, Y, Z), rotation (RX, RY), and acceleration (Acc. X, Acc. Y, and Acc. Z) are all obtained from the accelerometer data over the active length of the SAA. Temperature data are also available at SAA joints associated with temperature sensors (every 8 segments). December 2014 143 Figure 6.84: Numeric data for an SAA. Data and Graphs | Graph Data An SAA's data can be graphed by using this menu item. This brings up the window in Figure 6.85 that allows the user to choose what SAA data to graph. Position, joint bend angles, acceleration, or temperature can be graphed as a function of time. The graph shown in Figure 6.86 is an example of position data of an SAA vs. time. Figure 6.85: Window prompting user to enter what data they would like to graph. 144 December 2014 SAA Software SAA o Select the SAA to graph. Type of Data to Graph o Select the type of data to graph: Position Bend Angles Acceleration Temperature Vertex Number o Select a vertex. Axis to Graph o Select an axis. Add o Once all choices are made, click to add to list to graph. Remove o Remove configuration from list. Figure 6.86: Example graph for X-axis position of joints 1, 2, 3, and 4 of an SAA. Graph Options o Allows the user to select ranges for the graph axes. December 2014 145 Figure 6.87: ‘Graph Options’ window for ‘File | Graph Data’. Save to File o Allows the user to save the contents of the graph to a “Text” file. Alarm Setup o Allows the user to setup Real-Time Alarms. Figure 6.88: ‘Real-Time Alarm Limits’ window for the current graph. Data and Graphs | View snapshot of SAA data This menu function is used to get a graphical representation of the shape of the SAA. In 3D mode, it produces XZ and YZ plots of SAA shape, and in 2D mode it produces an XZ plot of SAA shape. 146 December 2014 SAA Software 1. After choosing this menu item, a file navigation window will open, find the snapshot file that was saved and select it. 2. The window shown in Figure 6.89 will open. 3. See Section 6.2.7 for more information on this window. Figure 6.89: Snapshot view of SAA data. Data and Graphs | Vertical Displacements Relative to Reference SAA Shape Quite often there is a requirement to monitor changes in SAA data in real-time, or to periodically check an SAA from time-to-time to see if it has changed shape relative to some reference pose. The following steps should be taken to do this: 1. Make sure that the SAA is powered for a consistent length of time prior to taking any measurements. 2. Save a reference shape for the SAA by selecting the ‘File | Save text snapshot of SAA data’ menu item. This will prompt the user for the name of a “Text” file. It will then record the current shape of the SAA in the “Text” file specified. 3. Click on the ‘View | View Displacements Relative to Reference SAA Shape’ menu item. This will prompt the user for the name of the “Text” file that will be used as the reference SAA shape. Enter the filename specified for saving the text snapshot in Step 2 above. 4. Relative SAA displacements will appear in two windows similar to those shown in Figure 6.90 and Figure 6.91. December 2014 147 Figure 6.90: X-axis Barchart of relative displacements for an SAA. Displacements are relative to a previously saved text snapshot file (saved with the ‘File | Save text snapshot of SAA data’ menu item). Figure 6.91: Y-axis Barchart of relative displacements. 6. The ‘Graph Options’ button gives the user options to change some graph settings. The window in Figure 6.92 opens. 148 December 2014 SAA Software Figure 6.92: ‘Graph Displacement Options’ window. 7. Make selections and click ‘OK’. Reference XYZ Text File o The current XYZ “Text” file being monitored. Graph Type o Barchart o Line Graph Show Grid Lines o Turn graph grid lines on or off. Automatic Scaling o When un-checked the min and max fields become editable. Y-axis Type o Distance from Reference. o SAA Elevation. X & Y mins and maxs o When manually scaling fill in these fields. Data and Graphs | View +X-mark Roll Angle This menu item can be used to display the roll angle of the +X-mark of an individual SAA segment. It can be useful in cases where it is necessary to maintain the roll angle of the SAA at some known value (such as when scanning an inclined borehole). When the user clicks this menu item they are prompted to select a particular SAA segment (see Figure 6.93). December 2014 149 Figure 6.93: The prompt window for selecting a particular SAA segment for which to display the roll angle of the X-mark. After selecting a particular segment, a window similar to Figure 6.94 appears indicating the roll angle of the selected segment. A roll angle of 0 degrees corresponds to the +X-mark of the selected segment pointing upwards, or having its +X-axis acceleration maximized for its given inclination. The color of the roll angle graphic GREEN o if the roll angle is within +/- 1.0 degrees of zero YELLOW o if the roll angle is within +/- 5.0 degrees of zero RED o if the roll angle is more than +/- 5.0 degrees from zero Figure 6.94: Roll angle graphic colored RED indicating that the X-mark of the selected segment is more than +/- 5.0 degrees from zero. 150 December 2014 SAA Software Data and Graphs | Magnetometer data The ‘Magnetometer Data’ menu function presents a window that displays the locations of any magnetometers present in the SAA, along with their headings (in degrees) and their measured magnetic field strengths (see Figure 6.95). The magnetic field strength of SAA magnetometers is approximately one when used at Measurand's factory in Eastern Canada, but will tend to vary depending on where in the world the SAA is. The magnetic field strength is generally used as a measure of potential magnetic interference, such as from nearby ferrous materials, or from electromagnetic effects. In the absence of magnetic interference, the magnetic field strengths of all SAA magnetometers should agree well with one another (typically within 5 percent). If one or more magnetometers appear to be affected by magnetic interference, the twist corrections for those magnetometers should be disabled (see Section 6.4.13 ‘SAA Setup | Advanced | Enable / Disable magnetometer twist correction’). Figure 6.95: ‘Magnetometer Data’. Data and Graphs | Get vibration data Measurand’s SAAs can also be used to acquire vibration data, when they are operated in a special ‘vibration mode’, with Measurand’s optional ‘Vibration Module’. When operated in vibration mode, an SAA typically only provides acceleration data at one or two joints. By providing less data, the SAA is able to operate at a much higher sampling rate, making vibration analysis possible. Note: If the Vibration Module has not been purchased from Measurand then only limited features are available. Features such as exporting and saving vibration file data is only available with the module. 1. In order to view vibration data for one or more parts of an SAA, go to the ‘Data and Graphs | Get Vibration Data’ menu item. 2. Select what type of vibration data graph desired. December 2014 151 Acceleration vs. Time Acceleration vs. Frequency 3. Select which part(s) of the SAA the vibration data is for, as shown in Figure 6.96. Each 8 segments is considered a subarray. This window lists two subarrays. Figure 6.96: Select what type of vibration data and which part(s) of the SAA to view for vibration monitoring. Note: Typically, only every 8th joint of a Model 2 SAA is available for vibration monitoring. For field SAAs (SAAFs), the vibration sampling rate is inversely proportional to the number of SAA joints viewed. A sample size for the FFT (when viewing “Acceleration vs. Frequency”) is also chosen in this window; the optimal value for this will depend upon the nature of the vibration, time available, and the noise requirements for the test. Any sample size between 256 and 100,000 can be chosen for the FFT. 6.5.8.1 Acceleration vs. Time Graph 4. Click ‘OK’. 5. A ‘Choose Accelerometer View Options’ window will open, see Figure 6.97. 152 December 2014 SAA Software Figure 6.97: ‘Choose Accelerometer View Options’. Display Total Vibration o View total vibration for SAA segment(s). o Total vibration is the square root of the sum of the squares of the individual x, y and z vibrations. Display Individual Vibrations o View individual X, Y and / or Z –axis accelerations for SAA segment(s). 6. A ‘Vibration vs. Time’ graph will appear, see Figure 6.98. Figure 6.98: ‘Vibration vs. Time Graph’ window. 7. For more information on the ‘Graph Options’ and ‘Alarm Setup’ window features, see Section 6.5.3. December 2014 153 6.5.8.2 Acceleration vs. Frequency Graph 4. Select the sample size for FFTs, see Figure 6.99. Figure 6.99: ‘Choose Vibration Data’ window with FFT sample size text box. 5. Click ‘OK’. 6. After the FFT buffer has filled up, an FFT vibration plot of acceleration (m/s2) vs. frequency will appear in a window similar to that shown in Figure 6.100. 7. To see what the maximum vibrations are over a period of time, check the ‘View Max. Vibrations’ check box in the lower left corner of the ‘Acceleration vs. Frequency’ window (see Figure 6.101). The line of maximum vibrations vs. frequency will appear at the same time as the current line of acceleration vs. frequency. 8. For more information on the ‘Graph Options’ and ‘Alarm Setup’ window features, see Section 6.5.3. Figure 6.100: Graph of acceleration vs. frequency for the SAA joint closest to the near end of the SAA. 154 December 2014 SAA Software Figure 6.101: ‘Acceleration vs. Frequency Graph’ with Max Vibrations ON. 6.5.8.3 Save File There are various ways to save vibration data to file. A window similar to that shown in Figure 6.102 will appear. The ‘Choose Vibration File Type’ window provides three alternatives for saving vibration data. They are as follows: Figure 6.102: Window prompting user to select a type of vibration output file. Save to raw data (*.rsa) file o This option allows the data file to be played back later. Save to text data (*.txt) file o Save vibrations data as a function of time in text format. Save snapshot image of vibration graph o This option saves an exact replica of the ‘Vibration Graph’ window, such as the one shown in Figure 6.98. o The output image file is saved using the Windows Bitmap (BMP) format. December 2014 155 6.6 Viewing SAAs and SAA Data (Display Options) Figure 6.103: View of the ‘Display Options’ drop down menu. Display Options | Number of Views By default, SAARecorder splits the viewing window into four quadrants - three orthographic viewing windows, and one perspective viewing window in the lower-right corner. It is also possible to have just a single perspective viewing window. Figure 6.104: ‘Number of Views’ on screen selection. Display Options | SAA Thickness The displayed thickness of the onscreen SAAs can be changed by selecting this menu item. This is useful when zooming out to see very long SAAs. Changing the displayed thickness does not affect any of the data values output from SAARecorder. 156 December 2014 SAA Software Figure 6.105: ‘Set SAA Thickness’ window. Display Options | SAA Display Color The displayed color of the onscreen SAAs can be changed by selecting the 'Display Options | SAA display color' menu item. This is useful when zooming out to see numerous SAAs. Changing the displayed color does not affect any of the data values output from SAARecorder. Figure 6.106: Window to select a color for the entire SAA or just subarrays (Octets). December 2014 157 Figure 6.107: Color options for SAAs or Subarrays. Display Options | Magnify Vertical Displacement Selecting this menu option allows the user to apply a scaling factor to the horizontal motion of any vertical SAAs that might be present. If the SAA is being operated horizontally in ‘2-D Mode’ (see Section 6.4.4). The scaling factor applied is for visualization purposes only; it does not affect the actual numeric data in any way. If the scaling factor is set to any value other than 1, a warning message will flash in yellow text on the window to indicate the value of the horizontal (or vertical) scaling factor. Figure 6.108: ‘Magnify Vertical Displacement’ window. Display Options | Zooming In and Out 6.6.5.1 Zoom In Any given view can be zoomed in on by first selecting the view (left-clicking on the desired viewing window) and then pressing the '+' (plus) key, or selecting the ‘Display Options | Zoom In’ menu option, or scrolling upwards with the mouse’s scroll wheel. 6.6.5.2 Zoom Out Likewise, any given view can be zoomed out from by first selecting the viewing window and then pressing the '-' (minus) key, or selecting the ‘Display Options | Zoom Out’ menu option, or scrolling downwards with the mouse’s scroll wheel. 158 December 2014 SAA Software 6.6.5.3 Zoom to Fit Automatically zoom and pan all of the currently active views by clicking on the ‘Display Options | Zoom to Fit’ menu item, or by pressing the ‘F’ key. Display Options | View Data Rate Selecting this option allows the user to view the current data rates for each of the SAAs connected to the PC (see Figure 6.109). This option can be toggled on and off. Figure 6.109: View of data rates for each of the SAAs. Display Options | Reset view settings Clicking on this menu item or pressing <CTRL+D> resets the current view to its default zoom level and position. Display Options | Advanced | Change frame rate Clicking on this menu item brings up the window in Figure 6.110 where the frame update rate can be toggled up or down in Hertz. Figure 6.110: Found in menu 'Display Options | Advanced'. Display Options | Advanced | Show Inclination Warning Text Selecting this option allows the user to view any inclination warnings for each of the SAAs connected to the PC. This option can be toggled on and off. December 2014 159 Figure 6.111: When the inclination warnings are on, they appear in Yellow text. Mouse Feature | Panning the View Pan any of the views by first selecting the view (left-clicking on the desired viewing window) and then right-clicking and dragging the mouse in the viewing window. 6.7 Diagnostics Figure 6.112: View of the ‘Diagnostics’ drop down menu. Diagnostic Tests A number of diagnostic tests are available in SAARecorder to test the performance of an SAA and ensure that it is functioning correctly: Figure 6.113: ‘Diagnostic Tests’ Window. 160 December 2014 SAA Software 6.7.1.1 Voltage / Current Check For SAAs that are equipped with an SAATop module in their top segment (virtually all SAAs produced since 2011), this diagnostic test is available to measure the voltage, current and temperature of the top segment of the SAA. The “top segment” is immediately above the “sensorized zone” on a vertical SAA. Figure 6.114: ‘Voltage / Current Check’. Voltage o The voltage level is measured at the top (cable end) of the SAA. o The message to the right of this box informs the user if the voltage levels are within normal range or not. Current o The amount of current that the SAA is using. o The message to the right of this box informs the user if the current use is normal or not. Top Temperature o The temperature measured at the top of the SAA. If the actual measured voltage level is outside the nominal range, or if the current differs by more than 10 percent from the expected nominal current level, then this is usually an indication that something is wrong, contact Measurand (Appendix K). 6.7.1.2 Total Acceleration Check The total acceleration check computes the vector sum of the acceleration at each segment, and presents the result on a graph. Any total acceleration observed outside a 0.93 to 1.07 G range is usually indicative of some sort of problem, such as a broken wire, damaged sensor, etc. The vector sum of the accelerations measured in each segment of an SAA should be quite close to 1.0 G. December 2014 161 Figure 6.115: ‘Total Acceleration Check’. 6.7.1.3 Sensor Noise Test This test is only available when the SAA is NOT in AIA mode. It provides a measure of the typical sample-to-sample variation for each accelerometer sensor of an SAA. Typical values for this noise variation should be in the 4 to 24 counts range. Keep in mind however, that the surrounding environment should be completely free from vibration of any sort, as even someone walking by the SAA will tend to produce sensor fluctuations above the 24 counts level. Figure 6.116: ‘Sensor Noise Test’. 162 December 2014 SAA Software 6.7.1.4 Data Diagnostics Provides a summary of any communication errors (missed samples) that have been noted since the application has started collecting data from a particular SAA, as well as the minimum, typical, and maximum data latencies (i.e. length of time required to receive individual data samples). Keep in mind that the data latency will vary substantially depending on whether or not AIA mode is being used, and if AIA mode is being used, what the averaging level is (i.e. the greater the averaging, the longer the latency). Some SAAs may have an initial communications error (i.e. missed sample) upon power-up. This is normal and not a cause for concern. Also, for wireless serial links, it is usually impossible to have 100 percent error-free transmission, so for wireless links it is normal to see the missed samples quantity increase for each octet slowly over time. Figure 6.117: ‘Data Diagnostics’. 6.7.1.5 Communications Check This check attempts data collection with the far-most octet of the SAA at the following baud rates: 38400 bps, 57600 bps, 115200 bps, 230400 bps. If the test fails at any of the baud rates, it is an indication that there is a problem with SAA communications. For example one of the RS-485 lines running to the SAA might not be tightly screwed in, or the SAA cable could be too long. If there is a problem with this check, it could still be possible to get good data from the SAA if the baud rate is kept at the lowest possible value of 38400 bps. However, to ensure reliability, any deficiencies should be corrected if possible. This check is not available for wireless installations. December 2014 163 Figure 6.118: ‘Communications Check’. 6.7.1.6 SAA Bend Angles This Diagnostic test provides an output of the bend angles at each SAA joint, as measured in terms of the radius of curvature (either m or ft, depending on the units used). Figure 6.119: SAA bend angles expressed as a radius of curvature (in m or ft) at each joint. 164 December 2014 SAA Software 6.8 Calibrations Figure 6.120: View of the Calibrations drop down menu. In general, it should not be necessary to calibrate the SAA instrument. All of the necessary calibrations are performed at Measurand’s factory, and generally do not require re-calibration. In certain instances however, it might be necessary to re-calibrate, or at least check the SAA’s calibration. The calibrations that are sometimes necessary are listed below. Calibrations | Roll calibration The roll calibration of an SAA (i.e. the calibration that measures the rotational offsets of SAA segments about the longitudinal axis) can be verified by laying the SAA straight on a smooth, flat surface and selecting this menu item. If a smooth, flat surface is not available, PVC pipe can be used to hold the SAA. A window similar to that shown in Figure 6.121 appears, indicating what the current roll angle offsets are. These offsets should be in the range of -10 degrees to +10 degrees. If they are outside of this range, please contact Measurand (Appendix K). Figure 6.121: ‘SAA Roll Calibration’ window. Bar graphs are used to depict the roll offset error at each of the SAA's joints. December 2014 165 Scale o Vertical scale of this graph in degrees. Start Segment for Calibration o To do the roll calibration starting at the near segment of the SAA set the first box to “1”. o To start at some other segment set the number at a greater number. End Segment for Calibration o Set to the number of segments in this SAA in order to roll calibrate to the far end. o To roll calibrate a subsection of this SAA, set at a lower number. Set First Joint Roll Offset to Zero o Check this only if the X-mark on the SAA is physically aligned with the “up” axis. Calculate New SAA Roll Angle Offsets o Click to calculate new roll calibration offsets for this SAA. Restore Factory Roll Angle Offsets o Click to re-instate the factory roll calibration offsets for this SAA. Figure 6.122: ‘Near End Roll Angle’. Calibrations | 2D shape alignment (mixed (convergence) mode only) This calibration should only be used if the SAAs are operating in 2-D Convergence (some segments greater than 60 degrees from horizontal) mode. It is used to acquire a starting orientation for the shape of the SAA, so that accurate 2-D measurements can be made thereafter. 166 December 2014 SAA Software Figure 6.123: Window used for aligning initial 2-D shape. Note: Click the ‘Calculate SAA 2-D Shape Alignment’ button in Figure 6.123 to determine the initial alignment of the 2-D shape. This will increase the accuracy of subsequent 2-D measurements, provided that the shape of the SAA does not change significantly. Calibrations | Calibrate piezometer offset This calibration is used to establish a new zero pressure offset for one or more Measurand SAAPZ piezometers that are being monitored using SAARecorder. After the menu item is selected, a window confirms which piezometer should be calibrated (if there is more than one) and then the zero pressure offset calibration takes place immediately after that. The pressure output of the piezometer that was calibrated should read 0 kPa immediately after calibration. Note: This is useful if the user has a very large raw data file, but wish to concentrate on only a small section of the file. Use the ‘Start of File’ or ‘End of File’ check boxes if the user wish to specify a time corresponding to the start of the file or the end of the file respectively. Calibrations | Advanced | Horizontal Calibration This calibration is used to establish a horizontal reference for an SAA that is being used to make horizontal 2-D measurements. If survey points are available for the surface on which the SAA is being calibrated, these can also be used to obtain a more exact horizontal reference for the SAA. December 2014 167 It should be noted which side of the SAA is facing up, for example is the X-mark facing upwards. Figure 6.124: Window used for performing a horizontal calibration on an SAA. Import Floor Survey Data (Optional) o Import survey data from file. The use of survey data is optional. o If no survey data is provided then it is assumed that the SAA is perfectly horizontal. Restore Factory Horizontal Calibrations o Restore the factory calibrations for this SAA. Do Horizontal Calibrations o Perform the horizontal calibration for this SAA. o If survey data was provided, then the SAA will be calibrated to match the survey data. o Otherwise, the SAA will be calibrated to be horizontal. 6.8.4.1 Floor Survey Text File The “Floor Survey Text” file should be similar to the following: Floor Survey Text File Units: mm X, Z Data begins; 0.0, 0.01 300.0, 0.05 600.0, 0.05 900.0, 0.09 1200.0, 0.06 Etc. Where the X-axis dimension corresponds to the long direction of the floor and the Z-axis dimension corresponds to the vertical elevation of the floor and has to be parallel to the gravity vector. The survey data is only used to calculate the inclination of the individual links. Any offsets in the Z-axis dimension (x=0, z=0) are not considered. The data can be in Millimeters (mm), Meters (m), Inches (in) or Feet (ft). 168 December 2014 SAA Software The survey data is assumed to start at the near reference end (where the cable is) and extend to the far end of the SAA. Calibrations | Advanced | Vertical Calibration This calibration is used to straighten the SAA. Calibrations | Advanced | Load previous vertical calibration This menu item allows the user to select a previously set Vertical Calibration or re-establish factory defaults. Figure 6.125: Window to select calibration. Calibrations | Advanced |Join SAAs together This option should only be used by trained Measurand personnel to combine (in Software and Hardware) two or more SAAs into a single SAA. 6.9 Troubleshooting & Support (Help) Figure 6.126: View of the ‘Help’ drop down menu. December 2014 169 Help | About SAARecorder Clicking on the ‘Help | About SAARecorder’ menu item opens a window similar to Figure 6.127 providing SAARecorder version number, Copyright and a link for updates. Figure 6.127: ‘About SAARecorder’ window. Help| Documentation Clicking on the ‘Help | Documentation’ menu item gives the choice between SAARecorder Documentation and SAACR_Raw2Data Manual. Choosing either option will open a PDF. Help | Keyboard Shortcuts Clicking on the ‘Help | Keyboard Shortcuts’ menu item opens a window similar to Figure 6.128 providing a list of keyboard shortcuts. Figure 6.128: ‘Keyboard Shortcuts’. Help | Tutorial Videos Clicking on the ‘Help | Tutorial Videos’ menu item opens the Measurand website on the Tutorial Videos page. Other ways of connecting SAAs Communications | Search for serial SAAs (Section 6.3.3) Communications | Advanced | Network | Search for network SAAs (Section 6.3.6) 170 December 2014 SAA Software 7. SAAView SAAView is used to visualize 3D or 2D data from ShapeAccelArrays (SAAs). Typically the data are generated in the field, stored in a Campbell Scientific Data Logger then retrieved manually, automatically, and / or wirelessly. Arriving raw data are translated into readable form in SAACR_raw2data and then opened in SAAView. SAAView may also be used to view exported files from SAARecorder, the “real-time” 3D viewer for SAA. SAAView functions include graphical viewing and export as images or data files in various formats. SAAView may also be used to view non-SAA piezometer, earth pressure cell, or strain gauge data if it is converted through SAACR_raw2data from Measurand’s SAAPZ or from “third party” devices. SAAView opens files of Cartesian data, named “multi_saa_allcart.mat”. These files hold data from multiple SAAs in binary form. One SAA at a time may be viewed. It is possible to view SAA data along with non-SAA data in the same graph using the ‘GraphAll+’ function (Section 7.3.3) of SAAView. 7.1 Running SAAView When SAAView is started the window in Figure 7.1 opens and gives the user a choice of four possible locations to pull data from. SAAView is looking to open a “*.mat” file of converted Cartesian data. Figure 7.1: ‘Initial’ SAAView window. SAARecorder Selection Selecting this allows the user to open a project that would have already been exported from SAARecorder using the “Export to SAAView” selection (Section 6.2.6.1). The default location of SAARecorder data is ‘C:\Measurand Inc\SAARecorder\Data’, but it will not necessarily be in that folder. CR Logger Selection Selecting this allows the user to open a project that would have already been processed in SAACR_raw2data (Section 5). The default location for logger data is in ‘C:\Measurand Inc\SAA3D\logger_data\[project name]’, but a user’s data will not necessarily be there… i.e. it’s December 2014 171 possible a user could be using a different folder. Select a “multi_saa_allcart.mat” file avoiding any such files with “*_1*”… “*_n*” or “_root”. DL1_Logger Selection This is for users with a Legacy DL1 Data Logger. Selecting this allows the user to open a project from a Measurand DL1 Logger, not a Campbell Scientific Data Logger. Server Selection Selecting this allows the user to open a project that is stored on the Measurand server. A password and username will be required and provided by Measurand. The window in Figure 7.2 will open allowing the user to choose a project previously stored on the server. Figure 7.2: The window for retrieving files from the Measurand Server. 7.1.4.1 New Project button After clicking this button a User Name and Password Field will open, see Figure 7.3. Enter username and password for a Project not already on the list to the left. A project will not be seen on the list if it has not been previously selected and inserted. Figure 7.3: ‘New Project’ button clicked, Username and Password required. 172 December 2014 SAA Software After entering User Name and Password, click ‘Submit’, a text field will appear with the Username defaulted in. This field can be edited, whatever name appears in the text box when the ‘Insert Name’ button is clicked will be the name of the file displayed in the window on the left. Once the ‘Insert Name’ button has been clicked and the file name has appeared in the left window, it is now time to click one of three buttons to download the data; ‘Incremental Download’ (Section 7.1.4.4), ‘Download All Files’ (Section 7.1.4.5) or to see what data is available for the current project file click ‘Get Server Listing’ (Section 7.1.4.6). Figure 7.4: 'Submit' button clicked, project name appears. Figure 7.5: The file "project" has been moved over to the left window, though the data is not yet downloaded. If the Project required is in the list to the left of the window, select the Project and click one of the following buttons. In reaction to all but the first button, SAAView will open with the selected Project (see Section 7.2). December 2014 173 7.1.4.2 Delete Name Button Delete the project name from the selection list. 7.1.4.3 Open Saved Project Button Open the selected project without downloading (must have been downloaded previously). 7.1.4.4 Incremental Download Button FAST: Download the LATEST DATA ONLY, and concatenate it to saved data for the selected project and then open the project. If there is no new data to download, the little message box in Figure 7.6 will appear. Figure 7.6: The message box that appears when there is no new data to download. 7.1.4.5 Download All Files Button SLOW: Downloads ALL FILES from the selected project. The Project then opens with the ‘Sparse View’ window open, see Section 7.2.2.5. 7.1.4.6 Get Server Listing Button View the files available for download, for the selected file. Figure 7.7: The warning that appears when the data is from a Measurand's Legacy DL1 Logger. 7.2 Main Window Overview Once a project and files have been selected, the window in Figure 7.8 or Figure 7.9 will open. 174 December 2014 SAA Software Figure 7.8: The ‘Main’ SAAView window of a vertical SAA (Project: large_shear). Figure 7.9: The ‘Main’ SAAView window of a horizontal SAA (Project: horiz_pz_epc). SAAs and their previews will appear. By selecting an SAA from the small green list-box on the left, the pre-filtered and unfiltered previews will display for the selected SAA in the lower portion of the window. To perform additional filtering click the green ‘FilterSAA’ button (see Section 7.2.4). To set Azimuth click the green ‘AzimuthSAA’ button (see Section 7.2.5). If the SAA selected is horizontal then the ‘AzimuthSAA’ button will not appear as seen in Figure 7.9. December 2014 175 Note: The scales in these graphs are in inches and feet or millimeters and meters. The units can be changed by clicking ‘Settings’ on the ‘Main’ window and selecting ‘Metric / English’. The ‘QuickView’ button gives a rotatable 3 dimensional view of the first and last frames of SAA data (a frame is one sample of data in time). To set alarms, for either SAAs or non-SAA sensors, click the ‘AlarmSet’ button (see Section 7.2.7), for a summary of the SAA alarms click the ‘View’ button beside the ‘AlarmSet’ button. The large green list-box in the top right of the window shows the filter details of the SAA selected. The following list is a breakdown and description of columned fields: Ser# Serial number of the selected SAA. Avg Averaging depth. Skip Show data only at this interval. SpkFilt Spike filter is on or off. Active% Percentage along the length of the SAA that is active. Azi Incoming Azimuth degrees from previous program (i.e. either SAACR_raw2data, SAARecorder, or SAACR_Raw2DataConfiguration (part of SAACR_FileGenerator)). Aza Additional azimuth degree set within SAAView. Once all changes are made, if any, the unfiltered or filtered data can be viewed by clicking either the ‘ViewUnFiltered’ or ‘ViewFiltered’ buttons respectively (See Section 7.3). Note: The ‘Main’ window is a PREVIEW of data. Non-SAA sensors, if any are present, will state the number of sensors present beside the type listed. They are in the small yellow list-box on the left below the green SAA list-box. By clicking on a present non-SAA sensor the large list-box on the right will turn yellow and populate with a list of all the nonSAA sensors of the type (i.e. PZ!, PZ3,…) selected on the left (see Figure 7.10). The pre-filtered and unfiltered previews will display for the selected non-SAA sensors in the lower portion of the window. The non-SAA sensors can be further filtered by clicking the now yellow ‘FilterSensor’ button (see Section 7.2.3) and alarms can be set by clicking the ‘AlarmSet’ button (see Section 7.2.7). 176 December 2014 SAA Software Non-SAAs are viewed along with SAA data in the ‘GraphAll+’ view, see Section 7.3.3. There is no other way to view non-SAAs outside the ‘Main’ window. Figure 7.10: The ‘Main’ SAAView window when a non-SAA has been selected (Project: boston_uk_tides_pz). Note: the variations are due to tidal water height, not unstable data. Note: The ‘ViewFiltered’ and ‘ViewUnFiltered’ buttons do not enable viewing for non-SAAS. If clicked they will open the last SAA selected. December 2014 177 File Menu Figure 7.11: The ‘File’ menu in the ‘Main’ window (Project: boston_uk_tides_pz). Note: the variations are due to tidal water height resulting in actual deformation, and do not represent unstable data. 7.2.1.1 Export Data To export data use ‘ViewFiltered’ or ‘ViewUnFiltered’ buttons (Section 7.3) and select ‘Graphall(+Exports)’ menu item (Section 7.3.3). 7.2.1.2 Save image Selecting this menu item will save a screen shot of the ‘Main’ window. 7.2.1.3 Delete SAA Filter File Selecting this menu item will cause a window to open with a warning that this action will delete the “Filter” file which will remove filtering for ALL SAAs. Selecting ‘Yes’ will remove “C:\Measurand Inc\Saa3D\logger_files\[project file]\ArrayFilterSaa.mat”. 7.2.1.4 Delete Sensor Filter File Selecting this menu item will cause a window to open with a warning that this action will delete the “Filter” file which will remove filtering for ALL TYPES of non-SAAs. Selecting ‘Yes’ will remove “C:\Measurand Inc\Saa3D\logger_files\[project file]\ArrayFilterSensor.mat”. 7.2.1.5 Delete Alarm File Selecting this menu item will cause a window to open with a warning that this action will delete the “Alarm” file which will remove alarms for ALL SAAs and non-SAA sensors. Selecting ‘Yes’ will remove “C:\Measurand Inc\Saa3D\logger_files\[project file]\ArrayAlarmSaa.mat” and “ArrayAlarmSensor.mat”. (See Section 7.2.7) 7.2.1.6 Delete AutoCall File Selecting this menu item will cause a window to open with a warning that this action will delete the “Auto Call” file “C:\Measurand Inc\Saa3D\logger_files\[project file]\auto_call_settings.mat”. (See Section 7.3.2.4) 178 December 2014 SAA Software Settings Menu Figure 7.12: The’ Settings’ menu in the ‘Main’ window (Project: boston_uk_tides_pz). 7.2.2.1 Metric / English Selecting this menu item will change all the measurements: Meters <-> Feet Millimeters <-> Inches 7.2.2.2 Edit Project Name Selecting this menu item allows the user to edit the project name. Be aware, this does not change the name of the project folder, just the project name in SAAView. It is recommended to copy the files over to a new project folder and then change the project name to correspond. Figure 7.13: The window to change a project’s name. 7.2.2.3 Elevation Offsets Selecting this menu item, only when an SAA is selected, will cause a window to open, as seen in Figure 7.14, allowing the user to set the elevation of one end of each SAA. The application calculates the other end automatically. December 2014 179 Figure 7.14: The ‘Select Elevations’ window. 7.2.2.4 Auto Scale / Manual Scale Selecting the ‘Manual Scale’ menu item causes a small window to open allowing the user to set the scales for the deformation data, as shown in Figure 7.15. Selecting the ‘Auto Scale’ menu item causes the application to automatically scale for the deformation data. Figure 7.15: The ‘Manual Scale’ window. 7.2.2.5 Change SparseView Settings Large Files may result in the earliest 80% of the data being reduced to every nth frame (Unfiltered preview / view / exports only). Selecting this menu item will cause a window to open allowing the user to adjust SparseView settings. The number of frames of data can be adjusted as well as other settings. The ‘SparseView Settings’ window, as shown in Figure 7.16, will inform the user of the number of frames of data in the current file for the particular SAA that was highlighted when this menu item was selected. When SparseView is active, early frames are thinned out in time to allow faster opening and prevent PC crashes due to graphics or memory allocation limitations. SparseView only affects UnFiltered data and UnFiltered exports. 180 December 2014 SAA Software Figure 7.16: ‘SparseView Settings’ window. The choices available in SparseView are as follows: Set NumFrames that will open SparseView o Select the number of frames (samples) of data that will enable SparseView. Force opening w/ SparseView ON o Force opening with SparseView even if the number of frames is less than the frames limit. Try opening w/ SparseView OFF o Try opening without SparseView (Program may crash). Do not open the file at all o Do not open this file. Select a different file. The SAAs associated with the current project are listed in the little green box to the left of center near the top of the window. Each SAA has a list of information noted in the large green box to the right of center near the top of the window. To use the following buttons and to preview the data an SAA must be selected from the small green box first. The application defaults to the top SAA of the list. December 2014 181 FilterSensor Button Figure 7.17: ‘Filter Sensor’ window, note the scale is in days and kPa (Project: boston_uk_tides_pz). By selecting an available non-SAA sensor in the small yellow box on the left of the ‘Main’ window, the green buttons available for the SAAs disappear and a yellow ‘FilterSensor’ button appears. Clicking this button opens the window shown above in Figure 7.17. It allows the user to filter the data for each sensor. For details about how to use the window, see the next section (Section 7.2.4). FilterSAA Button Figure 7.18: The ‘Filter Settings’ window for vertical SAA (Project: large_shear). 182 December 2014 SAA Software Figure 7.19: The ‘Filter Settings’ window for a horizontal SAA (Project: horiz_pz_epc). The ‘FilterSAA’ button is used to remove outliers, customize averaging and select data display intervals to speed up subsequent viewing. Unfiltered (all) data show as black points: Filtered as blue circles: Deleted as grey points. Only blue circle data are passed along for Filtered Viewing. 7.2.4.1 File Menu Delete “Filter” File (see Section 7.2.1.3). 7.2.4.2 Settings Menu Most settings can be made by clicking on a “--“ line or on a slider. Some settings require moving the “--“ lines first to define a point, block or range. “Locking” a sensor will preserve its unique settings even when settings of other sensors are changed, unlocked sensors all get the same (latest) settings. 7.2.4.3 Left Graph Holding the left-click the user can drag the “--” lines where desired. Right clicking the “--” lines allow the user to ‘Reset Limits’, this resets the lines to the default limits. 7.2.4.4 Right Graph – Right-Click Dashed Lines Holding the left-click the user can drag the “--” lines where desired. Right clicking the “--” lines gives the following menu options: December 2014 183 Figure 7.20: Right Click menu (Project: large_shear). 184 Non-Single Mode o In non-single mode, the user can select data at regular intervals (“skip” interval), filter out “spikes”, and remove individual points or “blocks” of contiguous points. In any mode, the user can select the portion of the SAA length to view. It can be used with SAA or non-SAA data. Single Mode: o Passes only the selected points to the left graph (useful for selecting just a few points). As seen in Figure 7.21, where two data points have been selected and show as a light blue and a red line in the left graph. o A legend will appear showing the selected times. The legend can be dragged around the window. o Left-click a “--” line in the left graph and drag the line to a desired point. Select Single Right-click the “--” line to choose that single point in time. De-Select Single Before moving the “--” line, right-click the “--” line to choose that single point in time to de-select it. December 2014 SAA Software Figure 7.21: Two points selected for viewing, and the legend is movable (Project: large_shear). Figure 7.22: Three points selected for viewing in single mode (Project: horiz_pz_epc). Delete Single o Before moving the “--” line, the just selected single data point can be deleted. Restore Single o This option will restore a previously deleted data point. Delete Block o Create a block of time by sliding the left and right “--” lines by holding and dragging the left-click. Right-click and select this menu item to delete the created block of time. December 2014 185 Figure 7.23: The first section was deleted but can still be seen in grey in both graphs (Project: large_shear). Figure 7.24: The first section was deleted but can still be seen in grey in both graphs (Project: horiz_pz_epc). 186 Restore Block o Right-click and select this menu item to restore the deleted block of time. Skipinterval = Avg o This option makes the skip interval equal to the average. Skipinterval = LineSpacing o This option makes the skip interval equal to the line spacing. No Skip (All Active Pts) o Selecting this option removes any skip intervals, all active points will be shown. December 2014 SAA Software No Skip, No Avg o Removes all default and user-defined intervals and averaging. Figure 7.25: ‘No Skip, No Average’ (Project: large_shear). Figure 7.26: ‘No average, no Skip’ (Project: horiz_pz_epc). 7.2.4.5 Sliders The leftmost slider is used to select the vertex of an SAA to view, or a particular sensor within a sensor type to view. For non-SAA sensors, it can be right-clicked to lock/unlock the sensor (to prevent it from taking on settings from unlocked sensors). When a vertex is selected on the slider, the left graph will show the vertex with a black grouping. The right graph will display that vertex deformation in more detail. December 2014 187 The right slider represents the depth of frame averaging. This is used to calculate the mean data and set the default interval. The time interval can be changed from the default to minutes, seconds, hours, days or months using the drop-down list below this slider. 7.2.4.6 Other Options FullScale checkbox - Check this box to enlarge the scale and see all the points, including those removed by the spike filter. SpikeFilter radio button - Apply spike filtering to delete large departures from “normal” data for the selected SAA. Turn off if “normal” data have unintended grey-out points. AzimuthSAA Button Figure 7.27: The 'AzimuthSAA Settings’ window (Project: boston_uk_tides_pz). Azimuth is a rotation of the X and Y data about vertical (gravity). If zero, the data are in the XY coordinate system of the SAA. Each SAA has an X-mark at its top and bottom. +X deformation pushes the mark forward “ahead” of the SAA. Looking down, +Y is to the left of +X, as seen in XY square graph in Figure 7.27. The ‘AzimuthSAA’ button is not available for horizontal SAAs because there is no Y. 7.2.5.1 Left-Click Dashed Lines The “--” lines are used to select the vertex of an SAA to view. To move them left click the “--” line in either graph and drag it to the desired position. 7.2.5.2 Right-Click Dashed Lines AutoFind Max Deformation o Selecting this option will cause the dashed line to move to the elevation with the maximum deformation. See Figure 7.28. AutoAz at Selected Elev o Selecting this option will adjust the Azimuth automatically so that the resultant deformation at the selected elevation is in the +X direction only. Do Both o Selecting this option will do both of the previous options at once. 188 December 2014 SAA Software Figure 7.28: Max Deformation option is selected (Project: boston_uk_tides_pz). 7.2.5.3 Azi and Aza Aza affects the Filtered view, Aza can also be applied to the UnFiltered view by selecting ‘Apply Aza’ next to ‘View UnFiltered’ in the ‘Main’ window. Azi is “incoming Azimuth” set in the previous application, e.g. SAACR_raw2data. The SAAXMark and SAAYMark lines in the XY graph (the square graph) are not rotated by Azi. Aza is “additional Azimuth” set in this window. The SAAXMark and SAAYMark lines, and the XY plot of data in the XY graph ARE rotated by Aza. If Aza = 0 then SAAXmark faces up as seen in Figure 7.29. Figure 7.29: Changing the Aza (Project: boston_uk_tides_pz). December 2014 189 When applying an offset to the Azimuth, keep in mind positive numbers rotate clockwise (when looking down onto the SAA) while negative numbers rotate counterclockwise. Total Azimuth which is the total rotation relative to original raw data is the sum of Azi and Aza. Manual Aza is when the editable box near the square graph (XY Graph) is used and the ‘Apply’ button is clicked. The ‘Apply’ button updates data in the four graphs based on the new azimuth value. Automatic Aza - Drag the “--” lines in the X and Y views to a point of elevation, right click and select ‘Auto-Aza’. The data are rotated to set the most recent Y value to zero at the manually or automatically selected elevation. This has the effect of maximizing the deformation in the X view (similar to rotating the SAA to point +X in the direction of deformation). No Aza – To leave all data in the coordinate system of the SAA (as modified by any Azi) manually set Aza = 0. Save Aza – Aza are saved with the SAA Cartesian data, separate from “Filter” files. Quick View Button Figure 7.30: ‘QuickView’ window (Project: boston_uk_tides_pz). Views the first and last frames of data as “absolute shapes” (blue & red lines in each graph) as well as the difference between them (black lines…try zooming in). 7.2.6.1 File Menu ‘Save View’ is very similar to the ‘Capture’ button (see Figure 7.31), though ‘Save View’ opens a window to save the “view_quick[arr1].png” file and the image includes the button and slider similar to a screen shot. 7.2.6.2 Rotating Graphs Using the left or right mouse button (holding it down), click either graph and move the mouse around to rotate the view. 7.2.6.3 X Button Clicking this button gives 2 D side-on views of XZ and YZ data. 190 December 2014 SAA Software 7.2.6.4 Z Button Clicking this button gives a 2 D top-down view of XY data. 7.2.6.5 Default Button When clicked this button returns the view of the two graphs to the default view. 7.2.6.6 Capture Button This button when clicked is very similar to the ‘Print Screen’ feature. Open an image application like ‘Paint’ and paste the captured image. The Captured image is just of the two graphs and their legend. See Figure 7.31 below. Figure 7.31: Results of 'Capture' button in 'QuickView' (Project: boston_uk_tides_pz). 7.2.6.7 EI = 0 Radio Button Disallows tilting of view, gives a 2D X, Y, Z view of the graphs. 7.2.6.8 Zoom Slider The zoom slider allows the user to zoom into or out of the graphs. This feature is best utilized when the ‘EI=0’ button is clicked allowing the user to clearly zoom in to see the difference (black line) between the first and the last frame (blue and red lines). December 2014 191 AlarmSet Button Figure 7.32: The ‘Main Alarm Settings’ window (Project: boston_uk_tides_pz). The Alarm Parameters function creates “Alarm” File for SAAs or non-SAA sensors. “Alarm” files are for use during conversion of new data in SAACR_raw2data (Section 5), not for generating actual alarms in SAAView, which does not use alarms. However, SAAView is used to EVALUATE alarms after they are generated. Creation and evaluation of alarms are done in SAAView because it is easier to see the context of any alarm selections on a larger data set. Use the ‘Parameters’ button to create alarms that will be enacted when SAACR_raw2data (Section 5) performs a conversion to raw SAA or non-SAA sensor data to engineering units. This window provides a summary of Alarms and a means to turn them on or off (where “ON” means the alarm is ready to be triggered by events when the SAACR_raw2data converter runs). This window also enables copying one alarm’s set of parameters to other alarms. 7.2.7.1 File Menu Delete “Alarm” File (see Section 7.2.1.5). 7.2.7.2 Settings Menu About Time Settings: When a particular time is to be set, drag the vertical dashed line and right click it to select that time. 7.2.7.3 Alarm Level Drop-Down List There are 8 levels of alarms, each level can have different parameters and actions. 192 December 2014 SAA Software 7.2.7.4 Parameters Button Figure 7.33: Green ‘SAA Params’ button for Vertical SAA (Project: boston_uk_tides_pz). Figure 7.34: Green ‘SAA Params’ button for Horizontal SAA (Project: horiz_pz_epc). December 2014 193 Figure 7.35: Yellow ‘Sensor Parameters’ button showing Pzs (Project: boston_uk_tides_pz). Figure 7.36: Yellow ‘Sensor Parameters’ button showing EPCs (Project: horiz_pz_epc). 194 Filtered Check-Box o The Alarm function can act on Filtered (by the SAAView filter function) data, but it is best to use it on UnFiltered data, as that is what will normally be available in SAACR_raw2data (Section 5). Note that UnFiltered data ARE truncated by any filter setting that excludes vertices from the data. By default, SAAView performs some truncation in its filter function. This can be important if, for instance, part of the SAA is on a reel or temperature artifacts near the surface distort the data. To change this behaviour, change the filter settings in the “Main Preview” window: select ‘FilterSAA’. December 2014 SAA Software Note: The source of the spikes, or other problems, should be found and eliminated. Usually errors are caused by hardware / software setup and the raw data. Make corrections before proceeding to use alarms. Magnitude Check-Box o Selecting ‘magnitude’ guarantees that the selected variable will always increase in the positive direction. If ‘magnitude’ is NOT selected, then some variables can be negative at times. Note that even when ‘magnitude’ is NOT selected, and X and Y components exist, deformation data are treated as sqrt(dx^2 + dy^2). Even so, this can lead to negative values, for instance when the first frame is slightly larger than subsequent frames. Variable List o Select the variable to use as a basis for the alarm: var – var(1) - subtracts the first frame of data from all the data, thereby changing “shape” to “deformation” or “pressure” into “change in pressure”. Rate - is the time-rate-of-change of the variable Var - is the variable itself without any initial data subtracted. Comparison (“Old”) Data List o This is the data used as a basis of comparison for the alarm. Average of n - takes the mean of n preceding frames, where n is selected below. Selected Time - uses a single frame as a selected time, selected by dragging the vertical dashed line to a time, then right –clicking it to select. Current-1 - is the frame immediately preceding the most recent frame. Current Data List o The data that will be compared to the “Comparison”, or “old” data defined above. Non-avg Single - the most recent frame. Avg of n - the mean of the most recent n frames, where n is selected below this list. Limits List o Trigger an alarm if the variable increases (Upper), decreases (Lower) or both relative to its basis. Units / Value List o “Change” denotes a comparison of “Current” to “Old” according to previous settings. “Limit” denotes a value that if met or surpassed by the variable, triggers an alarm. “%” denotes a percent change. “Units” denotes a change by n units of the variable, where n is set below this list. Apply Button - The ‘Apply’ button must be clicked for the field to be applied. Action Settings Button o Select ACTION settings (e.g. sound, email, sms), to be taken when an alarm is triggered. o A sound can be set to go off when an alarm is triggered. o As well as an Email or text message (SMS) sent. December 2014 195 Figure 7.37: ‘Actions Settings’ Window. Vertex or Sensor # Slider o The vertical slider is used to select any vertex of an SAA or any non-SAA sensor of a type (e.g. “piezometer” or “strain gauges”). 7.2.7.5 On / Off Button This button requires the target alarm to be highlighted before clicking the button. 7.2.7.6 All On / Off Button Clicking this button turns all the alarms off or on. 7.2.7.7 ‘Copy 2 All’ Button This button requires the target alarm to be highlighted before clicking the button. 7.2.7.8 Copy From Button The ‘Copy From’ button requires two steps: Select the recipient alarm. Click the ‘Copy From’ button. Select the SAA with the settings to be copied. 7.2.7.9 Save Button The ‘Save’ button preserves the selected final states as well as any saved Parameters or copies of parameters. Note that each setting of ‘Parameters’ has its own ‘Save’ button as does the ‘Actions’ setting within ‘Parameters’. The ‘Save’ steps result in “ArrayAlarmSAA.mat” and “ArrayAlarmSensor.mat” being created in the project folder. These are what SAACR_raw2data uses to enact alarms. View Button The ‘View’ button when clicked will give a detailed list of the Alarms. 196 December 2014 SAA Software Figure 7.38: A detailed list of alarms. 7.3 Unfiltered / Filtered Data View Windows Note: Viewing Filtered data can be deceptive. It is important to understand the effects of averaging and other filter parameters on the data. A comparison of Filtered and Unfiltered view can help in diagnosing possible issues. Figure 7.39: ‘Unfiltered’ data view of a Vertical SAA (Project: large_shear). Note: Hovering the mouse over most of the controls will cause a definition of the control to appear. December 2014 197 Figure 7.40: ‘Filtered’ data view of a Vertical SAA with azimuth adjusted (Project: large_shear). Figure 7.41: ‘Unfiltered’ data view of a Horizontal SAA (Project: horiz_pz_epc). 198 December 2014 SAA Software Figure 7.42: ‘Filtered’ data view for a Horizontal SAA (Project: horiz_pz_epc). Notice in the Horizontal SAA the Filtered and Unfiltered views are missing the Y and XY Graphs. They are not required for an SAA that is horizontal as there is no “looking down view” (XY Graph) nor is there a Y position. File Menu Export Data (Moved) – To export data go to ‘Graphall (+Exports)’ (Section 7.3.3). Save Image – A ‘Save File’ window will open starting in the project folder allowing the user to give a name to the image and change the folder. Saves the image of the window in “.png” format. Settings Menu The first five settings in this menu drop down list are described in Section 7.2.2. Figure 7.43: ‘Filtered View’ window with labels for graphs. December 2014 199 7.3.2.1 Edit Site Photo Size Choosing this menu item opens a small window allowing the user to change the size of the Site Photo on the window by percentage. The Site Photo can be personalized by placing a “site_image[n].png”, “site_image[n].jpg” or “site_image[n].bmp” file in the folder holding project data (where n is the sequential number of the SAA at the project site). Only this file name with the bracketed numbering will work. To disable the Site Photo set the width and height to zeroes in the ‘Edit Site Photo Size’ menu option. Figure 7.44: ‘Edit Size of Photo’ window. 7.3.2.2 Edit Message Box Choosing this menu item allows the user to edit the text inside the Message Box. The changes only stay while in editing mode to allow for screen shots. Click the ‘Settings’ menu and uncheck the ‘Edit Message Box’ menu choice to return to the default Message Box text. 7.3.2.3 Change SparseView Settings See Section 7.2.2.5. 7.3.2.4 AutoCall Choosing this menu item opens a window like the Figure 7.45 below. ‘Auto-Call’ allows the user to name a group of settings and select the desired SAAs to be included for automatic image exporting. This will export an image of the ‘View Screen’ for each group of settings for each SAA included. The Steps to use This Menu Selection: 1. 2. 3. 4. 5. 200 Click the ‘ViewFiltered’ or ‘ViewUnFiltered’ button and make the desired settings. Click the ‘Settings | AutoCall’ menu option. Name the group of settings and select the SAAs to be included. Repeat this process, there is space for up to 30 different groups of settings. To add the following command-line to LoggerNet, see Section 4.2.4. Command-Line: saaview.exe auto_call [path the project folder] all_names Or for batch processing, use the same command-line in Section 4.2.4. Output Files: “view_auto_[unique setting name]_[sernum].png” December 2014 SAA Software Figure 7.45: ‘Auto Call Setup’ window. Command-line calls can be made to SAAView to export images of the ‘VIEW’ window (Filtered or UnFiltered). Each image will use a named group of Settings for ‘Edit Site Photo Size’, ‘Edit Message Box’, whether a filtered or unfiltered view was called from the ‘Preview’ window, and one of cumulative displacement, incremental displacement, or cumulative deviation; Auto-Call is set up by making VIEW settings, then saving a name to associate with those settings. One or more names may be called from the command line. An option is available to export files for all names manually: ‘Settings | AutoCall | File’, which can only be used after the command line has been run and there are images available to export. The Message Box appearing in the ‘VIEW’ window will by default contain settings information for each image, specific to each SAA. This is helpful in interpreting what is being viewed. Note: All settings are saved as overrides to automatic settings, by AutoCall. Leave most settings (e.g. azimuth, filtering, project name, ..) constant between command line calls or inconsistent images could result. To maintain consistency manual viewing should be done with a separate ‘Project’ folder holding copied “multi_saa_allcart.mat” (and any other non-SAA sensor) data. 7.3.2.5 View menu This menu allows the user to decide the type of data to view, these settings do affect the export. Deformation (CumDisplacement) dx, dy – Accumulative Displacement. Absolute Shape (CumDeviation) x, y – Accumulative Displacement. Magnitude sqrt(dx^2+dy^2) – Overall Displaced Vector. Incremental Displacement d(diffx), d(diffy) – Incremental displacement. Shear (IncDisplacement / Length, %) –Shows Displacement over Segment Length by Percentage. Temperature – Measured at each temperature sensor. Advanced – Consultation with Measurand is recommended. o Rotation Diagnostic – Tests for whether or not there has been a rotation of the SAA. o Accel Total – Test for total acceleration issues with SAA. December 2014 201 GraphAll(+Exports) Figure 7.46: ‘GraphAll’ graph for a Vertical SAA and 7 PZ3s (Project: boston_uk_tides_pz). Figure 7.47: ‘GraphAll’ graph for a Horizontal SAA, 12 PZz3s and 2 EPCs (Project: horiz_pz_epc). ‘GraphAll’ plots all available sensors (converted by SAACR_raw2data) including SAA, PZ, EPC, and SG on common axes. Incoming SAA data carry the settings made in SAAView (e.g. units will be metric if so selected). Non-SAA sensors have the units set during conversion. 7.3.3.1 File Menu Export Data 202 December 2014 SAA Software o o By choosing this menu item a file will be created with the data of the current SAA and any non-SAA data present with the current settings. The following window (see Figure 7.48) will open warning the user to turn off ‘Relative’ (to first reading) or use current ‘Relative’ settings for the non-SAA sensors. Note: Non-SAA data are exported only in VDV exports. Figure 7.48: Warning message after clicking ‘Export data’. o o o Settings Button o Takes the user to the ‘Export’ window, seen in Figure 7.49. Turn Off Button o Turns off any relative settings made and returns the settings to relative to first reading. By clicking either button (not Cancel) the ‘Export’ window will open (see Figure 7.49). o Format Drop Down List Atlas_1 – ASCII in Atlas format (1D/file*num_saa in Atlas_SAAView folder. 2 NAN columns are reserved for future). Atlas_3 – Same as Atlas_1 format but (1D/file*num_saa in Atlas_SAAView folder. 2 NAN columns are reserved for future). VDVxyz – [Legacy Do Not Use] Vista Data Vision distorts this form of export through double-integration. VDVallXallYallZ – [Select ‘View, Absolute Shape’ first] Vista Data Vision (export includes non-SAA data) Similar to Atlas_3; 3D/file*num_saa in VDV_SAAView folder. See header of file, and “Info” file for column definitions. Data grouped as X1X2X3…Y1Y2Y3…X1X2X3… Matlab – Cell array of structs. Readable ONLY in Matlab. Figure 7.49: ‘Export Data Settings’ window. December 2014 203 Note: VDVallXallYallZ when ‘View Absolute Shape’ is selected first will NOT contain absolute shape data. It will contain incremental deviation data, which is what VDV expects. o Format Definitions Buttons Clicking this button opens an information window. o Export Clicking this button will open a ‘File Save’ window with a predefined name for the file that can be changed by the user. The file will be similarly named: “SAAF_51256_20_def_filt_allXallYallZ.dat” in folder (for this file) VDV_SAAView. Save Image o A ‘File Save’ window opens allowing the user to save a “.png” file in the project folder. 7.3.3.2 Settings Menu Figure 7.50: ‘FilterSAA’ and ‘FilterSensors’ have been turned ON (Project: boston_uk_tides_pz). 204 Filter SAA o Selecting or un-selecting this option applies or un-applies filtering to the SAA. When ‘GraphAll’ is clicked in either ‘Filtered View’ or ‘UnFiltered View’ the default for this graph is UnFiltered. Therefore if filtering is desired on the SAA, then it must be turned on. Filter Sensor o Selecting or un-selecting this option applies or un-applies filtering to the non-SAA sensors. When ‘GraphAll’ is clicked in either ‘Filtered View’ or ‘UnFiltered View’ the default for this graph is UnFiltered. Therefore if filtering is desired on the non-SAA sensors, then it must be turned on. December 2014 SAA Software 7.3.3.3 View Menu Figure 7.51: ‘Logarithmic Time’ and ‘Highlights’ ON (Project: boston_uk_tides_pz). Highlighting On / Off o Turning the highlighting feature on highlights points on the SAA and non-SAA sensors that have been selected on the sliders. Logarithmic Time On / Off o Turns timescale to logarithmic 7.3.3.4 Dashed Lines Hold left-click and move either line to desired time, right-click and select ‘Time Subset’ to view the subset of time. To restore graph to original time expanse, right-click and select ‘Restore All Times’. Figure 7.52: Preparing for a ‘Time Subset’: turn Y and PZ off, set SAA to single and select the time frame (Project: boston_uk_tides_pz). December 2014 205 Figure 7.53: The view after turning ‘Time Subset’ on (Project: boston_uk_tides_pz). While in ‘Time Subset’ the SAA number can be changed and other settings can be changed without losing the subset. It would be useful to turn on all sensors that were on the same location instead of all sensors on at once. 7.3.3.5 Type Radio Buttons To add or remove sensors from graph, select or deselect radio buttons. 7.3.3.6 From Drop-Down Menu Select the sensor number start with. 7.3.3.7 Skip Drop-Down Menu Will skip every nth sensor. 7.3.3.8 To Drop-Down Menu Select the sensor number to end with. 7.3.3.9 Single Radio Button If selected, only the selected sensors will show. 206 December 2014 SAA Software Figure 7.54: A single SAA is showing (Project: boston_uk_tides_pz). Figure 7.55: All SAAs are showing (Project: boston_uk_tides_pz). 7.3.3.10 Hilite Sliders For SAAs move slider to highlight an SAA. For non-SAAs: o Move the slider to highlight a non-SAA sensor o Right-Click Slider: PZ Relative Off – Default relative to first reading, select this to turn off. Cancel 7.3.3.11 Zoom Sliders Slide to vertically zoom in on sensors individually. As the Zoom slider moves the associated scale on the left of the graph changes relative to the zoom. December 2014 207 Figure 7.56: Notice the ‘Zoom’ in comparison to the scale (Project: boston_uk_tides_pz). 7.3.3.12 Total Display Gives the total number of sensors available. X Graph & Y Graph Figure 7.57: X Graph and Y Graph (Project: large_shear). 208 December 2014 SAA Software Figure 7.58: X graph only for horizontal SAAs (Project: horiz_pz_epc). Holding the left-click the user can drag the “--” lines where desired. Right clicking the “--” lines gives the following menu options: 7.3.4.1 Relative to 1st Vertex Sets the relative vertex to the first vertex. This is the default. 7.3.4.2 Relative to Selected Vertex Selecting this menu item a red “--” line appears at the bottom of the graphs, drag the red line to the desired Z vertex for all the graphs to be relative to. 7.3.4.3 Place User Line Places a line and label (U1, U2 … Un) wherever the “-- ” line is when the menu item is selected. Right click the black user line to get this menu: o Edit User Line Name Be careful using this feature, the name is between the two graphs and can be difficult to read. o Delete User Line o Delete All User Lines 7.3.4.4 Delete All User Lines Selecting this menu item will delete all user lines added. December 2014 209 7.3.4.5 Select Vertex 1 / Vertex 2 Selecting either of these menu items result in the window seen in Figure 7.59. Choose a vertex (0 starts at the reference end of the graph) to compare a second vertex to. All graphs will then reflect the two vertices for comparison. Figure 7.59: ‘Vertex Selection’ window. Figure 7.60: Vertex 1 = 30 and Vertex 2 = 40. Notice the two colors on the XY graph (Project: large_shear). Figure 7.61: Vertex 1 = 1 and Vertex 2 = 24 (Project: horiz_pz_epc). 210 December 2014 SAA Software Variable T Graph Holding the left-click the user can drag the “--” lines where desired. Right clicking the “--” lines gives the following menu options: 7.3.5.1 Select Time Subset After sliding the left and right “--” lines to create a desired time block, select this menu item to have the time block reflected in the other graphs. Figure 7.62: A time subset was selected in the Variable T graph and then reflected in all other graphs (Project: large_shear). Figure 7.63: A time subset was selected in the Variable T graph and then reflected in the other graph (Project: horiz_pz_epc). December 2014 211 7.3.5.2 Selected Times Only After sliding the left and right “--” lines to two desired periods of times, select this menu item to have the two periods of times only reflected in the other graphs. Figure 7.64: Selected times in Variable T graph are displayed in all other graphs. Only two points can be selected at one time (Project: large_shear). Figure 7.65: Selected times in Variable T graph are displayed in the other graph. Only two points can be selected at one time (Project: horiz_pz_epc). 7.3.5.3 Relative to 1st Selected Time After sliding the left “--” line to the desired period of time, select this menu item to have all the graphs ignore the time period before the selected time period. It sets a start point. 7.3.5.4 Restore All Times Resets all graphs to the default view. 212 December 2014 SAA Software A. SAACR Utilties Data are acquired in a CS Data Logger from one or more SAAs. At some point files are obtained from the CS Data Logger, holding frames of raw data. It could be hours, weeks, or months of data. Raw data is meaningless without being calibrated into engineering units, using Measurand “Calibration” files and 3D algorithms which is what SAACR_raw2data (Section 5) does. There are times when data needs to be manipulated in a way that is not directly provided by SAACR_raw2data. The following utilities provide a wide range of ways to manipulate data files by joining, separating or matching. A.1 SAACR_raw2raw_concat Used to concatenate multiple “*.dat” raw data files, acquired from one or more SAAs or non-SAA sensors attached to a Campbell Scientific Data Logger. This is done so the files can be viewed or exported as one single file for conversion by SAACR_raw2data. Note: An alternative to using SAACR_raw2raw_concat before conversion is to use SAACR_cart2cart after conversion. SAACR_raw2raw_concat can be used to consolidate various raw data files from the same CS Data Logger, so long as the files are from the same CS Data Logger with the same setup of sensors attached. The frames are concatenated column-wise from the data tables and arranged to be in time-sequence with any duplicate times removed. To use raw data files from different CS Data Loggers it will be necessary to manually edit one of the files to have the same header as the other file. Note: SAACR_raw2raw_concat must be run as many times as there are types of sensors attached to the CS Data Logger (one time per each SAA, piezometer, earth pressure cell, or strain gauge). Sensor types cannot be mixed. A.1.1 Preceding / Alternate Steps SAACR_raw2raw_concat is used after two or more files of raw data have been acquired from a CS Data Logger and have not been concatenated by Campbell Scientific LoggerNet software. This can happen if files were collected by different people, different methods, etc. This application can be more convenient than editing the files manually to create one file. A.1.2 The process In this example, “SAA1” files from ‘C:\Measurand Inc\SAA3D\logger_files\example_t1_2epc’ and ‘C:\Measurand Inc\SAA3D\logger_files\example_t2_2epc’ will be concatenated. The process is identical for “SAA2” files and for EPC and PZ3 data files. December 2014 213 Figure A- 1: The files used in this example. Figure A- 2: A view of the raw data in the first file used in this example. 214 December 2014 SAA Software Figure A- 3: A view of the raw data in the second file used in this example. 4. 1. Start SAACR_raw2raw_concat (Figure A- 4). 2. Click the first ‘Browse’ button on the top left of the window. 3. Open the first file. Repeat for the next file under the first. Note: Hovering the mouse over most of the controls will cause a definition of the control to appear. 5. When all files are selected click the ‘Concatenate’ button. December 2014 215 Figure A- 4: SAACR_raw2raw_concat ‘Initial’ window. Two SAA1 raw data files have been chosen. If SAA2 is present its files must be handled in a subsequent concatenation. Any number of files may be selected (up to the number of available lines). Concatenated files can be further concatenated any number of times which is done for larger number of files. Ensure that files are of the same type and that the setup has not changed. In this case the “setup” is represented by “2pec” in the filenames. Once the process has started the files are put together into a single file, in time-sequence, with any duplicate frames made single. Record numbers are preserved but not used by any subsequent Measurand utilities or applications. Figure A- 5: An example output file. 216 December 2014 SAA Software A “Time vs. Frame number” graph will appear once the concatenation is complete. The time relationship is shown before and after sorting by the program. In this case the two files were selected in order of increasing time, so no sorting occurred. It can be seen that the time-base was not regular for very early data. This happens frequently during “startup” of a site, when the CS Data Logger is turned on and off a few times. Figure A- 6: A view of the ‘Time vs. Frame number’ graph if the same example files had been selected in opposite order. As seen in Figure A- 7, the first graph is very different from the second unlike in Figure A- 6. This is what happens when the two files are selected in opposite order. Figure A- 7: A view of the ‘Time vs. Frame number’ graph for this example. Now the files are concatenated and depending on the context, the next step should be: December 2014 217 Concatenation of other data types present (in this example there are PZ, EPC and SG sensors present). Each type must be concatenated in turn. All concatenated types should be kept together in the same folder for subsequent conversion. Conversion of the concatenated raw data using SAACR_raw2data (Section 5). If other raw data are available from the same CS Data Logger with the same setup, the concatenated raw data might be further concatenated with other raw data. A.2 SAACR_cart2cart Used to concatenate, in time, multiple files of converted SAA Cartesian (x, y, z) data so they can be viewed or exported as one single file. The “Cartesian” files will have been converted from raw data files by SAACR_raw2data (Section 5) and must be of type “multi_saa_allcart.mat”. To concatenate non-SAA files use SAACR_cart2cart_matchup (Appendix A.3). Note: SAACR_cart2cart only operates on SAA data (files of type “multi_saa_allcart.mat”) and not on non-SAA files such as PZ, EPC and SG files. A.2.1 Preceding / Alternate Steps Before SAACR_cart2cart can be used, two or more SAA raw data files from a Campbell Scientific Data Logger would have been acquired and converted to Cartesian data by SAACR_raw2data. This utility is used to put two or more “multi_saa_allcart.mat” cartesian files together into one single file, sorted to be in time-sequence with any duplicate times removed. An alternate path to the same end would use SAACR_raw2raw_concat (Appendix A.1) to concatenate the raw data files to make a single raw data file and then convert it with SAACR_raw2data (Section 5). A.2.2 218 The Process 1. Start SAACR_cart2cart (Figure A- 8). 2. Click the first ‘Browse’ button on the top left of the window. 3. Open the first file. 4. Repeat for the next file under the first. December 2014 SAA Software Figure A- 8: SAACR_cart2cart ‘Initial’ window. Choose the “multi_saa_allcart.mat” files that need to be concatenated. Any number of files may be selected (up to the number of available lines). Concatenated files can be further concatenated any number of times which is done for larger number of files. Also, the files do not need to be in order as the utility will sort the times. 5. When all files are selected click the ’Concatenate’ button. 6. Place the resulting file in a folder. 7. It is OK, and recommended, to rename the file distinctively. Figure A- 9: The resulting file to be saved. At the end of the concatenating process a prompt to name a “*.txt” file containing an ASCII version of the concatenated “*.mat” file will appear. The file will have the default format used during conversions with SAACR_raw2data. Use SAAView to view the newly concatenated file. Use “Open Cr Logger File” and select the concatenated file. December 2014 219 Note: SAACR_cart2cart can concatenate files that have already been concatenated once. The “multi_saa_concat.mat” file will have to be renamed to “multi_saa_allcart.mat” so the application will treat it properly. A.3 SAACR_cart2cart_matchup Used to concatenate multiple unmatched files of converted SAA or non-SAA Cartesian (x, y, z, pressure, etc.) data, so they can be viewed or exported as one single file per sensor type. The Cartesian files will have been converted from raw data files by SAACR_raw2data (Section 5) and must be of type “multi_saa_allcart.mat” or the various non-SAA types such as “PZ3_data.mat”, “EPC3_data.mat”, etc. This utility is used to concatenate in time two files that have been converted from raw data files by SAACR_raw2data (Section 5). This utility must be used when the data are “unmatched”: something has changed about the setup such as a rearrangement of sensors, added sensors, decommissioned sensors, etc. This process may be repeated using already concatenated files with the objective being to get one single set of files to view and export. This utility may also be used on matched data but is limited to concatenating only two files at a time. Note: SAACR_cart2cart_matchup operates on (only two sets of) matched or unmatched SAA and non-SAA data and requires use of a “matchup.txt” file. SAACR_cart2cart (Appendix A.2) operates only on matched SAA data but does not require the extra file and can concatenate more than two files at a time. A.3.1 Preceding / Alternate Steps Before the utility is used two or more SAA raw data files from a Campbell Scientific Data Logger would have been acquired and converted to Cartesian data by SAACR_raw2data (Section 5). The utility is used to put two or more “multi_saa_allcart.mat” Cartesian files together into one single file, sorted to be in time-sequence with any duplicate time removed. At the same time it combines all “non-SAA sensor” files, one per sensor type. The utility operates on unmatched files. “Unmatched” means that they come from the same CS Data Logger but after a change such as adding additional sensors or changing the order of sensors. In this example four raw data files that include two different setups will be concatenated / converted / concatenated. The four project folders are shown in Figure A- 10. The “*2epc” and “*3epc” entries indicate that two of the folders contain earth pressure cell (EPC) data from two sensors and two folders contain data from 3 EPC sensors. The “T1…T4” entries indicate that data are from four different time spans. 220 December 2014 SAA Software Figure A- 10: The four folders used in this example. The four folders in Figure A- 10 (and some more concatenated ones) are installed in ‘C:\Measurand Inc\SAA3D\logger_files\’ when SAACR_raw2data is installed and may be used to practice the steps shown throughout the manual. There are also some example “site.txt” and “matchup.txt” files installed in the same place. Figure A- 11: The five files that are in each project folder. A.3.2 The Process To put all four folders into one single folder containing single Cartesian files, one per sensor types: 1. Use SAACR_raw2raw_concat (Appendix A.1) to concatenate the “t1” and “t2” raw data into single “t12” raw data files, and “t3” and “t4” into another single raw data file “t34”. December 2014 221 Figure A- 12: The before and after folders for this example. The concatenated raw data have been placed in two new folders with “t12” and “t34” in the folder names. All the filenames end in “_concat”, except for the “project_info.dat” file which is copied in, unchanged from one of the original folders. However, if the SAA setup has changed, be sure that the correct “project_info” file (there will be two different ones) stays with the SAA setup it describes. Figure A- 13: The files in “*t12*” and “*t34*” folders. 2. Use SAACR_raw2data (Section 5) to convert “t12” and “t34” raw data files into “t12cart” and “t34cart” data files, using different “Site” file for each (for information in “Site” files, see SAACR_raw2data Section 5.8). The “Site” file directs the conversion of non-SAA sensors (finds “Calibration” files, selects units, etc.). 222 December 2014 SAA Software Figure A- 14: The “t12” and “t34”“Site” files. In this example of “Site” files, the setups vary only in the presence of a third EPC in the “t34” set. Therefore, the “Site” files vary only in the inclusion of calibration data for epc3_03 in the “t34” “Site” file and a declaration of “num: 3” instead of “num: 2”. Also, there must be an additional “non_saa_coeffs” file for the third EPC present. It can be found in ‘C:\Measurand Inc\SAARecorder\calibrations\non_saa_coeffs’ and “Site” files can be found in ‘C:\Measurand Inc\SAARecorder\calibrations\site’. SAACR_raw2data is used twice in this example, once for each folder of raw files (t12raw and t34raw) to produce t12cart and t34cart folders containing all converted data. The files for “t12” are shown in Figure A- 15, note that the “Site” file is specific to a two-EPC setup where it should be a three-EPC for “t34”. During the conversion be sure to select the appropriate “vertical / horizontal” and “reference end” settings for the SAAs. December 2014 223 Figure A- 15: The SAACR_raw2data start window with “t12” raw files and a “Site” file for two-EPCs. Figure A- 16: The SAACR_raw2data ‘Start’ window with “t34” raw files and a “Site” file for three-EPCs. After the conversion by SAACR_raw2data, the “t12” and “t34” folder contents will look like Figure A17. The “multi_saa_allcart.mat” files hold data from both SAAs. The “EPC3_data.mat” and “PZ3_data.mat” files hold data from all the EPCs and PZs respectively. The individual setup-specific “Site” files have guided the utility through converting the 2-EPC and 3EPC setups. Our example files “t12” and “t34” are now ready to be concatenated into a unified set “t1234”. Figure A- 17: The “t12” and “t34” files after conversion. 3. Form and place a “matchup.txt” file in the most recent folder (“t34cart”). Place a “matchup.txt” file in the most recent Cartesian folder to be concatenated using SAACR_cart2cart_matchup. In this example it will be the “t34cart” folder. The “Matchup” file must 224 December 2014 SAA Software contain the rules for creating a final data set that has an equal number of columns (one column per sensor). For concatenation to work “sensor1” must have as many columns as “sensor2”. In this example (see Figure A- 18), NaN is used to represent the “missing” EPC sensor in earlier “sensors1” (“t12”) data, to produce a total of three columns: 1, 2, Nan. “sensors2” has three full columns (1:3). An annotated “Matchup” file example is included in the installed examples. Optionally, “Matchup” entries may be included for other sensors. Entries have been made for the pz3 sensors present, but are not necessary because their setup has been changed. Figure A- 18: Excerpt from “matchup.txt” placed in “t34” Cartesian folder, all lines starting with “//” are comments. 4. Use SAACR_cart2cart_matchup to form single “t1234cart” files in the correct time-sequence, and allowing for unmatched data. Start SAACR_cart2cart_matchup and browse for the two Cartesian data folders “t12cart” and “t34cart”. Any file in the folder can be selected and the folders can be selected in any order. The utility will rearrange their order from oldest to most recent during concatenation. Once the files have been selected click on the ‘Concatenate’ button. Figure A- 19: Two files selected representing the two folders “t12cart” and “t34cart”. December 2014 225 5. If the setup remains the same after the concatenation, and the now-matched data are placed in an “archive” folder, SAACR_raw2data may be used to keep building the now-matched data set. When concatenation is complete the utility will create an “archive” subfolder within the most-recent cart folder (“t34cart” in this example) and request to save the concatenated set in the “archive” folder, sensor type by sensor type (see Figure A- 20). Figure A- 20: The three files created by the utility for this example. The data in the “archive” folder will always be concatenated into the full data set whenever a conversion is done, so the “archive” folder and contents must always be present in any subsequent conversions. As new raw data are placed in “t34cart”, and SAACR_raw2data is called, SAACR_raw2data will convert any raw data that have not previously been converted and will concatenate all Cartesian data in “t34cart” along with the “t34\archive” data to make a new converted Cartesian set. Optionally, after SAACR_cart2cart_matchup is used, the “archive” folder that is holding the final concatenated file could be moved to a new folder (“t1234”) and used as the new project folder once renamed. A.4 SAACR_cart2manycart Used to break a single “multi_saa_allcart.mat” file holding data from multiple SAAs into separate files each holding data from one of the SAAs. It operates on converted Cartesian data produced by SAACR_raw2data (Section 5). A.4.1 Preceding / Alternate Steps This utility is used after files of raw data have been acquired from a CS Data Logger and converted to Cartesian data (by SAACR_raw2data) when the files are not directly compatible and therefore cannot be concatenated. Incompatibility can result from a change in the CS Data Logger setup such as adding an SAA or changing an SAA. Individual SAA files produced by SAACR_cart2manycart can be concatenated on an individual basis. 226 December 2014 SAA Software A.4.2 The Process 1. Start the utility and select a file of type “multi_saa_allcart.mat” containing data from multiple SAAs. Note: This utility will NOT work on non-SAA sensors (“EPC3_data.mat” and “PZ3_data.mat” in this example). 2. An ‘Open File’ window will display where the file to be separated is selected. Figure A- 21: The ‘Startup’ ‘Open File’ window. 3. A notice will appear (see Figure A- 22) describing the next step. 4. The next step requests the naming / saving of a “Base” filename for auto numbering with serial numbers. Figure A- 22: The pop-up window explaining the next step. December 2014 227 Note: Existing files with the same “Base” name will be over-written without warning! 5. Select ‘Yes’ to continue, a base name will appear bearing the serial number of the first SAA. The name can be modified if desired, but it is highly desirable to include the serial number. Figure A- 23: The default filename for the base file with the serial number of the first SAA. Figure A- 24: The ‘Process Complete’ window stating the process is complete. The utility will produce as many files as there are SAAs. In this example there were two SAAs with serial numbers 50013 and 50021. 228 December 2014 SAA Software Figure A- 25: The resulting files from the utility. December 2014 229 B. SAACR_DataChecker The SAACR_DataChecker application is used to view and filter raw SAA data that has been recorded with a Campbell Scientific Data Logger. It provides color-coded graphs of the SAA data vs. time, which allows the user to verify the dataset, and see where any data anomalies might have occurred during recording. Filtering functions are also available to select which samples to keep or remove from the current dataset. B.1 Opening Raw Data Files Click on the ‘Open Data File(s)’ button and select the CS Data Logger files to view. The CS Data Logger files should have a “*.dat” filename extension, and should have a name similar to “CR1000_SAA1_DATA.dat”, “CR1000_SAA2_DATA.dat”, etc. Several “*.dat” files can be open simultaneously, although all of the files open should have been recorded from the same CS Data Logger at the same time; i.e. all of the files should correspond to SAAs that are part of the same installation. Figure B- 1: The ‘Initial’ SAACR_DataChecker window. Click on the ‘Open Data Files’ button to select one or more CS Data Logger files to view. Once the “*.dat” files are opened, ensure that one or more of the ‘View X-axis Data’, ‘View Y-axis Data’, or ‘View Z-axis Data’ checkboxes are checked, depending on which sensor data is to be viewed. A colored representation of the CS Data Logger data, similar to that shown in Figure B- 2, should be visible. The ‘Differential’ checkbox can be found at the top of the screen between the ‘Help’ button and the ‘View X-axis Data’ checkbox. When the ‘Differential’ checkbox is checked, the graph colors are used to indicate the change in sensor output relative to the first sensor output included in the time range of samples. When the user clicks on the ‘Differential’ checkbox to check it, a popup window prompts them to confirm a “Maximum Range of Differential Data to Plot”. The default value is 100 counts. The colors assigned to the data points in differential mode are based on this maximum value, i.e. any change in output of a sensor beyond +/- (maximum value) results in the color of that data point being black. Any differential change within +/- (maximum value) applies a color based on the graph color key shown to the right of the graph. 230 December 2014 SAA Software Figure B- 2: Screen capture of SAACR_DataChecker after two data logger “*.dat” files have been opened. Depending on the number of samples and the available screen width, the CS Data Logger samples might be separated by dotted vertical lines. Colors are assigned to each CS Data Logger sample according to the legend at the far right of the window. If the SAA has a total number of segments which is not equal to a multiple of 8, then the bottom of the color graph shown in Figure B- 2 could have some black horizontal stripes (see for example Figure B- 3). This is because an SAA contains one microprocessor for each grouping of 8 segments, so if the SAA has a number of segments which is not a multiple of 8, then the internal microprocessor at the far end of the SAA will have some “unconnected” segments. These “unconnected” segments typically output sensor count values that are less than 10000 counts, hence the black stripes at the bottom of the graph. Figure B- 3: Screen capture of a vertical SAA with 88 segments. By looking at the colored graph, the user can quickly tell if there were sudden changes in sensor outputs recorded by the CS Data Logger, or if there are portions of the SAA that are aligned differently relative to one another. December 2014 231 For example, in Figure B- 2, the SAA was still on its reel for the duration of the CS Data Logger recording, so the sensor segments were all aligned in different directions, as was evidenced by the number of different bands of color. In Figure B- 3, the recording was performed with the SAA aligned vertically in a hole, so the X and Y sensor outputs were near zero G (approximately 31000 to 33000 counts) and the Z sensor outputs were all near negative one G (approximately 18000 to 20000 counts). In Figure B- 4, there are a couple of time periods in which the SAA was unresponsive, so that the sensor output values in the “*.dat” file were set to zero. This caused vertical black bands to appear in the color graph for that file. Figure B- 4: Graph of data containing some periods of time in which samples were missed (indicated by vertical black bands). If a CS Data Logger cannot communicate with an SAA for some reason, the sample output data in the CS Data Logger’s “*.dat” output file contains values of zero for each SAA sensor. Note: If a CS Data Logger cannot communicate with an SAA for some reason, the sample output data in the CS Data Logger’s “*.dat” output file contains values of zero for each SAA sensor. B.2 Viewing Individual Raw Data Samples Using the SAACR_DataChecker application, it is possible to view the actual sample text for the individual SAA data samples that were recorded by the CS Data Logger. This can be done at any time, by left-clicking the mouse on the color graph (see Figure B- 5). The position of the mouse cursor determines which sample gets displayed on the window. In order to “zoom-in” on a region of interest in the color graph uncheck the ‘View Entire File’ checkbox, and then select ‘Start’ and ‘End’ times to control which parts of the dataset are visible in the color graph. 232 December 2014 SAA Software Figure B- 5: The text of a raw data sample can be viewed, simply by left-clicking the mouse on the region of interest on the color graph B.3 Filtering Data Files To remove some of the data from the dataset that was opened in SAACR_DataChecker: 1. Click on the ‘Filter’ button in the ‘Main Viewing’ window. The window shown in Figure B-6 will then appear. 2. To apply the same filtering settings to all SAA data files that are currently opened, check the ‘Apply filtering changes to all SAA / files’ checkbox at the top of the ‘Filter Data’ window. 3. Click the ‘Remove Bad / Invalid Data’ button to remove any data samples that contain raw accelerometer outputs that are less than 10000 counts or greater than 60000 counts. No accelerometer in an SAA should output values outside the range of 10000 counts to 60000 counts under normal operation. If this does happen, it is usually an indication that the SAA could not be reached for a given sample (i.e. a communications problem) or an indication that some damage had occurred to the SAA. 4. Click the ‘Choose Selected Data’ button to manually select which samples to include or exclude from the dataset. Figure B- 6: ‘Filter Data’ window providing choices for how to filter raw sample data from the CS Data Logger files. December 2014 233 B.4 Saving Data Files When filtering one or more data files, the data files can be saved using the ‘Save Data File(s)’ button on the ‘Main Graphing’ window. Backup files (with file extensions of “*.bak”, “*.bak2”, “*.bak3”, etc.) will be generated each time the ‘Save Data File(s)’ button is clicked. 234 December 2014 SAA Software C. Using Network Data Concentrators Note: All new SAA systems are intended for use with a PC containing one or more RS-485 serial ports. This section is included for older SAA systems that used separate data concentrators for each SAA that were connected to the PC with an Ethernet interface. C.1 Configuring Network Addresses Figure C- 1: Window for modifying the properties of a network connection. When using the SAA software to collect SAA data over a network connection, it is necessary to ensure that the PC is using a valid network IP address. The network Data Concentrators that are shipped with Measurand's SAA systems have default IP addresses of the form 10.0.0.251, 10.0.0.250, 10.0.0.249, etc. If these defaults are left unchanged, then it is necessary to make sure that the PC has a network IP address of the form 10.0.0.x, where x>=1 and x<240. IP addresses can be modified for the PC by going to: 1. 'Control Panel' and clicking on the 'Network Connections' icon. December 2014 235 2. Select the appropriate network connection from the choices provided (this will vary depending on PC system configuration) and right-click on it to bring up a pop-up menu. 3. From the pop-up menu, select the 'Properties' item. This brings up a window similar to that shown in Figure C- 1. 4. Select 'Internet Protocol (TCP/IP)' and then click the 'Properties' button. This will bring up a window similar to that shown in Figure C- 2. 5. Enter in an address of the form 10.0.0.x where x>=1 and x<240, in the 'IP address' field. Use 255.255.255.0 in the 'Subnet mask' field. The other fields for gateway and DNS servers can be left blank. 6. Click the 'OK' button in the ‘Internet Protocol (TCP/IP) Properties’ window. 7. Click the 'OK' button in the ‘Local Area Connection Properties’ window. Note: It may be necessary to modify the TCP/IP properties for the PC's network connection to the SAA data concentrators, so that the PC has a static IP address of the form 10.0.0.x where x>=1 and x<240. Figure C- 2: Enter in an IP address of the form 10.0.0.x where x>=1 and x<240. 236 December 2014 SAA Software Note: The subnet mask should be 255.255.255.0. The other fields can be left blank. C.2 Connecting Hardware The data concentrators are used to collect the SAA data and relay it over Ethernet connections to a PC running SAARecorder application. Each data concentrator is housed in a plastic enclosure, with ports for power, network connection, and connection to an SAA. Each SAA is connected to a data concentrator by means of a 10-pin cable. This cable should only be connected or disconnected when the data concentrator is NOT powered up, i.e. when its power supply is unplugged from the wall. The Ethernet cable from each SAA should be connected to the network hub or switch provided with the installation. An Ethernet cable should also be connected from the PC to the same network hub or switch. C.2.1 Recommended Hardware Connection Procedure The recommended startup procedure for connecting the SAA hardware is as follows: 1. Connect the data cable from each SAA to the 10-pin port of a data concentrator. It does not matter which SAA is connected to which data concentrator - the SAA and data concentrators are automatically detected by SAARecorder application. 2. Connect the Ethernet cables from each data concentrator to the multi-port network hub / switch. 3. Connect an Ethernet cable from the PC to the same multi-port network hub / switch. 4. Apply power to the hub / switch using the wall-mount adapter provided. If just a single SAA is being used with a data concentrator, follow the same instructions, except the hub is not necessary. 5. An Ethernet crossover cable can extend directly from the data concentrator to the PC. Measurand also sells single SAAs with four to eight segments and attached RS-232 to RS-485 converters that terminate in a DB9 serial connector and can be connected directly to PC serial ports. These SAAs do not require a data concentrator. 6. If a serial-to-USB adapter is to be used, please contact Measurand (Appendix K) for recommended devices. 7. Some serial-to-USB adapters will not operate at high speed, or will not work with all hardware. Steps 8 to 11 apply for SAAs connected to data concentrators only: 8. Apply power to each of the data concentrators by plugging in their corresponding wall-mount adapters. 9. Wait approximately 30 seconds for each of the data concentrators to boot up and establish network connections. 10. Perform network testing (optional - see Appendix C.3.1 below). December 2014 237 11. Start SAARecorder application to collect data. Note: When powering down a data concentrator, it is necessary to wait a minimum of 20 seconds before re-applying power. C.2.2 Recommended Hardware Shutdown Procedure The recommended shutdown procedure for disconnecting the SAA hardware is as follows: 1. Close SAARecorder application (if it is running). 2. Unplug the wall-mount adapters for each of the data concentrators (if used) or unplug the power cable from the SAA's power injection input (if used). 3. Unplug Ethernet cables from the multi-port network hub / switch (if used). 4. Unplug each SAA data cable from the 10-pin data concentrator ports (if used), or unplug each SAA's DB9 connector from its corresponding PC serial port. C.3 Testing Hardware Connections The following instructions for testing apply for SAAs connected to data concentrators only. C.3.1 Network Testing In order to verify that the network is configured properly for acquiring SAA data, it is often useful to do a simple "ping" test to verify that data can be sent and retrieved from all addresses on the network. For example, to find out if there is a valid network connection to the data concentrator with IP address 10.0.0.251, click the ‘Start | Run’ option on the PC and type "ping 10.0.0.251" in the ‘Run’ dialog window. If the network is configured properly, something similar to that shown in Figure C- 3 should be seen. Figure C- 3: Example of a successful ping test. 238 December 2014 SAA Software If an Ethernet cable is unplugged or damaged, or if the IP address of the data concentrator was incorrect, a window similar to that shown in Figure C- 4 would be displayed instead. If the PC is not configured to have an IP address of the correct form (i.e. 10.0.0.x where x>=1 and x<240) then a window similar to that shown in Figure C- 5 should be seen. Note: This error could also occur if the data concentrator IP address was invalid, or if one or more Ethernet cables were damaged or not connected. Figure C- 4: Example of a failed ping test - in this case the data concentrator was not powered up, and could not be reached. Figure C- 5: Another example of a failed ping test - in this case the PC did not have a network IP address of the form 10.0.0.x, where x>=1 and x<240. December 2014 239 D. Maximum Achievable Clock and Data Rates The following tables indicate the data rates attainable with two, four, and six 24 foot long research SAARs operating at the same time on an HP Pavilion PC (A1710n) with a dual-core processor (AMD Athlon 64 X2, 4200+, 2.20 GHz,), 896 MB RAM, and a GeForce 6150 LE, 512 MB graphics card. For data rates attainable with other PC and / or SAA configurations, please contact Measurand (Appendix K). D.1 Two SAAs in 3-D Mode Baud Rate (Kbps) Hardware Triggered (Hz) Addressing Mode (Hz) 38.4 (default) 45 40 57.6 78 52 115.2 135 75 230.4 160 94 Baud Rate (Kbps) Hardware Triggered (Hz) Addressing Mode (Hz) 38.4 (default) 45 49 57.6 78 67 115.2 135 110 230.4 200 155 Baud Rate (Kbps) Hardware Triggered (Hz) Addressing Mode (Hz) 38.4 (default) 45 33 57.6 75 42 115.2 90 54 230.4 90 64 D.2 Two SAAs in 2-D Mode D.3 Four SAAs in 3-D Mode 240 December 2014 SAA Software D.4 Four SAAs in 2-D Mode Baud Rate (Kbps) Hardware Triggered (Hz) Addressing Mode (Hz) 38.4 (default) 45 47 57.6 78 64 115.2 135 100 230.4 200 135 Baud Rate (Kbps) Hardware Triggered (Hz) Addressing Mode (Hz) 38.4 (default) 40 28.5 57.6 60 33 115.2 60 42 230.4 60 47 Baud Rate (Kbps) Hardware Triggered (Hz) Addressing Mode (Hz) 38.4 (default) 45 43 57.6 75 58 115.2 130 87 230.4 200 113 D.5 Six SAAs in 3-D Mode D.6 Six SAAs in 2-D Mode December 2014 241 E. Using a PC and SAARecorder for Data Logging Measuring Displacements using Periodic Connections to an SAA using SAARecorder When it is not necessary to have continuous measurements from SAA, periodic measurements can be made to determine relative displacements from one epoch to the next. Typically this approach involves: a. Collecting data at a starting epoch giving a reference shape for the SAA (to which all subsequent SAA shapes will be compared), and b. Collecting data at subsequent epochs to see the progressive movement of the SAA. This procedure is illustrated in Figure E- 1 where the reference shape for an SAA is taken at time T0 and subsequent measurements are taken at times T1, T2 and T3. Figure E- 1: Determining Relative Shape of an SAA using Periodic Measurements. When taking periodic measurements, it is recommended to record raw data from an SAA at each epoch and then calculate the reference shape or displacements. Raw data can always be manipulated to allow for different processing settings in post processing (E.g., Averaging, SAA Reference, and Modelling Mode). If reference shapes or displacements are exported as coordinate data, the raw data cannot be recovered if an error was made in the processing settings. 242 December 2014 SAA Software E.1 Choosing an Averaging Setting Increasing the sample size from which SAA solutions are determined reduces the amount of noise in the solutions. Figure E- 2 illustrates the % change in noise in SAA solutions relative to a 1000 sample benchmark. Figure E- 2: Effect of sampling size on noise. E.2 Setting up a File and Folder System for Storing Raw Data Before collecting raw data and creating reference shapes, it is important to have established a naming convention and folder system to organize the data that will be collected over the course of the measurement campaign. File names should be informative and include such information as measurement date, file type, operator initials and other pertinent information. E.3 Recording Raw Data Raw data can be recorded by selecting the ‘File| Save raw data file’ option as illustrated in Figure E3. Figure E- 3: Saving a raw data file. The length of the session is shown on the Recording form as illustrated in Figure E- 4. December 2014 243 Figure E- 4: Recording raw data. Once the recording is stopped, a ‘Choose Raw Data Filename’ window opens allowing the user to name and place the new “.rsa” file. This window also offers the user to take a ‘Save Text Snapshot File’ while saving the data by clicking the checkbox provided, see Figure E- 5. Figure E- 5: ‘Choose Raw Data Filename’ window. 244 December 2014 SAA Software F. Connecting using the SAAR Interface Box Measurand's SAAR Interface Box (Figure F-1) is used for large installations of multiple SAAs. Figure F- 1: SAAR Interface Box. The connection box in Figure F- 1 contains 10-pin ports for up to 4 high speed research SAAs. The white serial cables go to two eight port RS-485 cards in the PC. The DB-9 connector on the box uses the following pins: Pin 3 = Record Data. Pin 4 = Clock Input. Pin 5 = Ground. Measurand's SAAR Interface Box uses multiple white serial cables that go to two eight port RS-485 cards that are housed within the PC. Figure F- 2 shows a picture of one of these cards shown outside of the PC. The clock and trigger inputs are TTL-level inputs that can be used to either clock data samples or trigger the collection of a raw data file respectively. More information on using the clock and trigger inputs can be found in 'SAA Setup | Advanced | Hardware Triggering' in Section 6.4.15. The "Power" LED glows when the +12 VDC supply is connected and working properly. The "Record" LED glows whenever the trigger input line goes high. The 10-pin SAA cable(s) should only be connected or disconnected when the SAAR Interface Box is NOT powered up, i.e. when its +12V power supply is unplugged from the wall. Pin 3 of the DB-9 connector on the SAAR Interface Box is the 'Record Data' input, records raw data on the PC when SAARecorder is configured for triggered recording (see ‘SAA Setup | Advanced | Hardware Triggering’ in Section 6.4.15).. When SAARecorder is configured for triggered raw data collection (see Section 6.2 ‘Saving and Exporting Raw Data (File)’) data is saved to a raw data file automatically whenever this line is high and SAARecorder is running. Pin 4 of the same DB-9 connector is the 'Clock Input' line. The rising edge of this line is used to trigger a data sample for all connected SAAs. Measurand recommends a 50% duty cycle for this line or a 5 December 2014 245 ms minimum pulse width, with a typical frequency of about 32 Hz at 38400 bps. The maximum frequency possible for this line is approximately 45 Hz at 38400 bps. Higher data collection rates are possible depending on the baud rate settings used in the application (see Appendix D for details). If SAAR data samples are being triggered with a clock input, SAARecorder must be properly configured for clocked data (see Section 6.4.15, 'SAA Setup | Advanced | Hardware Triggering' for details). Pin 5 of the DB-9 connector is the common or ground line. Figure F- 2: View of the SAAR Interface Box, RS-485 card (shown outside of the PC), SAA cable, and +12 VDC power supply. The RS-485 card used is the 7804 PCI card from SeaLevel Systems Inc (www.sealevel.com). It can be purchased pre-configured through Measurand or from Sealevel directly. If purchased directly from Sealevel, it is necessary to ensure that the card is configured properly for RS-485 mode and that the switches for the pull up and pull down resistors are active. It is also necessary to configure the Oscillator frequency for all 8 ports of each RS-485 card. Please refer to the 7804.pdf document included in SAARecorder installation folder for details. If 8 or fewer RS-485 ports are required, then only one RS-485 card is needed. For this case, the SAAR Interface Box should be wired as shown in Figure F- 3. 246 December 2014 SAA Software Figure F- 3: SAAR Interface Box cable setup for use with just a single (8-port) RS-485 card. The recommended start up procedure for connecting SAARs with the SAAR Interface Box is as follows: 1. Connect the data cable from each SAAR to one of the four 10-pin ports of the SAAR Interface Box. It does not matter which SAAR is connected to which port - the SAARs are automatically detected by SAARecorder application. 2. Apply power to the SAAR Interface Box by plugging in its corresponding +12 VDC power supply. 3. (**optional) Turn on the clock input (if used) to the SAAR Interface Box. 4. Start SAARecorder application to collect data. 5. The box shown in Figure 6.2 will pop-up. Click 'Connect SAA' and the following window, see Figure F- 4 below, will appear. 6. Click the 'SAAR Interface Box' choice under 'Connection to SAA'. Click 'Next' or the ‘Search’ tab. The ‘Search’ tab can be used to automatically detect SAAs on individual COM ports. If it is necessary to manually add certain devices (older SAAs or piezometers for example) then the ‘Devices’ tab should be used to enter in the serial numbers of those devices. The ‘Test’ tab can be used to perform basic connectivity and voltage / current checks of the SAA. By clicking the grey and green button, 'Start with Found SAAs ' that may appear beside the 'Serial Port(s):' box, the application will launch the data collection portion of SAARecorder (GO TO Section 6.1.8) for the detected SAA(s). The ‘Start with Found SAAs’ might not be visible for older SAAs. December 2014 247 Figure F- 4: SAARecorder ‘Connection’ window with the SAAR Interface Box selected. 7. IF there are issues connecting to the SAA(s) GO TO Appendix J or Appendix K (Troubleshooting FAQs & Support (Help)). 8. Otherwise GO TO Section 6.1.6 (Connection Completion). The recommended shutdown procedure for disconnecting SAARs with the SAAR Interface Box is as follows: 1. 2. 3. 4. 248 Close SAARecorder application (if it is running). Clear the record data and clock inputs (if used) to the SAAR Interface Box. Unplug the +12 VDC power supply from the SAAR Interface Box. Unplug each SAAR data cable from the 10-pin SAAR Interface Box ports. December 2014 SAA Software G. Integrating Other Sensors Into the Main CS Logger Program (Advanced) ** Please contact Measurand if assistance in this procedure is needed. The example given below is not exactly how the code looks today, but it is similar. ** When adding additional sensor programming to the ‘Main SAA Program’, conflicts can arise with existing programming. The SAA_Include references COM Ports 1-4. If any of these ports are used for connecting other sensors, then all references to these ports must be commented out of the serial port subroutines in the “SAA_Include” file. Provided is an example program for a logger that reads data from vibrating wire piezometers, vibrating wire earth pressure cells, and SAAs. Note: The SAA-related code in the following example is not the most recent code. This example is meant to give an idea as to how to add other sensors into the ‘Main Program’. Please consult Measurand for assistance when trying to combine measurements from various sensors into a single program. The SAA data is collected over Scan Interval 1 (1 hour) with an AIA averaging level of 1000. The piezometer and earth pressure data is collected at the same interval. '----------------------------------------------------------------------------------------------------------------------------- -'Campbell Scientific CR1000 Datalogger Program for collecting ShapeAccelArray (SAA) Data 'Program Author: Jason Bond, Measurand Inc. (built upon single array program by Murray Simpson) (c) 2008 'Version History: '1.0: Initial internal release '1.1: 'AVERAGING' added to the PROJECT_INFO file '1.2: 'PROGRAM_VERSION_NUM' added to the PROJECT_INFO file 'Program now contains 2 components to prevent editing of critical code by users: i) SAA_Communicator_Vx_x and ii) SAA_Include_Vx_x '1.3 'Pre-sample added to clear sensor values on first read. 'ScreenObs subroutine added to filter sensor values. 'Code added to accomodate partial octets at the end of an SAA '1.4 'Ability to assign SAAs to any COM port added (instead of requiring sequential use) 'Ability to use RS232 port to hook up additional SAAs added '1.5 'SAA now shutdown and repowered after a CRC, COM or range error 'Check for 0 values added to ScreenObs subroutine 'Dim u,v As Long variables had to be moved outside of ScreenObs subroutine to compile. Problem arose after updating OS on CR1000. '1.6 21 Aug 2009: December 2014 249 'ScreenObs subroutine removed. Now looked after in SAA3D 'Range Errors removed from SERIAL_ERRORS_FILE 'Code to accomdodate partial octets removed. Now looked after in SAA3D. '1.7 'Various changes made in an attempt to improve computation speed. VERSION NOT RELEASED and changes not implemented 'in subsequent versions due to anticipation of new high resolution SAAs. Historical significance only. 'a)SetSAAPort added to allow switching of SAA baud 'b)CRC check removed 'c) Temperature averaging removed - just one value read in SAA data. GetSAASample modified to allow this. '1.8 A) Addition of alarm notification through email/text: 'a) input of number of masked segments (from the top) 'b) input of tilt alarm in degrees 'c) input of email notification parameters 'd) addition of storage variable for previous readings 'B) Addition of high resolution SAA data collection capabilities 'a) public HIGH_RES_SAA As boolean added 'b) close, open and flush serial port commands added to shut down sequence when data has failed to be acquired. 'Note: When changing the version number, the Include file reference below must be updated and the VERSION_NUM constant in the include file must be modified '1.9 Jan. 27, 2010: 'uses updated include file: CPU:SAA_Include_V1_9.CR1, corrects bug in collection of high res. data from SAA longer than 8 segments. 'Note: When changing the version number, the Include file reference below must be updated and the VERSION_NUM constant in the include file must be modified '2.3 Uses new include file: CPU:SAA_Include_V2_3.CR1 '2.4 Capable of acquiring voltage, current, and top segment temperature from SAATop devices integrated into the top of SAA. Uses new include file: CPU:SAA_Include_V2_4.CR1 '2.5 Nov. 12, 2010: Added acquisition of logger voltage and temperature for diagnostic purposes '2.6 Nov. 29, 2010: Added code for using SAA232_5 device for combining up to 5 SAAs on a single serial port '2.61 Dec. 7, 2010: Fixed bug in 2.6 for 2nd array data data table '2.62 Dec. 13, 2010: Modified to sample some preliminary samples as fast as possible upon powerup before switching to regular scan interval for samples 250 December 2014 SAA Software '2.63 Mar. 10, 2011: Modified to include array serial numbers in SAA diagnostic files. '2.64 Aug. 10, 2011: Modified to use new include file: CPU:SAA_Include_V2_63.CR1 '2.65 Aug. 11, 2011: Modified to use new include file: CPU:SAA_Include_V2_64.CR1 '2.66 Aug. 25, 2011: Modified to provide an error table for each array connected to the datalogger. '2.67 Sept. 27, 2011: Modified to use new include file: CPU::SAA_Include_V2_66.CR1 '2.68 Oct. 7, 2011: Modifieed to use new include file: CPU::SAA_Include_V2_67.CR1, got rid of unused tilt_alarm stuff '3.00 Oct. 20, 2011: Simplified, cleaned up code, uses new include file: CPU::SAA_Include_V3_00.CR1. '3.01 Dec. 5, 2011: Modified to use new include file: CPU::SAA_Include_V3_01.CR1 '3.02 Dec. 12, 2011: Modified to use new include file: CPU::SAA_Include_V3_02.CR1 '3.03 Mar. 05, 2012: Modified to use new include file: CPU::SAA_Include_V3_03.CR1 'DECLARE USER SPECIFIED CONSTANTS (must be modified by user to match application specifications): '--------------------------------------------------------------------------------------------------------------------------------'>>>>>>>>>>>>>>> START <<<<<<<<<<<<<<< 'Enter the number of preliminary samples to capture Const NUM_PRELIM_SAMPLES = 5 ' Enter the number of SAAs to be monitored: Const NUM_SAAS = 2 ' Enter the number of PZ strings to be monitored (has to be at least 1 even if there are no PZ strings !!!) Const NUMBER_PIEZO_STRINGS = 0 ' Enter the number of total devices (number of SAAs + PZ strings): Const NUM_DEVICES = 2 ' Enter the number of Earth Pressure Cells (EPC) to be monitored: Const NUM_EPCS = 3 ' Enter the number of piezometer (PZ) to be monitored: Const NUM_PZ3S = 12 '>>>>>>>>>>>>>>> START <<<<<<<<<<<<<<< ' Enter the number of raw data samples to average for each measurement: December 2014 251 ' Samples can range from 100-25500 if HIGH_RES_SAA = true; samples are collected at 400 Hz, thus ~64 seconds are required for NUM_TO_AVG = 25500 (NOTE: HIGH_RES_SAA must be false for older SAAs, sernum < 47100) ' If HIGH_RES_SAA=false, then samples are collected more slowly, and NUM_TO_AVG should be set to between 1 and 100 (typically only used for older SAAs (sernum < 47100). Const NUM_TO_AVG = 1000 ' Enter the maximum number of octets (8 segment units) of any single SAA being used (must be at least 1, even if no SAA octets are present): Const MAX_NUM_OCTETS = 15 ' Enter the maximum number of piezometers per string, must be at least 1, even if no piezometers are used Const MAX_NUM_PIEZOS = 1 ' Enter number of octets for each SAA (each SAA must have an entry): Const SAA1_NUM_OCTETS = 15 Const SAA2_NUM_OCTETS = 15 ' Enter number of piezometers for each Measurand piezometer string (if piezometers are used) ' Const PIEZO1_NUM_PIEZOS = 0 ' Enter COM port number for each SAA (each SAA must have an entry) COM1=1, COM2=2, COM3=3, COM4=4 Const SAA1_COM_PORT = 1 Const SAA2_COM_PORT = 2 ' Enter COM port number for each Measurand piezometer string (if piezometers are used) ' Const PIEZO1_COM_PORT = 1 ' Enter SAA232-5 port number for each SAA (each SAA must have an entry) 1-5 if SAA232-5 port is being used, otherwise enter 0 Const SAA1_232_5_PORT = 0 Const SAA2_232_5_PORT = 0 ' Enter SAA232-5 port number for each Measurand piezometer string (if piezometers are used) 'Const PIEZO1_232_5_PORT = 0 ' Input whether or not SAATop is present (0 = not present, 1 = SAATop is present) --> typically present in SAAs built in 2011 or later Const SAA1_SAATOP = 1 Const SAA2_SAATOP = 1 '>>>>>>>>>>>>>>> END <<<<<<<<<<<<<<< '--------------------------------------------------------------------------------------------------------------------------------'END DECLARE USER SPECIFIED CONSTANTS (must be modified by user to match application specifications): Include "CPU:SAA_Include_V3_03.CR1" 252 December 2014 SAA Software 'DECLARE PUBLIC VARIABLES (can be modified by user to match application specifications): '----------------------------------------------------------------------------------------------------------------------------- ---'>>>>>>>>>>>>>>> START <<<<<<<<<<<<<<< 'Earth Pressure Cell Public Variables Public EPC(NUM_EPCS,6) 'Piezometer Public Variables Public PZ3(NUM_PZ3S,6) Public Result Public Power_Save_Flag As Boolean 'add Public ACC, TEMP, and diagnostic variables for each SAA: 'SAA1: Public SAA1_ACC_VALUES(MAX_NUM_OCTETS,NUM_SENSORS_PER_OCTET) As Float Public SAA1_TEMP_VALUES(MAX_NUM_OCTETS) As Float Public SAA1_SAATOP_VOLTAGE As Float Public SAA1_SAATOP_CURRENT As Float Public SAA1_SAATOP_TEMPERATURE As Float 'SAA2: Public SAA2_ACC_VALUES(MAX_NUM_OCTETS,NUM_SENSORS_PER_OCTET) As Float Public SAA2_TEMP_VALUES(MAX_NUM_OCTETS) As Float Public SAA2_SAATOP_VOLTAGE As Float Public SAA2_SAATOP_CURRENT As Float Public SAA2_SAATOP_TEMPERATURE As Float 'preliminary loop count Public PRELIM_COUNT As Float 'Data Tables 'Project Descriptor Info DataTable(PROJECT_INFO,FIRST_SCAN,-1) December 2014 253 Sample(1,PROGRAM_VERSION_NUM,Float) Sample(1,AVERAGING,Long) Sample(1,PROJECT_NAME,String) Sample(1,NUMBER_SAAS,Long) Sample(NUM_SAAS,NUM_OCTETS_INDEX(),Long) Sample(NUM_SAAS*MAX_NUM_OCTETS,SERIAL_NUMS(),Long) EndTable 'Serial Port Errors: DataTable(SERIAL_ERRORS,True,-1) Sample(1,SERIAL_NUMS(1,1),Long) Sample(1,SERIAL_NUMS(2,1),Long) Sample(NUM_DEVICES,NUM_CRC_ERRORS,Long) Sample(NUM_DEVICES,NUM_COM_ERRORS,Long) EndTable 'Logger Diagnostics: DataTable(LOGGER_DIAGNOSTICS,True,-1) Sample(1,LOGGER_VOLTAGE,Float) Sample(1,LOGGER_TEMPERATURE,Float) EndTable 'SAA Data Table Values (each SAA requires a data table): 'SAA1: DataTable(SAA1_DATA,True,-1) Sample(1,SERIAL_NUMS(1,1),Long) Sample(SAA1_NUM_OCTETS*NUM_SENSORS_PER_OCTET,SAA1_ACC_VALUES(),Float) Sample(SAA1_NUM_OCTETS,SAA1_TEMP_VALUES(),Float) EndTable 'SAA2: DataTable(SAA2_DATA,True,-1) Sample(1,SERIAL_NUMS(2,1),Long) Sample(SAA2_NUM_OCTETS*NUM_SENSORS_PER_OCTET,SAA2_ACC_VALUES(),Float) Sample(SAA2_NUM_OCTETS,SAA2_TEMP_VALUES(),Float) 254 December 2014 SAA Software EndTable DataTable (SAA_DIAGNOSTICS,True,-1) Sample(1,SERIAL_NUMS(1,1),Long) Sample(1,SERIAL_NUMS(2,1),Long) Sample(1,SAA1_SAATOP_VOLTAGE,Float) Sample(1,SAA1_SAATOP_CURRENT,Float) Sample(1,SAA1_SAATOP_TEMPERATURE,Float) Sample(1,SAA2_SAATOP_VOLTAGE,Float) Sample(1,SAA2_SAATOP_CURRENT,Float) Sample(1,SAA2_SAATOP_TEMPERATURE,Float) EndTable ' PZ3 Data Table DataTable(PZ3_DATA, True, -1) Sample(NUM_PZ3S*6, PZ3(), IEEE4) EndTable ' EPC Data Table DataTable(EPC_DATA, True, -1) Sample(NUM_EPCS*6, EPC(), IEEE4) EndTable 'SUBROUTINES '------------------------------------------------------------------------------------------------------------------------'*************************************************************************************** ********************************** 'Sub: GetArrayData 'Purpose: gets all of the array data 'Inputs: None '*************************************************************************************** ********************************** Sub GetArrayData() December 2014 255 Scan(1,sec,0,1)'need this dummy scan to auto-allocate data tables 'fill in project info table: CallTable PROJECT_INFO Call GetLoggerDiagnostics() CallTable LOGGER_DIAGNOSTICS 'add calls to each SAA and store data in respective tables: '--------------------------------------------------------'SAA1: If HIGH_RES_SAA Call GetHighResSAAData(SAA1_ACC_VALUES,SAA1_TEMP_VALUES,1) Else Call GetSAAData(SAA1_ACC_VALUES,SAA1_TEMP_VALUES,1) EndIf CallTable SAA1_DATA If SAA1_SAATOP>0 Call GetSAATopData(SAA1_SAATOP_VOLTAGE,SAA1_SAATOP_CURRENT,SAA1_SAATOP_TEMPERATURE,1) EndIf TurnOffSAA232_5(1) 'SAA2: If HIGH_RES_SAA Call GetHighResSAAData(SAA2_ACC_VALUES,SAA2_TEMP_VALUES,2) Else Call GetSAAData(SAA2_ACC_VALUES,SAA2_TEMP_VALUES,2) EndIf CallTable SAA2_DATA If SAA2_SAATOP>0 Call GetSAATopData(SAA2_SAATOP_VOLTAGE,SAA2_SAATOP_CURRENT,SAA2_SAATOP_TEMPERATURE,2) EndIf TurnOffSAA232_5(2) CallTable SAA_DIAGNOSTICS 'record serial errors table: CallTable SERIAL_ERRORS 256 December 2014 SAA Software 'turn off outputting of project descriptor info after first run: FIRST_SCAN = false NextScan EndSub Sub GetVWData() Scan(1,sec,0,1)'need this dummy scan to auto-allocate data tables 'Get Piezometer Data SerialOpen (COM4,38400,4,0,0) AVW200 (Result(),COM4,0,200,PZ3(1,1),1,1,NUM_PZ3S,1400,3500,1,_60Hz,1,0) CallTable PZ3_DATA AVW200 (Result(),COM4,0,200,EPC(1,1),1,13,NUM_EPCS,1400,3500,1,_60Hz,1,0) CallTable EPC_DATA SerialClose(COM4) NextScan EndSub 'DEFINE MAIN PROGRAM: '------------------------------------------------------------------------------------------------------------------------- BeginProg 'setup project descriptors: '--------------------------'>>>>>>>>>>>>>>> START <<<<<<<<<<<<<<< ' Enter the Project Title PROJECT_NAME = "Integration Example" '>>>>>>>>>>>>>>> END <<<<<<<<<<<<<<< December 2014 257 NUMBER_SAAS = NUM_SAAS AVERAGING = NUM_TO_AVG PROGRAM_VERSION_NUM = VERSION_NUM HIGH_RES_SAA = true 'declare the serial numbers (each octet) for each SAA: '--------------------------------------'SAA1 - S/N: 50013 nodes 50013 50019 50070 50083 50206 50225 50315 50347 50402 50413 50416 50438 50451 50515 51358 SERIAL_NUMS(1,1) = 50013 SERIAL_NUMS(1,2) = 50019 SERIAL_NUMS(1,3) = 50070 SERIAL_NUMS(1,4) = 50083 SERIAL_NUMS(1,5) = 50206 SERIAL_NUMS(1,6) = 50225 SERIAL_NUMS(1,7) = 50315 SERIAL_NUMS(1,8) = 50347 SERIAL_NUMS(1,9) = 50402 SERIAL_NUMS(1,10) = 50413 SERIAL_NUMS(1,11) = 50416 SERIAL_NUMS(1,12) = 50438 SERIAL_NUMS(1,13) = 50451 SERIAL_NUMS(1,14) = 50515 SERIAL_NUMS(1,15) = 51358 'SAA2 - S/N: 50021 nodes 50021 50226 50246 50440 50550 50557 50563 50565 50570 50968 50969 50982 50996 50998 50039 SERIAL_NUMS(2,1) = 50021 SERIAL_NUMS(2,2) = 50226 SERIAL_NUMS(2,3) = 50246 SERIAL_NUMS(2,4) = 50440 SERIAL_NUMS(2,5) = 50550 SERIAL_NUMS(2,6) = 50557 SERIAL_NUMS(2,7) = 50563 SERIAL_NUMS(2,8) = 50565 SERIAL_NUMS(2,9) = 50570 258 December 2014 SAA Software SERIAL_NUMS(2,10) = 50968 SERIAL_NUMS(2,11) = 50969 SERIAL_NUMS(2,12) = 50982 SERIAL_NUMS(2,13) = 50996 SERIAL_NUMS(2,14) = 50998 SERIAL_NUMS(2,15) = 50039 'declare the number of octets for each SAA: '------------------------------------------ 'SAA 1: NUM_OCTETS_INDEX(1) = SAA1_NUM_OCTETS 'SAA 2: NUM_OCTETS_INDEX(2) = SAA2_NUM_OCTETS 'declare the com port assignment for each SAA: '--------------------------------------------- 'SAA1: COM_PORT(1) = SAA1_COM_PORT SAA232_5_PORT_INDEX(1) = SAA1_232_5_PORT 'SAA2: COM_PORT(2) = SAA2_COM_PORT SAA232_5_PORT_INDEX(2) = SAA2_232_5_PORT 'initialize COM and CRC errors: NUM_COM_ERRORS = 0 NUM_CRC_ERRORS = 0 'initialize SAATOP parameters SAA1_SAATOP_VOLTAGE=0.0 SAA1_SAATOP_CURRENT=0.0 SAA1_SAATOP_TEMPERATURE=0.0 December 2014 259 SAA2_SAATOP_VOLTAGE=0.0 SAA2_SAATOP_CURRENT=0.0 SAA2_SAATOP_TEMPERATURE=0.0 'declare the SAATop channel of each SAA: '-----------------------------------'SAA1: SAATOP_CHANNEL_INDEX(1) = 0 'SAA2: SAATOP_CHANNEL_INDEX(2) = 0 'initialize power saving flag Power_Save_Flag = True 'make sure modem starts off being on SW12(1) FIRST_SCAN = true 'do preliminary scans first For PRELIM_COUNT=1 To NUM_PRELIM_SAMPLES Call GetVWData() Call GetArrayData() Delay(0,10,2) Next PRELIM_COUNT 'now do actual scan indefinitely '>>>>>>>>>>>>>>> START <<<<<<<<<<<<<<< Scan (1,hr,0,0) '>>>>>>>>>>>>>>> END <<<<<<<<<<<<<<< 'power switching If Power_Save_Flag = True Then If TimeIntoInterval(0,24,Hr) Then 260 December 2014 SAA Software SW12(0) EndIf If TimeIntoInterval(6,24,Hr) Then SW12(1) EndIf Else SW12(1) EndIf ' get VW sensor data Call GetVWData() ' get SAA data Call GetArrayData() NextScan EndProg December 2014 261 H. Legacy Formats (SAACR_raw2data) H.1 Legacy Format Definitions: xyzt_1: ASCII and “multi_saa_allcart.mat” files that contain absolute position, and timestamps only. pos_accel_curv_t: ASCII and “multi_saa_allcart.mat” files that contain absolute position, timestamps, acceleration, and curvature. all/cur/mat: “multi_saa_allcart.mat” and “multi_saa_curcat.mat” MATLAB files only server_mat: “multi_saa_allcart.mat”, “multi_saa_curcat.mat”, “chunked” “multi_saa_allcart.mat” MATLAB files (No acceleration data in chunked data) and any *.txt non-SAA sensor files. Atlas_1: Same as xyzt_1 but includes ASCII in Atlas format (1D/file *num_saa in Atlas_Export folder). TempC: Celcius temperature only. Atlas_3: Same as xyzt_1 but includes ASCII in Atlas format (3D/file *num_saa in Atlas_Export folder). Atlas_1_cur: Same as Atlas_1 but CURRENT data only. Atlas_3_cur: Same as Atlas_3 but CURRENT data only. VDVxyz: Vista Data Vision, similar to Atlas_3 but without “NaN” columns and with headers. See header of file for column definitions. VDVallXallYallZ: Vista Data Vision, similar to VDVxyz but all X, all Y, and all Z grouped together. X and Y are tilts, which will be cumsummed by VDV along the SAA. See header of file for column definitions. VDVallXallYallZ_EnglishUnits: same as VDVallXallYallZ but in inches and feet. H.2 Reviewing the Files [Section 5.6] multi_saa_allcart.txt o A legacy format that should be avoided unless preserving an older format. o ASCII concatenated Cartesian data (only if arriving data start with frame 0). multi_saa_curcart.txt o A legacy format that should be avoided unless preserving an older format. o ASCII current Cartesian data. o Contains formatted ASCII data; it is always the current data arriving from the CS Data Logger. It is always formed. Figure G- 1 is a typical legacy Cartesian data file. “Curcart” or “allcart” forms look the same; “allcart” will have multiple sets of data where “curcart” files will have only one set of data per SAA. Each SAA has an SAA header. Cartesian data formats can vary, depending on selection. 262 December 2014 SAA Software Figure G- 1: A typical “multi_saa_allcart data” file. H.2.1 Atlas (Legacy) There are now two legacy Atlas/Argus exports: Atlas_1 and Atlas_3. For new work, DIY should be used as it can be tailored to Atlas requirements. Legacy “Atlas_1” breaks up the “ASCII” files into individual files, one per dimension and SAA. All the files appear in an “Atlas” folder, which is auto-created if not there already. Another legacy Atlas export format called “Atlas_3” breaks up the “ASCII” files so that each SAA is represented by a single file containing X, Y and Z data. All the files appear in an “Atlas” folder, which is auto-created if not created already. December 2014 263 Figure G- 2: Shows the resulting files of an export of type “Atlas_1” for nine SAAs. An “Atlas_3” export would create one-third as many files. H.2.2 Vista Data Vision (Legacy) Legacy “Vista Data Vision” (VDV) files are very similar to “Atlas_3” files. “VDV” files are placed in a ‘VDV’ folder within the project folder, one file per SAA; each file contains X, Y and Z data. Each file has a two-line header the vertices are called “Sensor_X_001”, “Sensor_Y_002”, etc. Unlike “Atlas” files, there are no blank columns containing “NaN” or “blank”. Figure G- 3: Show the resulting files of an export to type “VDV” for five SAAs. 264 December 2014 SAA Software H.2.3 Tempc (Legacy) Another legacy format is “Tempc”. It delivers temperatures in a simplified format; one per octet. Temperatures are in degrees Celsius. Figure G- 4: “Tempc.txt” file. December 2014 265 I. Finding Azimuth In the past it was recommended that the SAA be aligned in the direction of expected movement by lifting and rotating the SAA so that the X-mark was pointing in the same direction as the expected direction of movement. For very long SAAs it was difficult to know whether or not the SAA was lifted from the bottom prior to turning the SAA to align the X-mark. This could lead to a twist being induced on the SAA. In order to remove this issue, it is now recommended that the SAA azimuth offset be measured and input in to the SAA software during data processing. This way the SAA data is displayed so that the X direction corresponds to the expected direction of movement or other desired heading. To determine the azimuth offset, use the instructions given below. I.1 SAA X-mark Protractor 1. Place the square protractor (Figure I. 1) around the PEX at the top of the SAA. 2. Rotate until the arrows are pointed in the expected direction of movement or other desired heading of the SAA or other job site datum. Figure I. 1: X-mark Protractor square protractor. 3. Place the clear disk marker (Figure I. 2) with the “X-Line” around the PEX on top of the square protractor. 4. Rotate the clear disk around the SAA until the “X-Line” on the disk and the “X-Line” on the PEX line up. 266 December 2014 SAA Software Figure I. 2: X-mark Protractor clear disc marker. 5. Make note of the angle at the “X-Line”. This will be used in the software when doing azimuth correction. See Section 3.2.6.4. See Section 6.4.5. See Section 7.2.5.3. Note: If the protractor needs to be placed over the PVC casing rather than the PEX, the required hole size is marked so it can be cut to fit. I.2 SAA Reference Segment Alignment This method of determining alignment is only used in cases where the SAA is not completely placed inside the borehole. An example of this is when a SAAScan is used to measure borehole alignment. It is not used in standard SAA installations. I.2.1 X-marking Visible If the reference SAA segment at the top of a hole has a visible X-marking on it, determining the reference azimuth in SAARecorder amounts to figuring out the direction where the X-mark is pointing, relative to some known reference direction (ex: 30 degrees east of north). The direction that the X-mark is pointing can be entered directly into SAARecorder using the ‘SAA setup | Site properties’ menu item. Enter the direction relative to north as the “azimuth” angle in degrees. Then the positional data in SAARecorder will be calculated such that +X displacements occur in the north direction and +Y displacements occur in the west direction. December 2014 267 I.2.2 X-marking Not Visible The X-mark may not be visible if the top reference segment is inclined at an angle relative to vertical, or if the top reference segment corresponds to a segment of the SAA that does not actually have a visible X-mark. If the SAA comes out of the hole and onto a reel, there should be one or more horizontal (or near horizontal) segments that can be used for alignment purposes as described below: Figure I. 3: Side view of SAA going into hole. Figure I. 4: Top view of SAA going into hole. In a situation like that pictured above, the “real world” angle of the SAA going into the hole needs to be found (the angle “A” in the top view picture above) and also take into consideration how the SAA is rolled. An accurate estimation of the SAA roll angle can be made for the first non-vertical segment coming out of the pipe by taking the arctangent (should actually use the atan2 function for -180 to +180 degree output)1 of the Y-axis and X-axis accelerations of that segment. For example, in the scenario drawn above, the azimuth angle of the SAA relative to north would be: Azimuth = 180° + A - atan2(ref_accY,ref_accX) * 180°/PI The accelerations of each segment of the SAA can be viewed easily in SAARecorder through the ‘Data and graphs | Numeric data’ menu item. atan2 function: http://en.wikipedia.org/wiki/Atan2 268 December 2014 SAA Software J. Troubleshooting FAQs J.1 Adding / Removing SAAs to a Data Logger: I am planning to add (remove) an SAA to an existing Data Logger. Are there changes I need to consider before converting the data? 1. Move all converted data files, exports and project preference files to a separate backup directory. The ‘Main Project’ folder should only contain raw data files. 2. Open SAASuite and run SAACR_raw2data. 3. Make sure to select ‘Reset’. 4. Click ‘New Project’ and select the raw data files. 5. Select conversion preferences (model, reference, export options, etc.). 6. Complete conversion. J.2 Adding an SAA to a Data Logger with Other Sensors: I have some vibrating wire piezometers (or other sensors) that I read already with a Campbell Scientific logger and I want to read SAA(s) with this same logger. How do I do that? You will need to have at least one free serial COM port available on the logger for every 5 SAAs that you want to read with an SAA232-5 and for every single SAA that you want to read with an SAA232. The easiest way to add code for reading SAA(s) is to use the SAACR_FileGenerator Tab (Section 3.1) in SAASuite to generate a CR logger program that just reads SAA data. Then merge this program together with your existing CR logger program for reading other sensors (Appendix G). If you requires assistance doing this, please contact Measurand (Appendix K) and attach the two programs that you would like to merge with a brief description of what your logger application is supposed to do. J.3 How to Collect & Convert Data Logger Data Automatically: I want to collect my Data Logger data automatically and convert it. How do I do that? See Section 4 for details on how to do this using LoggerNet and Section 3.1 for details on how to do this in SAACR_FileGenerator. J.4 Setting Alarms: I want to have an alarm get triggered and sent to me if my data that is automatically converted using SAACR_raw2data exceeds certain limits. How do I do this? You will need to setup an alarm(s) using SAAView (Section 7.2.7). Then when SAACR_raw2data gets called to convert new data, it will automatically check for any defined alarm condition and issue the appropriate alarm if necessary. December 2014 269 J.5 SAACR_raw2data disappears: SAACR_raw2data just disappears when trying to convert my data without offering any feedback that I can see. What should I do? Please let us know what version of SAACR_raw2data (Section 5) you were using and send us all of the raw data files that you were trying to convert. It’s possible that there could be a problem with one or more of the raw data files, user-created site “Calibration” files, or even a bug in the software. We are normally able to figure out what might be wrong and fix it quickly. J.6 Combining Data Files From Different Data Loggers: I have two sets of .DAT file data recorded from two different loggers and I want to combine them together but SAARC_raw2raw_concat gives me this error popup: “File Error: Header is not identical”. In order to combine raw data from two different loggers, it is necessary to edit the header sections of the data file(s) for one logger to match the header information from the first logger. Then SAACR_raw2raw_concat (Appendix A.1) can be used to concatenate the files as per normal. J.7 Issues Installing SAASuite and SAACR Applications: I can’t seem to install the SAASuite application properly, and can’t get any of the SAACR Applications installed. What am I doing wrong? Chances are you don’t have full write privileges on your PC. Please contact your system administrator for more information on how to install additional applications on your PC. J.8 Finding X & Y Directions with Magnetometers and No Azimuth Correction: I have one or more magnetometers in my SAA(s). I did not apply any azimuth corrections to my data in SAACR_raw2data or SAAView. So what “real-world” directions are the X and Y data in? If you have one or more magnetometers, and did not apply any additional azimuth corrections in SAACR_raw2data (Section 5.7) or SAAView (Section 7.2.5) (i.e. azimuth = 0) then the X-axis data is in the direction of magnetic north and the Y-axis data is in the direction of magnetic west. J.9 Site File Issue: I don’t think I created my site calibration file properly, because SAACR_raw2data just closes and does not convert anything. Please send us the “site calibration” file that you created, along with any raw data files that you might have, and any other pertinent installation details. We should be able to create a site “Calibration” file for you that will work with your data. J.10 Quick Data Logger Verification: How can I quickly verify that my logger installation is working correctly and collecting valid data? 270 December 2014 SAA Software The SAA logger programs generated by SAACR_FileGenerator Tab (Section 3.1) are configured by default to collect 5 samples as quickly as possible, immediately after powering up. Thereafter, the program is configured to collect data at the regular defined sampling interval. So by cycling power to your logger you should be able to get those 5 samples in 5 minutes or less, assuming everything is hooked up properly and is functioning OK. A PC running LoggerNet (Section 4) can be used with a direct cable connection to the logger to download the data and check that there are no communication errors (look at the “SERIAL_ERRORS.dat” files Section 5.3.3) and that the data in the “SAAX_DATA.dat” file(s) (Section 5.3.2) is within normal limits. Open the file(s) using SAACR_DataChecker (Appendix B) or try converting the data using SAACR_raw2data (Section 5) and viewing the resultant “multi_saa_allcart.mat” file in SAAView (Section 7). J.11 Updated Data Logger OS to Version 26: I recently upgraded my logger operating system to version 26 and now I am unable to receive any SAA data. There is a known issue with Campbell’s operating system (OS) version 26 and older SAA data collection programs. If you use SAASuite to download and install the most recent version of SAACR_FileGenerator Utility (Section 3) and create a new logger program, you should not have any further issues collecting SAA data in OS 26. J.12 Update Data Logger, Not Getting Data: We updated our logger installations recently, but now we are unable to get any data. A common error in many logger installations is that the ‘SAA_Include’ file is set to run on power-up, instead of the actual ‘Main SAA Program’ file. In LoggerNet (Section 4): 1. Click on ‘Connect’ 2. Click the ‘File Control’ button 3. Determine which file is actually running and is set to run on power-up. Another common problem (for loggers accessible through a modem) is that the modem used for communications is powered on all of the time and might have crashed, causing the logger to be unresponsive to outside communication requests. The recommended practice is the cycle power to the modem once per day in order to allow it to be periodically reset. SAACR_FileGenerator Tab (Section 3.1) does not configure the generated program for use with a modem. The user needs to do this on their own using a text editor. If you require assistance with this, please contact Measurand (Appendix K). December 2014 271 J.13 COM Port Conflict: I merged an SAA program file generated by SAACR_FileGenerator Tab with another program file that I have collected data from other sensors, but the result will not compile because of a COM port conflict. In some rare cases, it is necessary to edit the “Include” file generated by SAACR_FileGenerator Tab (Section 3.1) to remove references to COM ports that are used by other equipment / sensors. If you require assistance with this, please contact Measurand (Appendix K). J.14 Setting Azimuth: The X-mark at the top of the SAA is pointed in a certain direction. How should I set azimuth for converting data? To determine Azimuth, go to Appendix I. J.15 Using Data From Damaged SAAs: We believe one of more of our SAA segments have become damaged, however we would still like to view as much of the SAA data as we can. What should we do? If one or more SAA segments are damaged and not giving reliable data, it is still often possible to view data for the rest of the SAA by “slaving” the damaged segments(s) in SAACR_FileGenerator Tab, Sensor Fields (Section 3.2.6.6) and / or SAACR_raw2data Settings (Section 5.5.3). Slaving a segment is the equivalent to telling the converter application to ignore any changes in tilt that might result from that segment. If previous conversions have been performed without segments slaved, it will be necessary to reconvert all the data by clicking the ‘RESET’ button when starting SAACR_raw2data. J.16 Checking Magnetometers: How do I check my magnetometers to ensure they are working properly? Note the information provided in this section only applies to SAAs for which optional magnetometers were ordered. J.16.1 Checking magnetometer data collected with SAARecorder If you are using SAARecorder (Section 6) to collect data, you can view magnetometer data for all of your magnetometer devices by clicking on the 'Data and graphs | Magnetometer data' menu item (Section 6.5.6). This presents a window that allows you to quickly view heading information and total magnetic field magnitude for each magnetometer. If the devices are functioning correctly and the SAA is not moving, and is either vertical or within 45 degrees of vertical, the X-axis heading values should remain relatively fixed (within +/- 1 degree) and should also agree fairly well (within +/- 5 degrees) with one another, assuming that the twist along the length of the SAA is not excessive. In the absence of any magnetic interference, the magnetic field strength measured by each device should agree with the other devices to within +/- 5%. 272 December 2014 SAA Software J.16.2 Checking magnetometer data collected using SAACR_raw2data If you are converting data logger data using SAACR_raw2data (Section 5), you will need to: 1. In the ‘Settings’ window of SAACR_raw2data, click the ‘Advanced (mag)’ button (Section 5.7.2). 2. Click ‘Continue’. 3. Choose or create a file to which magnetometer data will be saved, ex: magdata.mat. 4. Open the same file you just saved. 5. Click the ‘Specific Settings’ button. 6. Should see an ‘Azimuth vs. Time’ graph with a single trace of ‘Change in Azimuth’ for each magnetometer. 7. If the SAA is stable (i.e. not being rotated or moved at all, and none of the magnetometers are affected by magnetic interference) then the change in azimuth plots for each magnetometer should remain quite close to 0 degrees. Significant changes from 0 degrees (i.e. more than +/- 1 degrees) would indicate that either (i) the SAA was rotated or (ii) there was some magnetic interference acting upon the magnetometer(s). 8. Check the total magnitude of the magnetic field measured by each magnetometer by clicking on the ‘tot’ button in the top-right corner and looking at the magnitude traces. The value of these traces is calibrated to be 1.0 for the Earth's magnetic field as measured at our factory located in Fredericton, NB, Canada, but will in general be slightly different depending on the strength of the Earth's field at your location. For example, in many parts of South America, the average strength of the Earth's magnetic field is only about half that of the magnetic field strength in Eastern Canada. If the total magnitude measured by one or more magnetometers differs from that of the other magnetometer(s) by more than 10% then it is likely that there is some magnetic interference near the SAA that is adversely affecting one or more of the SAA magnetometers. It is generally advisable to "turn off" any magnetometers that are affected by magnetic interference by right-clicking on their corresponding magnitude trace and then selecting the ‘Turn Off this mag’ option. 9. After the on / off states of the magnetometer devices and a "quiet time" in the magnetometer data have been selected (as described in Section 5.7) the user saves the “Magnetometer” file typically in a subfolder of the main data folder called "magdata". Within this folder is a generated file called "headings.txt" which contains a summary of the heading azimuth angles measured by each magnetometer. These headings are useful for gauging exactly how much the SAA might be twisting. J.17 Checking Data Logger Data: How do I check data collected using a data logger to make sure it is good? Use the SAACR_DataChecker utility in SAASuite to verify the raw data files collected using a data logger are good. SAACR_DataChecker provides colour coded graphs of the SAA ‘data vs. time’. Instructions for using the SAACR_DataChecker can be found in (Appendix B). J.18 SAAView Showing One Frame: I just saved 3 samples of data. Why does SAAView only show one frame? December 2014 273 SAAView has a default filter which will average several readings together and present these in the ‘Filtered View’ presented at the right hand side of the ‘Main SAAView’ window. In order to view all data, either change the filter using the methods described in Section 7.2.4, or make sure that you are looking at the data in the ‘Unfiltered View’ located at the left of the ‘Main SAAView’ window. J.19 Ignoring Segments: How do I turn off or ignore segments? In some cases the SAA in not fully installed into a borehole. In these cases, it is possible to turn off segments and ignore them in the data viewer or in SAA_raw2data, see Section 5.5.3. 274 December 2014 SAA Software K. Support (Help) For support with SAAs, SAARecorder, or other Measurand products, please contact us: Measurand Inc. 2111 Hanwell Road Fredericton, New Brunswick Canada E3C 1M7 Phone: 506-462-9119 Fax: 506-462-9095 Website: www.measurand.com Email: [email protected] K.1 Online Documents The following link goes to Measurand’s website where Hardware and Software Manuals as well as Product Specifications can be downloaded. http://www.measurandgeotechnical.com/support_documents.html K.2 Online Tutorial Videos The following link goes to Measurand’s website where training videos for software and hardware use and installation are available. http://www.measurandgeotechnical.com/support_tutorial_videos.html K.3 Online Software Downloads The following link goes to Measurand’s website where SAASuite and other applications / utilities can be downloaded. http://www.measurandgeotechnical.com/software.html December 2014 275