1
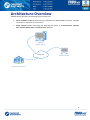
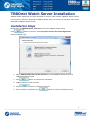
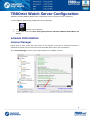
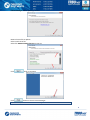
TRBOnet Watch User Guide December 15, 2014 1 Table of Contents Preface .................................................................................................................................................. 4 About the Company .......................................................................................................................... 4 Contact Details .................................................................................................................................. 4 Copyright .......................................................................................................................................... 4 Hardware and Software Requirements................................................................................................. 5 Architecture Overview .......................................................................................................................... 6 TRBOnet Watch Server Installation....................................................................................................... 7 Installation Steps .............................................................................................................................. 7 TRBOnet Watch Server Configuration................................................................................................... 8 License Information .......................................................................................................................... 8 License Manager ........................................................................................................................... 8 Create TRBOnet Watch Database ................................................................................................... 10 Install TRBOnet Watch Service ........................................................................................................ 11 Configure Network Parameters ...................................................................................................... 12 Advanced settings ........................................................................................................................... 13 MOTOTRBO System Elements......................................................................................................... 14 Add a MOTORBO Repeater ......................................................................................................... 15 Add TRBOnet Swift Agent ........................................................................................................... 22 Add Friendly FS-1000 Adapter .................................................................................................... 23 Selex................................................................................................................................................ 24 Add Selex Repeater ..................................................................................................................... 24 SNMP (Simple Network Management Protocol)................................................................................. 26 TRBOnet Watch Dispatch Console ...................................................................................................... 34 Dispatch Console Menu .................................................................................................................. 36 File .............................................................................................................................................. 36 Tools ........................................................................................................................................... 37 Request Feature .......................................................................................................................... 38 Help............................................................................................................................................. 38 Repeater Monitoring ...................................................................................................................... 39 Live Monitor................................................................................................................................ 39 TRBOnet Swift Agent Monitoring .................................................................................................... 48 2 Stations ....................................................................................................................................... 48 Diagnostics .................................................................................................................................. 49 Topology ..................................................................................................................................... 50 Physical GPIO Pins ....................................................................................................................... 50 Reports ........................................................................................................................................... 51 Report Types Overview ............................................................................................................... 51 Creating Custom Report Filter .................................................................................................... 52 Toolbar ........................................................................................................................................ 55 Analytics.......................................................................................................................................... 56 Statistic Types ............................................................................................................................. 57 Voice Recording .............................................................................................................................. 69 Voice Recording Filter ................................................................................................................. 69 Toolbar ........................................................................................................................................ 70 To Playback a Call........................................................................................................................ 71 Administration ................................................................................................................................ 72 Database ..................................................................................................................................... 72 Aliasing........................................................................................................................................ 73 Notifications................................................................................................................................ 77 License ........................................................................................................................................ 82 Appendix A: Supported Map Types..................................................................................................... 83 3 Preface This document is intended for TRBOnet Watch users to install, upgrade and configure the system. It describes system requirements, installation and configuration process of TRBOnet Watch RadioServer and Dispatch Console. About the Company Neocom Software, Ltd was created in 2007 on the basis of Neocom, Ltd., which was founded in 1997 and is the famous supplier of radio communication systems for professional or license-free use on the ground, seas or rivers. Today, Neocom Software has Motorola Application Partner status in EMEA, Latin America and the Asia Pacific region, and Motorola Application Provider status in North America. Contact Details Region Phone North America +1 872 22 28 726 Latin America +1 872 22 28 726 EMEA +7 812 45 70 893 APAC +7 812 45 70 893 E-mail [email protected] - overview, price lists, licenses [email protected] - technical support service http://kb.trbonet.com - online Knowledge Base Copyright Intellectual property rights protect the voice coding Technology embodied in this product including patent rights, copyrights and trade secrets of Digital Voice Systems, Inc. This voice coding technology is licensed solely for use within this Communications Equipment. U.S. Pat. Nos. 6,199,037, 5,870,405, 5,754,974, 5,664,051, 5,630,011, 5,517,511, 5,491,772, 5,247,579, 5,226,108, 5,226,084, 5,216,747 and 5,081,681. 4 Hardware Requirements and Software TRBOnet Watch Server Voice Channels CPU Memory HDD Sound Card Supported OS Software 4 8 16 24 24+ Intel Core Intel Core Intel Core i7, 4 Intel Core i7, 6 i3 i5 Cores Cores Contact 2 GB 4 GB 4 GB 8 GB technical support 300 MB for installation files, +1 MB per 1 minute of voice recording No Windows 7, Windows 8, Windows Server 2008, Windows Server 2012 .NET Framework 4.0, MS SQL Server 2008 Express Edition or higher Dispatch Console CPU Memory HDD Sound Card Display Additional Devices Supported OS Software Intel Core i3 4 GB 70 MB for installation files Yes 1280x1024 minimal resolution, 1600x900 recommended resolution Speakers and microphone or headset. Imtradex devices are recommended. Windows 7, Windows 8 .NET Framework 4.0 5 Architecture Overview TRBOnet Watch includes two following logical components: Server software (TRBOnet Watch Server) implements the MOTOTRBO™ protocols, manages connection to repeaters and stores data. Client Console. Allows monitoring and analyzing data traffic on IP Site Connect, Capacity Plus, Linked Capacity Plus and Connect Plus repeaters. TRBOnet Watch Server WAN/LAN Client Console Radio Infrastructure 6 TRBOnet Watch Server Installation TRBOnet Watch application has been designed to monitor radio network. TRBOnet Watch Console can connect to repeaters registered in TRBOnet Watch Server. All activity on repeaters' slots will be displayed in TRBOnet Watch Console. Installation Steps Double-click the TRBOnet Watch_vX.X.exe file to run the TRBOnet Watch setup. Click button to continue. Click I accept the terms in the License Agreement. Select installation type: 1. Select TRBOnet.Watch 2.2 Console and Server to install TRBOnet Watch Server and TRBOnet Dispatch Console. 2. Click button to continue the installation. 3. TRBOnet Watch is ready to install. 4. Click button to install the software. 5. After installation completes, click button to exit the installation wizard. 7 TRBOnet Watch Server Configuration TRBOnet provides TRBOnet Watch Server Configurator tool to customize server parameters. To open TRBOnet Monitoring Configuration do the following: Use shortcut on the desktop. In the Start menu and select All Programs/Neocom Software/TRBOnet Watch/Watch 2.2 Server. License Information License Manager Before start to work, check that your license is not expired. If you have a commercial license or would like to update you current license with extended demo license you can update it. Go to License Manager to see a current license details or to update a license. 8 License Manager allows updating a license: Browse license file to update. Select new license file. Select file TRBOnet Watch.license on your PC: Click button to continue. Click button to close License Manager. Note: delete all previous licenses files before using. 9 Create TRBOnet Watch Database Select Database in the navigation tree: Specify the following parameters: SQL Server - specify SQL Server name and instance ((local)\SQLEXPRESS instance is set by default). Database - specify database name (TRBOnetWatch is set by default). Authentication - select Windows or SQL Server Authentication. Specify User Name and Password for SQL Server Authentication. Click ‘’Create Database’’ to create a new database with selected parameters for the first installation. Click ‘’Upgrade Database’’ to upgrade the database structure to the latest version for TRBOnet Watch upgrade. Click ‘’Test Connection’’ to check if TRBOnet Watch can connect to the database. Click ‘’Clear Log’’ to delete log files from the database log. 10 Install TRBOnet Watch Service Select Service in the navigation tree: Click ‘’Install Service’’ button. 11 Configure Network Parameters To configure network parameters select Network in the navigation tree: Configure the following parameters: Command port - port to connect by TRBOnet Watch Console. Specify command port (4019 set by default). Encrypt network protocol – check to use encryption while data transfer in the network. 12 Advanced settings To specify advanced system settings select Advanced Settings in the navigation tree: Language - select interface language in the dropdown list. Logging level - select logging level in the dropdown list. Determines the amount of data stored in the System Log. This information is used by technical support for troubleshooting, therefore it is recommended to keep the value unchanged. 13 MOTOTRBO System Elements All Radio system elements based on MOTOTRBO™ services are represented in the table including its units (Repeater, TRBOnet Swift Agent, etc.), IP Address and Radio ID: Note: The Radio ID should be unique for each software connection to repeater. For example, to connect TRBOnet Enterprise use port 80000, TRBOnet Watch - 80001 and RDAC - 80002. Also, use different IDs for connection to repeater from different PCs. To add elements in the system (Repeater, TRBOnet Swift Agent etc.), click select type of element in the dropdown list. button and 14 Add a MOTORBO Repeater To add a repeater, go to MOTOTRBO in the navigation tree: Click button and select Add Repeater in the navigation tree. 15 Specify the following new repeater parameters: System Name - specify a repeater's name in the system to display in TRBOnet Watch Console. TRBOnet Peer ID - specify a unique Peer ID for TRBOnet Watch Server in radio system. TRBOnet Local Port - specify a local port of TRBOnet Watch Server to accept connections from the repeater. Use unique ports for each repeater connection if there are several repeaters connected. SNMP ID – for more detail on SNMP see SNMP (Simple Network Management Protocol). IP Site Connect Master Peer: Master IP Address - specify Ethernet IP address of the repeater from its codeplug. Master UDP Port - specify UDP port of Master repeater to connect. Click button to check the connection to Master repeater. A window will appear. In case of success it should show firmware version and serial number of the repeater. Authentication Key - specify the repeater's authentication key from code plug if it is used. System Type - select system type in the dropdown list. Specify a unique System Identifier for a Capacity Plus system. Use the same System Identifier as for Control Station from the same system. 16 Privacy To set Privacy parameters select Repeater > Privacy in the navigation tree: Specify the following Privacy parameters: Privacy Type - select None / Basic / Enhanced Privacy. Basic Privacy Key ID - available when Basic Privacy Type selected. Enhanced Algorithm – select encryption type if you are going to use additional encryption. Available when Enhanced Privacy Type selected. Note: For more details on ARC4 see https://en.wikipedia.org/wiki/RC4 and for AES see https://en.wikipedia.org/wiki/Advanced_Encryption_Standard articles. For using these enhanced algorithms special license required. Enhanced Privacy Keys - available when Enhanced Privacy Type selected. To add Enhanced Privacy Keys click button. Enhanced Privacy Key automatically added in the table. Specify Enhanced Privacy Key ID, Name and Value in the table. To remove Enhanced Privacy Key click button. 17 Data Persistence On the Data Persistence page you can set rules for calls and blackouts of the selected repeater displaying in the Dispatch Console and storing Voice and/or data: On the Group Calls and Private Calls tabs you can set rules for group and Private calls voice and data according to a selected filters configured below: Group Calls and Private Calls No Filter Filter Range Show in Console Store Voice Add Range Edit Remove Allows system displaying in the TRBOnet Watch Dispatch Console and storing in the database all voice and data. Enables advanced filter parameters for Group and Private calls Shows range of groups (for Group Calls) and range of subscribers (for Private Calls) to enable the rules. Check groups or subscribers range for applying the rules. If not checked, selected items data is hidden in the TRBOnet Watch Dispatch Console. Check to store selected groups or subscribers voice in the database. Controls ‘’Add specified …’’ adds individual ‘’… Range’’ adds groups or subscriber custom groups or subscribers with range with IDs according to selected individual IDs. range. Allows editing groups (subscribers) range values. Removes selected groups (subscribers) range. Allows changing selected items priority level. Scope. Shows graphically selected filter parameters. 18 On the All Call tab you can select filters for All Calls: Show in Console – select to allow displaying All Calls data in TRBOnet Watch Dispatch Console. Store Voice – select to store All Call voice communications in the database. Scope - shows graphically selected filter parameters. 19 On the Blackouts/RCM tab you can set parameters for Repeater Control Messages monitoring. Repeater Control Messages (RCM) – shows repeater service messages (Start/Stop TX, Interference, etc.). Blackout is a time period when all channels busy in Capacity Plus and Linked Capacity Plus systems. Store Repeater Control Messages (RCM) – RCM packets stored in the database and include blackouts in the reports. To consider only the blackouts that are longer than – sets minimal value for TRBOnet Watch to monitor RCM. RCM packets less than selected values will be ignored. 20 Peers TRBOnet Watch uses peers as criteria to generate Reports and Analysis. Software components (e.g. TRBOnet Enterprise, RDAC Console) also act as peers. Load Peers Map – downloads all available peers of the selected repeater in case of successful connection. Peer ID – a unique ID for the peer. Alias – select a name for the peer to display in TRBOnet Watch Dispatch Console. Click ‘’Add’’ button to add new peer for selected repeater. 21 Add TRBOnet Swift Agent TRBOnet Swift Agent functions as a gateway to receive and transmit voice and data. To add TRBOnet Swift Agent go to MOTOTRBO in the navigation tree and click ‘’Add TRBOnet.Swift Agent’’ button. New TRBOnet Swift Agent window appears: Name - specify TRBOnet Swift Agent name to display in the Dispatcher Console. IP Address - select an IP Address of the new Swift Agent network interface. Port - specify port to connect to the new Swift Agent (8002 set by default). Click ‘’Test’’ button to check the connection. Ignore voice data – select to use TRBOnet Swift Agent to transmit the data and voice calls indication (Voice Recording not available at this case). VoIP port - Port for audio communication. Select VoIP port (4000 set by default). GPIO Physical Pin Names – allows set Pin Values for selected TRBOnet Swift Agent inputs below. 22 Add Friendly FS-1000 Adapter Friendly FS-1000 Adapter allows to work with radios in the local networks of monitoring and to transfer the data. To add Friendly FS-1000 Adapter go to MOTOTRBO in the navigation tree and click ‘’Add Friendly FS-1000 Adapter’’ button. New Friendly FS-1000 Adapter window appears: Name - specify Friendly FS-1000 Adapter name to display in the Dispatcher Console. IP Address - select an IP Address of the new Friendly FS-1000 Adapter network interface. Port - specify port to connect to the new Friendly FS-1000 Adapter (8002 set by default). Click ‘’Test’’ button to check the connection. 23 Selex TRBOnet Watch supports monitoring of Selex repeaters. Add Selex Repeater To add a repeater, go to Selex in the navigation tree: Click ‘’Add’’ button to add a repeater. 24 New Selex repeater settings window appears: System Name - specify a repeater's name in the system to display in Dispatch Console. IP Address - specify IP address of the repeater from its code plug. UDP Port - specify UDP port of Selex repeater to connect. Click ‘’Test’’ button to check the connection to the repeater. A window will appear. In case of success it should show firmware version and serial number of the repeater. 25 SNMP (Simple Network Management Protocol) Simple Network Management Protocol is a standard internet protocol to manage the devices in IP Networks on the basis of UDP/TCP architecture. In the TRBOnet Watch Server it is used to monitor the repeater states. SNMP settings specified in the TRBOnet Watch Server are then used in NMS. To configure SNMP parameters select SNMP in the Navigation Tree: 26 All SNMP parameters see in the table below: System Parameters sysDescr sysObjectID sysContact sysName sysLocation Engine ID (only for SNMPv3) Brief server description for its further identification in the SNMP Console (hereinafter, NMS). Personal server ID in the system (default). Contact details. TRBOnet Watch Server name that will be shown in the NMS. Information on current location of the server. ID used for data encryption and identification in the NMS. SNMP Agent Enabled SNMPv.3 Only Check to activate SNMP mode. Check to use SNMPv.3 (this version of the SNMP uses the data encryption when it is requested by the NMS). Notification Send: SNMP Test Message Authentication To Version Check to send the notifications to the NMS. Sending test system message about blocking of the access to the server's data in the NMS application. For SNMPv3 only. Sets additional security settings. IP Address of the recipient. select the protocol version: SNMPv2 or SNMPv3. SNMPv3 User ( Only for SNMPv3) User Auth password Conf. password Auth Protocol Privacy protocol Specify user name to logon the NMS. Specify the password to logon the NMS. Specify additional password for privacy. The system will request this password first. After that you need to specify the User and Auth. password. Type of the authentication protocol. Type of the privacy protocol. 27 TRBOnet Watch Server uses a certain set of the MIB files. These files should be loaded to the NMS: ns_00_INET-ADDRESS-MIB.mib ns_01_CISCO-SMI.mib ns_02_CISCO-TC.mib ns_03_RMON-MIB.mib ns_04_TOKEN-RING-RMON-MIB.mib ns_05_SNMP-FRAMEWORK-MIB.mib ns_06_RMON2-MIB.mib ns_07_ENTITY-MIB.mib ns_08_CISCO-ENTITY-ALARM-MIB.mib ns_09_ALARM-MIB[rfc3877].mib ns_10_NEOCOM-SMI.MIB ns_11_NEOCOM-PRODUCTS-MIB.MIB Almost full compatibility with CISCO ENTITY-MIB and CISCO-ENTITY-ALARM-MIB is realized (08-09 files). These Mibs and all references (00-07 files) contained in the MIB\Common folder. NEOCOMPRODUCTS-MIB describes TRBOnet Watch and determines the extent to which ENTITY-MIB and CISCO-ENTITY-ALARM-MIB are realized for version if the product. The numbers in the file names indicate the compilation order in Management Console (here and further examples will be used by CastleRock SNMPc NMS Computing). ENTITY-MIB contains information for managing physical entities on the system. It also organizes the entities into a containment tree that depicts their hierarchy and relationship to each other. The MIB supports the following tables:–The entPhysicalTable describes each physical component (entity) in the system. The table contains an entry for the top-level entity (the master repeaters) and for each entity connected to master (hardware peers, applications, etc.). Each entry provides information about that entity: its name, type, vendor, and a description, and describes how the entity fits into the hierarchy of system entities. CISCO-ENTITY-ALARM-MIB provides the information concerning all the alarm types in the system: Monitor when alarms are asserted and cleared. Obtain alarm history information. Track alarm statistics and counts. Generate SNMP traps and syslog messages in response to alarms. 28 Main Objects of Interest for TRBOnet Watch entPhysicalTable Oid: 1.3.6.1.2.1.47.1.1.1 The Physical Entity (Overall System Topology) Table. Defined in module ENTITY-MIB. ceAlarmDescrMapTable Oid: 1.3.6.1.4.1.9.9.138.1.1.1 A mapping between an alarm description and a vendor type. Defined in module CISCO-ENTITY-ALARM-MIB. ceAlarmDescrTable Oid: 1.3.6.1.4.1.9.9.138.1.1.2 Alarm Description Table. Defined in module CISCO-ENTITY-ALARM-MIB. ceAlarmTable Oid: 1.3.6.1.4.1.9.9.138.1.2.5 Alarm control and status information related to the corresponding physical entity, including a list of those alarms currently being asserted by that physical entity. Defined in module CISCO-ENTITY-ALARM-MIB. ceAlarmHistTableOid: 1.3.6.1.4.1.9.9.138.1.3.3 This table contains a history of ceAlarmIndicate and ceAlarmClear traps generated by the agent. Defined in module CISCO-ENTITY-ALARM-MIB. Generated Notifications List: ceAlarmAsserted (Alarm Enabled) Oid: 1.3.6.1.4.1.9.9.138.2.0.1 Defined in module CISCO-ENTITY-ALARM-MIB 29 ceAlarmCleared (Alarm Disabled) Oid: 1.3.6.1.4.1.9.9.138.2.0.2 Defined in module CISCO-ENTITY-ALARM-MIB entConfigChange (Generated when entPhysicalTable modified) Oid: 1.3.6.1.2.1.47.2.0.1 Defined in module ENTITY-MIB warmStart (standard notification when launching the program) Alarm Overview Each alarm contains the following information: Alarm type - unique code that identifies the alarm Severity - the seriousness of the condition causing the alarm Description - information about the condition that caused the alarm Alarm States An alarm's state indicates the current state of the condition that caused the alarm: Asserted - the condition currently exists. Cleared - the condition has been resolved. The severity of alarm indicates condition type that alarm represents: Critical (1) - a severe, service-affecting condition requiring immediate corrective action. Major (2) - a hardware or software condition that causes a serious disruption of service, or is on hardware essential to the operation of the system. Although less serious than a critical alarm, a major alarm requires immediate attention to correct the problem. Minor (3) - a condition or problem that does not affect service, or is on nonessential hardware. Info (4) - the information message concerning the event that improves operation, or the indication of a condition that could cause a problem. Interpreting Alarm Information in the CISCO-ENTITY-ALARM-MIB To obtain information about system alarms from the CISCO-ENTITY-ALARM-MIB, do the following: Step 1: to determine if any alarms are currently being asserted, read the values of the objects in ceAlarmTable. Each entry in the table contains information about the alarms currently being asserted by each physical entity. Each entry is indexed by the entPhysicalIndex (ENTITY-MIB) of the entity. Step 2: to obtain information about individual alarms, read the values of the ceAlarmDescrSeverity and ceAlarmDescrText objects. 30 TRBOnet Watch alarm hex-codes: RxAlarm = 0x02, Receiver_EEPROM_Corruption_Type_1 = 0x0C, Receiver_EEPROM_Corruption_Type_2 = 0x0D, Receiver_EEPROM_Corruption_Type_3 = 0x0E, RxRevision = 0x28, TxAlarm = 0x01, FanAlarm = 0x05, PA_EEPROM_Corruption_Type_1 = 0x06, PA_EEPROM_Corruption_Type_2 = 0x07, PA_EEPROM_Corruption_Type_3 = 0x08, PA_Revision = 0x26, Exciter_EEPROM_Corruption_Type_1 = 0x09, Exciter_EEPROM_Corruption_Type_2 = 0x0A, Exciter_EEPROM_Corruption_Type_3 = 0x0B, Exciter_Revision = 0x27, Transmitter_Power_Minor_Alarm_2db = 0x15, Transmitter_Power_Minor_Alarm_3db = 0x16, Transmitter_Power_Major_Alarm_3db = 0x17, PA_Gain_Alarm = 0x24, Exciter_Final_Amp_Alarm = 0x20, Exciter_Driver_Amp_Alarm = 0x1F, RF_Power_Control_Alarm = 0x23, Reference_Incompatibility = 0x1E, Interoperability_Between_Exciter_and_PA = 0x18, AC_Power_Alarm = 0x04, PA_Voltage_Minor_Alarm = 0x11, 31 PA_Voltage_Major_Alarm = 0x12, PA_Voltage_Alarm_High = 0x10, Volt_8_Supply_Alarm = 0x21, Volt_10_Supply_Alarm = 0x22, Incorrect_Carrier_Frequency = 0x19, Incorrect_Codeplug_for_MTR2000_PA = 0x1A, Temp_Alarm = 0x03, VSWR_Minor_Alarm = 0x13, VSWR_Major_Alarm = 0x14, Ext_Circulator_Temp = 0x25, PeerDisconnected = 0x107 32 Examples of the activation of the SNMP mode using CastleRock SNMP NMS see http://www.castlerock.com/products/snmpc/ 1. Installing custom MIBs in the SNMP Management Console. - Copy to the ...\SNMPc Network Manager\mibfiles\ folder all files from MIB folder (files should have the .mib extension). - Start the console and in the main menu choose Config->gt.Mib Database.... - In the dialog window click Add and choose necessary files from the list and click OK. - Recompile console MIB database by pressing Compile. 2. Adding TRBOnet Watch in the list of console monitoring entities - Choose Insert->gt.Map Objects->gt.Device... in the main menu. - In the dialog window specify IP-Address and Name for TRBOnet Watch and click OK. 3. Configuring SNMPv3 Protocol with the authentication and confidentiality - In Root Subnet choose Watch object, click on it with the right mouse button and select Properties. In the dialog window Access tab fill in the following fields: - Read Access Mode: SNMP V3 Priv-DES Auth-MD5 - Read/Write Access Mode: SNMP V3 Priv-DES Auth-MD5 - V3 Engineid: введите значение, указанное в конфигурации приложения TRBOnet Watch (значение по умолчанию 80000AD0431AF108) - V3 Auth/Prive Security Name, V3 Auth Passwd, V3 Priv Passwd - set the SNMPv3 user settings that are selected in the TRBOnet Watch Server configuration and click OK. 4. How to read a list of 1.3.6.1.4.1.9.9.138.1.2.5.1.3) alarms from a ceAlarmList (ceAlarmTable, Oid: This line consists of 32 bytes in hexadecimal format. Type of alarm is encoded by ordinal bit. The encoding line may look like this: 00 00 00 00 00 00 00 00 00 00 00 00 00 08 00 00 00 00 00 00 00 00 00 00 00 00 00 00 00 00 00 00 I.e. 13 * 8 + 3(00001000) = 107 (Peer Disconnected Alarm). Other types of alarms are defined similarly. If no alarms are set, the line will have zero length. 33 TRBOnet Watch Dispatch Console Launch TRBOnet Watch Dispatch Console using the shortcut on your desktop. Type in your credentials to connect to Dispatch Console: Connect to: Server Host – select the TRBOnet Watch server in the dropdown list or specify its IP Address. Port – specify command port of TRBOnet Watch (4019 set by default). For more details on Command port settings see Configure Network Parameters section. Check the box Connect on startup for automatic login to TRBOnet Watch Server without password prompting next time. 34 When Dispatch Console is running, it connects to TRBOnet Watch Server and by default the Live Monitor screen is displayed: 1 – Objects list. Allows select an object for monitoring in the list. 2 – Navigation Tree. Allows toggle between monitoring modes. 3 – Monitoring window. Displays monitoring results. 35 Dispatch Console Menu Dispatch Console menu allows to manage the main Dispatch Console options. It can be found in the upper part of TRBOnet Watch Console. File Select File Menu to connect to another TRBOnet Watch server or to use other credentials. Also, print and exit from TRBOnet Watch Dispatch Console options are available: 1. Connect to TRBOnet Watch Server. Select File, Connect to Server and set the connection parameters: Connect to: Server Host – select the TRBOnet Watch server in the dropdown list or specify its IP Address. Port – specify command port of TRBOnet Watch (4019 set by default). For more details on Command port settings see Configure Network Parameters section. Check the box Connect on startup for automatic login to TRBOnet Watch Server without password prompting next time. Click ‘’OK’’ to connect to a Dispatch Console. 2. Print – custom development. 3. Print Preview – custom development. 4. Exit. Select File > Exit to exit the Dispatch Console. 36 Tools Select Tools menu to manage the Dispatch Console: 1. Language. Select Language to change Dispatch Console’s language: Select language in the dropdown list and click ‘‘OK’‘. The changes will apply with the next launch of console. 2. Map Content. Select to specify the folder and settings to store Map Data: Map Files – click ‘‘Change’‘ button to select the folder on the PC to store the Map Data. Update – select data updating period. Note: when ‘‘0’‘value selected, the map will not update. Show cursor coordinates – select to view cursor coordinates in the popup window on map. Map Type – select your Map type in the dropdown list. For more details on maps used in TRBOnet Watch see Appendix A: Supported Map Types. Click ‘‘OK’‘ to save map cache settings. 37 3. Audio Settings. Select to set playback device and network interface: Device – select playback device in the dropdown list. Network interface – in case you have a number of network cards on your PC, select required network card in the dropdown list. Request Feature Select to send a message to TRBOnet technical support engineers. Help About – click to see your TRBOnet Watch info. 38 Repeater Monitoring TRBOnet Watch provides fully-functioned monitoring of repeaters, registered in the system. Live Monitor The Live Monitor interface (1) provides online monitoring, analyzing and filtering of all voice and data traffic on IP Site Connect and Capacity Plus systems. To view the system, select it in the Objects List (2). The Live Monitor interface shows the activity of the radio stations and repeaters in real time. 39 Slot View Slot View tab is available for IP Site Connect systems only. It displays the information from all peers in two slots windows. The data is presented on the diagram and in the table. 1 - Diagram The diagram shows the all radios activity of the slot for the last minute. The data packages (Voice, GPS, ARS, etc.) received by TRBOnet Watch Server are marked with different colors due to their type. There are the workload scale on the left of the diagram and RSSI level scale (in dBm) on the right. 2 - Table The table shows the data from all the slots of the selected system: Session Type Session Subtype Start Time Duration Sender Recipient Peer ID RSSI (dBm) 40 Toolbar Dispatcher can manage table data using table controls: 1. Click 2. Click to pause the monitoring. Click ‘’Run’’ to start the monitoring. to hide the Event Log records. Click to show all Event Log records. 3. Click button to group log records. Select column you want to group log records by. Drag and drop selected column header in the Grouping field. 4. Click to filter the data by a column. Type the data - criterion of filtering under the column header. To exit the filter mode click 5. Click 6. Click again. to apply default settings to the Event log records. to show or hide the legend (color icons of the diagram). 7. Click to view the messages sent by repeater via RCM protocol. These messages appear in the Event Log as System Messages to show the current state of the repeater. To exit RCM mode click again. To learn more about RCM see Diagnostics section. CALL TRANSMISSION STATUS Race Condition Failure Invalid/Prohibited Call Failure Destination Slot Busy Failure Subscriber Destination Busy Failure All Channels Busy Failure Other Unknown Call Failure Signal Interference Failure CWID in Progress Failure TOT Expiry Premature Call End Failure Transmit Interrupted Call Failure Higher Priority Call Takeover Failure Other Unknown Call Failure Simultaneous being on the air with another subscriber. Incorrect or forbidden format. Receiving slot is occupied. Subscriber is not available. All channels are busy. Broadcast of the calls into the air is intermitted. Interference in the radio network. Repeater is broadcasting CWID beacon. The timer of transmitting duration limit has gone off. Forced interruption. The call is over because of higher priority call. The reason is unknown. RCM REPEAT BLOCKED INDICATION Start of Signal Interference (FCC Type I) Signal interference is strong enough and begins blocking repeat (FCC Type I). End of Signal Interference (FCC Type I) Signal interference is weak enough and repeater resumes over the air repeat (FCC Type I). Start of Signal Interference (FCC Type II) Signal interference is strong enough and begins blocking repeat (FCC Type II). End of Signal Interference (FCC Type II) Signal interference is weak enough and repeater resumes over the air repeat (FCC Type II). Start of CWID/BSI Repeat The repeater has to transmit CWID/BSI and begins blocking repeat. End of CWID/BSI Repeat Broadcast of the calls into the air is intermitted. Signal Interference Failure The repeater finishes CWID/BSI transmission and resumes overthe-air-repeat. 41 8. Click to play a Voice Call (available for Voice Calls only). The following Player window appears: 9. Click button to export the voice recordings. Select the folder to export voice recording files as .wav file. Note: You may select dimensions of the diagram/table. Click on the board of the diagram/table and move it to set appropriate dimensions. 42 Peer View Peer View tab is available both for Capacity Plus systems and for IP Site Connect systems. It shows all the slots in the selected system. Select the system in the Objects List. 1 - List of slots. Shows all peers and slots. Click the slot to view the data on the diagram. If the peer loses connection with the server the slots turn red. 2 - Diagram. Shows radios activity in real time. The data packages (Voice, GPS, ARS, etc.) that TRBOnet Watch Server receives are marked with different colors due to their type. There are the workload scale on the left of the diagram and RSSI level scale (in dBm) on the right. You may listen to Voice Calls of the selected slot in real time mode. Select the slot in the list of slots. Click the right of the diagram. icon on Note: If you select another slot in the list of slots, this function will be turned off automatically. 3 - Table. Shows data of all the slots of selected system: Session Type Session Subtype Start Time Duration Sender Recipient Peer ID RSSI (dBm) Dispatcher can manage table data using table controls. For more details see Toolbar section. 43 Topology The Topology tab displays selected system's topology (Master, peers ID's and software peers connected to the Master). The system remembers all peers ever connected to the master. Go to Live Monitor (1) > Topology (2). Select Repeater or TRBOnet Swift Agent in the Objects list (3). 4 – Select system to display topology. The default topology displays all repeaters and remote control stations (TRBOnet Swift Agent) registered in the system. 5 – Select layout type. Available types are Circle, By layers, By groups, Radial, Type 1, Type 2. 6 – Set Topology zoom. You may change it using the scroll wheel or zoom scale. Click icon to display full-scale topology. Click icon to display current Topology centrally. Right-click the peer and select Remove Peer from the Map to delete selected peer. Right-click any peer and select Remove All Disconnected Peers to delete all disconnected peers. 44 Click the peer to view the information popup window: Peer Name Peer ID IP address Port Number Services Slot 1 Slot 2 Every peer has icons with Peer ID and Type of the system. 45 Diagnostics Diagnostics tab allows to monitor repeaters’ state and gather real-time repeaters hardware failure reports via alarm messages sent by repeater. Also, Dispatcher can manage some repeater parameters (e.g., Write TX Power and Status to the repeater). 1 – Monitored System (s)’ Peers table. Allows Dispatcher to view advanced repeater parameters, e.g., Firmware and Protocol version etc. The icon shows peer state - connected. Show software peers. By default Dispatcher can see only Hardware peers’ (repeaters) parameters on the Diagnostics tab. Click Show software peers to display all peers of all systems, including TRBOnet Watch connections. 46 2 – Remote Control mode. Allows Dispatcher to manage repeater parameters: Remote Control Channel TX Power State Repeater Alarms Reset Write Allows selecting the current channel of the repeater and allows switching to another preprogrammed one. Select High when a stronger signal is needed to extend transmission distances. Select Low to communicate in close proximity, and to prevent transmissions into other geographical groups. Select Enabled to allow repeater to transmit, receive and repeat operations. Select Disabled to forbid repeater to transmit, receive or repeat. In the Disabled mode repeater responds to GPIO controls, such as channel steering and to alarms and diagnostics. Shows repeater parameters state. - Repeater alarm functions normally. Click the item for details. Updates selected repeater parameters state. Saves repeater configuration. Reloads repeater configuration. Show channels – shows repeater preprogrammed channels table. 3 – Repeater preprogrammed channels. Shows channels set in repeater codeplug with advanced parameters (e.g., Bandwidth, TX Timeout, etc.). Indicates selected channel with green color. Dispatcher can change repeater’s channel configuration parameters (Channel, TX Power, State) using Remote Control mode. 47 TRBOnet Swift Agent Monitoring TRBOnet Watch provides fully-functional monitoring of Swift Agents, configured in Server Configurator. Stations Stations tab displays all voice and data traffic via TRBOnet Swift Agent. Go to Live Monitor (1) > select Remote Stations in the Objects List (2) > Stations tab (3): The Stations tab shows the activity of the radio stations and connected Swift Agents in real time. Dispatcher can manage table data using table controls. For more details see Toolbar section. 48 Diagnostics On the Diagnostics tab Dispatcher can see connected TRBOnet Swift Agent properties and monitor the status of TRBOnet Swift Agents and gather real-time hardware failure reports via alarm messages sent by agent. Mototrbo Station Proxies. In the table Dispatcher can view current state of connected TRBOnet Swift Agent. Show channel and Remote Control mode are unavailable for TRBOnet Swift Agent. Mototrbo Station Proxy Status - displays current device PINs state. 49 Topology For more details see Topology section. Physical GPIO Pins Go to Physical GPIO Pins tab to view current TRBOnet Swift Agent Pins state. 50 Reports Reports tool provides various printing forms of monitored radio network activity data reports: Report Types Overview TRBOnet Watch supports the following report types: All Data report. Shows all system data according to report filter. Traffic Sources report. Shows amount and duration of Voice Calls, GPS and ARS packages sorted by Radio ID according to report filter. Group Traffic Sources report. Shows amount and duration of Voice Calls sorted by Group ID according to report filter. Event Viewer. Shows all events with description sorted by system according to report filter. Text Messages. Shows all text messages with details according to report filter. Repeater Call Monitoring. Shows RCM messages with details according to report filter. Note: enable Store Repeater Control Messages (RCM) option. For more details see Data Persistence section. System Blackouts. Shows system blackouts according to report filter. For more details on blackouts monitoring configuration see Data Persistence section. Note: available for Capacity Plus systems only. 51 Creating Custom Report Filter You can set custom filter to display report data and then save this filter. Filter – select default filter ‘’Allow All from Yesterday’’ (shows the data from all registered systems and slots from yesterday) or select custom filter, which allows you to save each filter parameter (e.g. Range of Subscribers and Data Range and Time) as a profile and then apply it to the selected reports. 52 Conditions – sets available system, slots and subscribers to include the selected report type. The default view: All systems are included in the report by default. Right column controls: 1 – Removes all items from the list to the left column. You can also click ‘’Remove All’’ button. 2 – Maximizes allowed items view (shows peers). 3 – Removes selected system from the list. You can also click ‘’Remove’’ button. You can select items to include in the report in the left column: Select system or peer in the list and click selected item in the report. button to add 53 Subscribers – allows filter the data from selected subscribers. 1 – Maximizes subscriber window. 2 – Maximizes subscribers’ dropdown list. Allow all subscribers – select to include all subscribers’ data to the report. Specified subscribers – Type in Subscriber ID to include selected subscriber data to the report. Range of subscribers – select subscribers range to include in the report. Subscribers by mask – Click button for more details. Data Range – allows to set time interval for the report. Select time interval criteria in the dropdown list (between, before or since) and select the date(s). Data range + Time – allows to set exact time period (date and time) for the report. Click ‘’Apply’’ button to apply selected filter parameters. Click ‘’Save as’’ button to save filter profile. To generate report, click button. 54 Toolbar Dispatcher can manage table data using table controls: 1. Click 2. Click button to print the selected report. button to select the report format in the dropdown list. 3. Click button to group report data. Select column you want to group report data by. Drag and drop selected column header in the Grouping field. 4. Click to filter the data by a column. Type the data - criterion of filtering under the column header. To exit the filter mode click 5. Click again. to apply default settings to the report data. 55 Analytics The Analytics interface allows viewing and analyzing the system statistics. 1 – Analytics Report Types. 2 – Filter and Settings. Allows applying filters to selected statistic type. Note: for RSSI analytics reports button available. For more details see RSSI Levels: All Data, RSSI Levels: GPS Only and RSSI Levels: Map sections. 3 – Analytics Main Window. Allows viewing generated analytics reports. 56 Statistic Types TRBOnet Watch supports different Analytic report types. Data Overview Shows details on traffic depending on data type (Voice, GPS, Registration, etc.) and channel loading by days and hours. 1 – Data traffic diagram. The x-axis represents time period, the y-axis represents channel loading value in %. 2 – Channel loading schedule for a selected time period. Click the selected day on the schedule to see the details per calendar day: 57 Traffic Sources Shows details on traffic and subscribers’ activity. 1 – Traffic overview diagram. Shows statistics for the "Top 5" system items. Left-click selected diagram sector for more details. 2 – Subscribers activity table. Shows amount and duration of voice calls, GPS and ARS packages and total activity according to selected filters. 58 Group Traffic Sources Shows statistics on call types (group and broadcast calls) and voice traffic details for each group. 1 – Groups activity overview diagram. Shows statistics for the "Top 5" system items. 2 - Groups activity table. Shows amount and duration of voice calls according to selected filters. 59 RSSI Levels: All Data RSSI - received signal strength indicator. Measures radio signal loss from one map point to another. RSSI map can be used by radio systems engineers to plan further radio network extension. To generate the report set RSSI levels clicking button: Specify values, add description and select color for RSSI level. Click ‘’Add’’ button to add new RSSI level. Click ‘’Remove’’ to remove selected RSSI level from the list. Click ‘’Defaults’’ button to apply default settings. Click ‘’OK’’ to save changes. 60 The report generates automatically. 1 – RSSI data review diagram. 2 – RSSI data review graph. 61 RSSI Levels: GPS Only Shows statistics on GPS RSSI levels. To set RSSI level, see RSSI Levels: All Data section. 1 – RSSI data review diagram. 2 – RSSI data review graph. 62 RSSI Levels: Map Shows statistics on RSSI levels on map. Click button to set RSSI levels. 1. On the Maps tab you can select map in the list or add custom map: Select map in the list to add one of supported maps. Click ‘’Add’’ button and select ‘’Add Online Map’’ to add predefined or custom online map: Name – add name for new map. Type – select Predefined to add an online map from the dropdown list. Select Custom to add an online map by URL. Type in map URL, as shown in the example. Z – zoom. Type in zoom value for the map. X – coordinate in X –direction. Y – coordinate in Y – direction. Click ‘’OK’’ to add a map. 63 Click ‘’Add’’ button and select ‘’Add T-Map’’ to add the internal map-making resource. For more details on supported map types see Appendix A: Supported Map Types. 2. On the RSSI Coverage tab set signal strength levels (RSSI) displaying on map: Symbol – select displaying on map type in the dropdown list. Points – select to display RSSI level on map as dots that represent coordinates points for more detailed data view. Regions - select to configure RSSI zone in meters and display on map average data of RSSI level GPS coordinates for more common data view. Specify values, add description and select color for RSSI level. Click ‘’Add’’ button to add new RSSI level. Click ‘’Remove’’ to remove selected RSSI level from the list. Click ‘’Defaults’’ button to apply default settings. 64 On the Advanced tab set advanced parameters for RSSI levels configuration: Online maps Cache folder – select folder on the local PC to save map cache data. Update – select map updating interval. Bing key - user can try BING Maps for 90 days and then get a Basic Key. Visit http://msdn.microsoft.com/en-us/library/ff428642.aspx to get a Basic Key. Common Map overlay – select fill for map overlay. Color – select color for map overlay. Transparency – select transparency level for map overlay. Show cursor coordinates – check to display current cursor coordinates on the map. Click ‘’OK’’ to save changes. 65 The report generates automatically. 1 – Zoom in/out a map. 2 – Points/Regions size scale. Allows change points size in pixels and regions size in meters. 3 – Available maps list. 4 – Map Toolbar. Map Toolbar - Toggles between map regions. - Ruler tool to measure a distance. - Enables/disables fill tool for the map to allow searching quickly RSSI levels on map. - Toggles between RSSI level displaying modes: points and regions. 66 System Blackouts Review Blackout is a time period when all channels busy in Capacity Plus and Linked Capacity Plus systems. For more details on blackouts monitoring configuration see Data Persistence section. Channels Employment Shows details on channels busy in the system: 1 – Channel busy diagram. The x-axis represents time period, the y-axis represents maximum number of busy channels. 2 – Channel busy sorted by peers and slots. Note: The x-axis of diagram (1) synchronized with certain channels employment chart (2). 67 Click the selected day on the schedule to see the details per calendar day: Channels Employment: Average Shows details on total values of channels busy in the system. For more details on report parameters see Channels Employment section. 68 Voice Recording Go to Voice Recording page to listen to any voice call in the system. Voice Recording Filter System Period Call Type Sender Recipient Select system to show voice recordings from. Select period in the dropdown list or set custom period using from… to… filters. Select type of voice recordings to show (Private Calls, Group Calls, etc.). Select sender (Radio ID or Radio Alias) to show voice recordings from. Select recipient to show voice recordings. Click ‘’Search’’ button to show voice recording files according to filter. 69 Toolbar Dispatcher can manage voice recordings table data using table controls: 1. Click button to print the report on voice logging files. 2. Сlick button to group log records. Select column you want to group voice recording by. Drag and drop selected column header in the Grouping field. 3. Click button to filter the data by a column. Type the data - criterion of filtering under the column header. To exit the filter mode click again. 4. Click button to apply default settings to the voice recording files. 5. Click voice recording files. button to export the voice recordings. Choose the folder to export 70 To Playback a Call Select Call in the list (1) and click ‘’Play’’ button (2): 71 Administration The interface allows to manage database backup, to assign Aliases for Radios, Groups and Peers, to configure E-mail Notifications and to view current License details. Database Go to Administration (1) Database (2) to view database parameters and backup the database: Click ‘’Backup’’ (3) to backup the database: Back Up database – select to allow database backup. Delete data received before – select to remove audio files and data from database. Select the date. Click ‘’OK’’ to start database backup. 72 Aliasing Go to Administration (1) Aliasing (2) to assign aliases for system units to display in the Dispatch Console: 73 Toolbar 1. Click 2. Click button to see the list of all subscribers. button to filter the data by a column. Type the data - criterion of filtering under the column header. To exit the filter mode click 3. Click 4. Click again. button to apply default settings to the aliases table. button to print the aliases table. Radios On the Radios tab you can assign aliases for radios: Select radio type (Not Selected/Portable/Mobile) in the ‘’Type’’ column. Type in an Alias for radio in the ‘’Alias’’ column. 74 Groups On the Groups tab you can assign aliases for radio groups: Type in a Unit ID. Type in an Alias for radio group in the ‘’Alias’’ column. 75 Peers On the Peers tab you can assign aliases for peers: Type in a Unit ID. Type in an Alias for peer in the ‘’Alias’’ column. 76 Notifications Go to Administration (1) Notifications (2) to see the list of system events and to configure Email notifications: 3 – Hit ‘’Configure’’ link to set notifications parameters. 4 – Hit ‘’Turn on/off’’ link to enable/disable email notifications. 77 Configuring Alarms On the Alarms tab set parameters for Default and RDAC alarm notifications: For default notifications select True or False values in the dropdown list to send alarm notification. For RDAC notifications select one of the following: None – do not send alarm notification. Detected – send alarm notification when selected parameter was changed. Released – send alarm notification when selected parameter comes to the default state. Both – send alarm in case of both: ‘’Detected’’ and ‘’Released’’ states. 78 Sound Notifications On the Sound Notifications tab set parameters for Default and RDAC sound notifications: Select notification type in the dropdown list. 79 Email Configurations Configure SMTP server parameters and recipient list. SMTP Server is intended to send emails from users to mail servers and between mail servers for further delivery to the recipient. To receive emails you need to use POP3 server. For example, Administrator enables email notifications from TRBOnet Watch to particular email users in case of Alarms on selected radios. At this case, radio sends alarm to TRBOnet Watch RadioServer which converts alarm to text and forwards it as email to particular email addresses (e.g. [email protected]). Outgoing Email Settings SMTP server host or IP – Simple Mail Transfer Protocol is the protocol for email transmission via IP networks. server host (e.g. smtp.gmail.com for gmail) or IP (e.g. 77.232.61.123) to send emails. SMTP server port the default port is 25. Can be used in case server does not require secured connection. Port value depends on mail system you are using, e.g., for gmail SMTP server port is 465 with SSL. Use SSL – select to use a secure connection to selected SMTP server (use special port to connect a mail server). 80 Authentication Type: Anonymous access – select to use an anonymous access to connect SNMP server. Windows authentication – select to connect with Windows authentication to connect SNMP server. Use SMTP user name and password – select if you are going to connect to SMTP server using an existing user name and password. User name – type in the SMTP user name. Password – type in the SMTP password. Recipient List Sender – input email address to send test email to. Equal to field ‘’From’’ when a user receives email. Recipients – click ‘’Add’’ button to add recipient email address (e.g. [email protected]). «Send Test Message» – click to send a test message from email address specified in «Sender» field to a selected email. Click ‘’OK’’ to save changes. 81 License Go to Administration (1) License (2) to see your current license limitations: 82 Appendix A: Supported Map Types Online maps: OpenStreetMaps – free online map. Includes MAPNIK, CYCLE, TRANSPORT, LANDSCAPE and MAPQUEST subtypes. For more details on OpenStreetMaps visit official web site: http://www.openstreetmap.org Microsoft BING – commercial maps from Microsoft. Includes BING_ROAD, BING_AREA and BING_HYBRID subtypes. User can try BING Maps for 90 days and then get a Basic Key. Visit http://msdn.microsoft.com/en-us/library/ff428642.aspx to get a Basic Key. Offline Maps TRBOmap – internal map-making resource. User can customize a part of online maps according to requirements. For more details on map calibration go to TRBOnet knowledge base and read the following article: http://kb.trbonet.com/public.pl?Action=PublicFAQZoom.ItemID=27. TMap – internal map-making resource. User can create an offline copy of online maps for selected region according to requirements. User can create a map using any picture via TRBOnet.Map Edit tool. Go to C:\Program Files\Neocom Software\TRBOnet Watch\TRBOnet.MapEdit.exe. For more details on map calibration go to TRBOnet knowledge base and read the following article: http://kb.trbonet.com/public.pl?Action=PublicFAQZoom.ItemID=28. MapLib map format – free offline map. Requires a lot of internal memory. Requires Franson GpsTools. For more details on Franson GpsTools visit the official web site: http://fransongpstools.software.informer.com/2.3/ 83