1
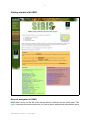
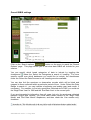
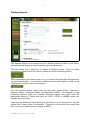
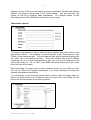
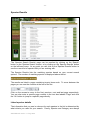
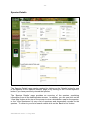
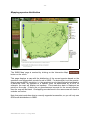
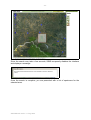
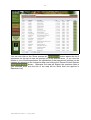
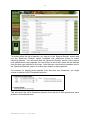
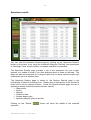
-1-
S I B I S User Manual
SIBIS Manual version 1.1 Aug 2009
-2-
Contents
S I B I S User Manual..............................................................................................................1
Contents..................................................................................................................................2
About SIBIS: SANBI’s Integrated Biodiversity Information System...................................3
Background............................................................................................................................4
Basics.....................................................................................................................................5
Contact the team.................................................................................................................5
Did you know...?....................................................................................................................5
Getting started with SIBIS.....................................................................................................6
General navigation in SIBIS..............................................................................................6
Checking your context.......................................................................................................7
Overall SIBIS settings........................................................................................................8
SIBIS Data Sources..............................................................................................................10
Acocks ............................................................................................................................10
CREW (Custodians of Rare and Endangered Wildflowers)............................................10
SANBI’s DNA Laboratories............................................................................................10
Garden Accessions...........................................................................................................10
MSB (Millennium Seedbank)..........................................................................................11
PRECIS (Pretoria Computerised Information System)....................................................11
Protea Atlas......................................................................................................................11
Species Status Database...................................................................................................12
TSP (Threatened Species Programme)............................................................................12
SIBIS Statistics.....................................................................................................................13
Finding Species....................................................................................................................18
Taxonomic criteria...........................................................................................................19
Common Name criteria....................................................................................................20
Threatened Status criteria.................................................................................................21
Specimen Results criteria.................................................................................................21
Species Results.....................................................................................................................23
Listed species details........................................................................................................23
Sorting your results..........................................................................................................24
Viewing a species.............................................................................................................24
Refining your search........................................................................................................24
Species Details.....................................................................................................................25
Mapping species distribution...............................................................................................29
Selecting layers................................................................................................................30
Zooming and moving the map.........................................................................................30
Downloading the specimen shapefiles.............................................................................30
Using the map to select specimens...................................................................................31
Using the map to build a species checklist.......................................................................33
Specimen results...................................................................................................................38
Specimen details...................................................................................................................40
Frequently Asked Questions................................................................................................42
SIBIS Manual version 1.1 Aug 2009
-3-
About SIBIS: SANBI’s Integrated Biodiversity Information System
SIBIS is a product of the South African National Biodiversity Institute (SANBI)
developed by the Biodiversity Information Management team.
SIBIS is the gateway to SANBI's biodiversity information, and information shared by
SANBI partners. SIBIS provides access to over 1.6 million species occurrence
records and comprehensive coverage of South Africa’s 22 000+ plant species.
Animal species are being added as they become available.
SIBIS offers:
• Threatened species information
• Distribution maps
• Area checklists
• General species details
SIBIS focuses on species and specimen information; for landscape and mapping
information you may wish to try Biodiversity GIS, http://bgis.sanbi.org.
SIBIS contains information from a number of SANBI databases:
•
•
•
•
•
•
•
•
•
Acocks (plant species observations)
CREW (threatened plant species localities)
DNA laboratories (plant and reptile DNA accessions)
Garden Accessions (plant collection records)
MSB (plant seed collection records)
PRECIS (taxonomy and herbarium specimens)
Protea Atlas (Proteaceae species occurrence records)
Species Status (NEMBA-listed species)
TSP (threatened plant species)
Further data sets will be added over time.
Note that sensitive information is not shown. For example, we don’t show the
precise localities of species (though this may change in the future for non-sensitive
species).
SIBIS is a new product, launched in June 2009. Please let us know if you have other
requests or features that you think we should add. Contact information is listed on
the website.
SIBIS Manual version 1.1 Aug 2009
-4-
Background
SIBIS was first conceptualised in 2005. A version of SIBIS based on that concept
was available to SANBI staff from November 2008; this version included much detail
from the PRECIS database, but only two other data sources (TSP and CREW). For
information about these databases, please see the ‘SIBIS Data Sources’ section of
this manual.
Through the experience of launching this first version of SIBIS, we decided to rearchitect SIBIS for public release.
SIBIS version 1: Species details page
The current public version of SIBIS was re-architected and built from the ground-up
by SANBI staff. The system is written in Java TM using the NetBeans1 development
environment. We use an open-source mapping tool called OpenMapTM, and the
MySQLTM database platform. As a consequence, there are no licensing costs for
SIBIS, since it has been built entirely from free and open-source components.
1
Java and NetBeans are registered trademarks of Sun Microsystems; OpenMap is a trademark of
BBN Technologies; MySQL is a trademark of MySQL AB
SIBIS Manual version 1.1 Aug 2009
-5-
Basics
http://sibis.sanbi.org
SIBIS is a website, not a desktop application. SIBIS is accessible on the World Wide
Web using any modern browser, including Internet Explorer (IE), Firefox and Opera.
While we hope that anyone can use SIBIS successfully, the site does not fully
comply with Web Content Accessibility Guidelines (WCAG 2.0). Users who are
experiencing difficulties accessing any part of the site are encouraged to let us know
and we will attempt to resolve the issue as soon as possible.
Contact the team
Selwyn Willoughby
Director: SANBI Biodiversity Information Management
[email protected]
Reuben Roberts
SIBIS Coordinator
[email protected]
Henry de Lange
SIBIS Developer
[email protected]
Did you know...?
SIBIS has currently over 1.6 million specimen records from SANBI’s databases.
We regularly add new SANBI datasets.
You can get a species list for plants found on the Cape Peninsula from SIBIS.
This version of SIBIS was entirely produced with free and open-source software,
starting in late 2008.
SIBIS is undergoing constant development, so if you have ideas please let us
know!
SIBIS Manual version 1.1 Aug 2009
-6-
Getting started with SIBIS
General navigation in SIBIS
SIBIS has a menu on the left of the screen which is broken into two main parts. The
green items are the same whenever you look at them, and provide information about
SIBIS Manual version 1.1 Aug 2009
-7-
SIBIS in general. The yellow and red menu items will show different things
depending on what you have been doing on the site.
To search for a species, click on the ‘Species Search’
button. Once
you have found a species you are interested in, you can view its details, and then
click on the ‘Interactive Map’
button to see a distribution map of its
specimens and observational data. You can also click on the ‘Specimen Results’
button to see a list of its specimens, and from there view the details of
any specimen.
At any time you can click on the ‘Species Results’
button to see the list
of species found in your last search. Similarly, you can always click on the ‘Current
species’
button to see the particular species that you are currently
working with. The mapping and specimen buttons work in the same fashion: they
will show you your current map and specimen respectively.
Checking your context
If at any point you are not sure of what you are seeing, or how you reached that
point, then you should click on the ‘Where am I?’
button. This will popup a window with a summary of your SIBIS status.
The Information panel shows your current species selection and the criteria that you
used to find it. The number of species and specimen results are shown at the bottom
of the panel. For more information on how your actions may affect your context,
please see ‘Why has my current species changed?’ in the Frequently Asked
Questions section.
To change the active data sources and other settings, click on the ‘Search options’
button.
SIBIS Manual version 1.1 Aug 2009
-8-
Overall SIBIS settings
Click on the ‘Search options’
button on the menu to reach the ‘Search
Options’ page. This page allows you to set what data SIBIS will include for your
session.
You can specify which broad categories of data to include by toggling the
checkboxes
below the ‘Select the Categories to search in’ heading. For more
specific control over which databases you would like to include, the checkboxes
under the ‘Select the Data Sources to use’ heading are also available.
You can also limit the specimen or observation records which will be listed and
mapped to those collected within a particular period of time. Under ‘Select the Date
Range to search in’, you can indicate a beginning and ending year (and month, if
necessary). For example, to find only specimens collected since 1980, you could set
the ‘Begin Date Year’ to 1980 and the ‘End Date Year’ to the current year.
If you are interested in information from all years, but only for specimens collected
between August and October, you could select those months in the ‘Begin Date
Month’ and ‘End Date Month’ dropdowns, and then check the ‘Use months only’
checkbox.
SIBIS Manual version 1.1 Aug 2009
-9-
Finally, click the ‘Confirm’ button to save your new settings. The new results will be
automatically loaded into your specimen and species result lists.
SIBIS Manual version 1.1 Aug 2009
- 10 -
SIBIS Data Sources
Acocks
This database represents the computerisation of all John Acocks' field
notes. Acocks' initiatives in the 1940's and 1950's to document and map
the vegetation of South Africa had a significant effect on ecology in the country. The
database comprises over 250 000 observation records for over 3 000 sites.
For more information on Acocks email Mike [email protected].
CREW (Custodians of Rare and Endangered Wildflowers)
The CREW Programme collates site-based information for threatened
species, including population statistics and threats to the populations from
aliens or development. The CREW database comprises details of over 2 000 site
visits and over 14 000 occurrence records.
For more information on CREW email Ismail [email protected].
SANBI’s DNA Laboratories
The Lesley Hill Laboratory is the main facility for SANBI's Molecular
Ecology and Evolution Program (MEEP). The laboratory also houses a
national DNA bank for plants, and a tissue bank for South African reptiles
in connection with the Southern African Reptile Conservation Assessment.
As of end 2008, the database comprised details of over 2 000 animal
tissue accessions and close to 5 000 plant accessions.
For more information on the DNA Laboratories email Krystal [email protected].
Garden Accessions
The Garden Accessions database contains records of all plants collected
and planted in SANBI's 9 botanical gardens. At present the Pretoria and
Kirstenbosch gardens’ accessions are available on SIBIS, each contributing over
25 000 plant records.
For more information
[email protected].
SIBIS Manual version 1.1 Aug 2009
on
the
Garden
Accessions
email
Anthony
- 11 -
MSB (Millennium Seedbank)
In 2000 the Royal Botanic Gardens, Kew signed an agreement with the
South Africa National Biodiversity Institute (SANBI). The initial 5 year
agreement aimed at conserving (ex situ) the seed of indigenous plant species from
South Africa's flora in the Millennium Seed Bank. This agreement was renewed in
2005 for a further five years until 2010.
The overall objectives of the South African Project are to:
• Collect and conserve 2 500 of South Africa's flora by 2010, at least 80% of
those being endangered, economic or endemic species.
• Develop capacity in South Africa in support of seed conservation.
At the end of 2008, the Project had already collected and conserved over 3 000 seed
collections, representing an estimated 2 100 species in the Millennium Seed Bank.
Approaching the end of Phase 2, plans are underway to develop a strategy that will
take the Project beyond 2010.
PRECIS (Pretoria Computerised Information System)
PRECIS is based at the National Herbarium in Pretoria. The PRECIS
project mission is to develop, maintain and expand an electronic database
system on southern African plants for the provision of an efficient customer-driven
information service and for producing computer-generated electronic and publishable
products through PRECIS (National Herbarium Pretoria (PRE) Computerised
Information Service). This activity is administered from the National Herbarium in
Pretoria (PRE) where the complete southern African collection, from the region south
of the Limpopo and Kunene Rivers, has been computerised and, now complete,
covers 736 424 specimens in 24 500 taxa (species and infraspecific). The cultivated
collection of 21 169 sheets is computerised separately. The rest of the African
holdings will be added to the database in the near future under the SABONET
programme.
For further information on PRECIS email: [email protected].
Protea Atlas
The Protea Atlas Project records the geographical location of Proteas
throughout southern Africa for the benefit of conservation, rural
communities, farmers, reserve managers, tourism, the cut flower trade and botany.
Over 250 000 sight records from 60 000 localities of 380 Proteaceae species and
400 hybrids are recorded.
For more information on Protea Atlas email Tony [email protected].
SIBIS Manual version 1.1 Aug 2009
- 12 -
Species Status Database
SANBI's Species Status Database provides a centralised storage location
for information on the status of South African species. The database
provides basic information pertaining to the relevant species such as
descriptions of their habitat, common names and distribution ranges. Amongst
others, it will provide information on the status of species under the various
legislation that govern species in South Africa as well as IUCN red data list
assessments of the conservation status of species.
For more information on the database and the legislation governing species in South
Africa
as
well
as
IUCN
red
data
list
assessments
go
to
http://www.speciesstatus.sanbi.org or e-mail [email protected].
TSP (Threatened Species Programme)
The Threatened Species Programme collates assessment information for
South African plant species that may be threatened or subject to pressure
from harvesting or trade. The TSP database contains detailed assessments for over
6 500 species.
For more information on TSP email Tilla [email protected].
SIBIS Manual version 1.1 Aug 2009
- 13 -
SIBIS Statistics
SIBIS contains species and specimen information for both plants and animals. The
tables and figures below show the range of the data which is available. For the
latest up-to-date statistics please visit the ‘Statistics’ page on the SIBIS site.
Category
Species
Plant
Animals
Species synonyms
Specimens
54 685
42 821
1 649 030
787
0
2 630
Table 1: Overall numbers of plant and animal species, synonymous names and specimens
Fig. 1a: Number of species by category
Fig.1b: Number of specimens by category
As you can see from Table 1 and Figure 1, the overwhelming majority of SANBI’s
data is still plant-oriented. This is an artifact of its historic mandate as the National
Botanical Institute and its predecessors. In future, additional animal-related data
may be added to SIBIS through SANBI's network of partners.
Data source
Last updated Species names
Specimens or
observations
Georeferenced
QDS or better
Acocks
2009
7 524
289 488
100.0%
Animal DNA
2009
412
2 630
83.1%
CREW
2009
2 847
17 487
98.0%
Gardens
2009
9 657
53 463
43.2%
Molecular Lab
2009
2 956
4 804
4.1%
MSB
2009
2 816
3 647
83.6%
SIBIS Manual version 1.1 Aug 2009
- 14 -
PRECIS
2009
52 687
1 014 664
78.6%
Protea Atlas
2009
631
265 477
100.0%
Species Status
2009
830
0
TSP
2009
22 119
0
Table 2: Data breakdown by data source
Fig. 2a: Number of species by data source
Fig 2b: Number of specimens and observations by data source
Table 2 and Figure 2 indicate the spread of data between the various databases.
PRECIS is a major source of plant specimen and species names, while Acocks and
Protea Atlas have significant plant observation holdings.
Fig. 3: Shared species: the percentage of species that are found in [n] data sources
SIBIS Manual version 1.1 Aug 2009
- 15 -
Fig. 4: Percentage of specimens or observations collected by decade (X-axis value indicates end of
decade in question)
Figure 4 demonstrates how recent is the initiation of SANBI’s non-plant related work,
compared to the age of the herbarium holdings (over 47 000 specimens were
collected before 1900!). The ‘spikes’ in plant records in the 1940s and 1950s reflect
Acocks’ contributions over and above the ongoing herbarium specimen encoding
work. The spike in the 1990’s reflects the Protea Atlas Project, which gathered many
observation records for members of the Proteaceae family.
Fig. 5a: Number of specimens or observation records per QDS (Region)
SIBIS Manual version 1.1 Aug 2009
- 16 -
Fig 5b: Number of specimens or observation records per QDS (South Africa)
Figure 5 illustrates the collecting intensity of SANBI’s data holdings, with some
quarter-degree squares (QDS’s) having over 15 000 distinct specimens and
observation records. On the other hand, there are still QDS’s in South Africa that
have seen no recorded activity (e.g. 3021CA, 2920CC, 2921BA, 2721DA, B and C),
and the spread of data is thin outside the borders of the country. The figures also
provide an indication that all data is not necessarily accurately geocoded, with
obvious errors placing records in the oceans. There is ongoing work to correct these
errors, and SIBIS will assist in bringing them to light.
SIBIS Manual version 1.1 Aug 2009
- 17 -
Figure 6: Threatened species (IUCN, CITES or NEMBA listed) per QDS
Figure 6 illustrates the distribution of all species within SIBIS listed by the IUCN,
CITES or NEMBA. This provides a dramatic snapshot of the areas within South
Africa that are most in need of conservation to preserve these species, although the
intensity of collection activity must also be taken into account, particularly in less
visited areas that may support as-yet unknown sensitive species.
SIBIS Manual version 1.1 Aug 2009
- 18 -
Finding Species
The Species Search is accessed from the ‘Species Search’ button on the menu.
Use the Species Search to find the species you are interested in.
The form allows you to search by a number of different criteria. Once you have
entered the criteria click on the ‘Search’ button to see the matching species.
SIBIS remembers your search terms, so if you return to the page they will appear as
you last entered them. You can then modify them and search again, or click on the
‘Clear search’ button to start a new search.
You can combine search criteria from the four main groups shown: Taxonomic,
Common Name, Threatened Status and Specimen Results. For example, to find
threatened species within the Poaceae taxonomic family, you could enter the
appropriate details in Family and pick an IUCN, CITES or NEMBA status (as
needed) for your search.
There may be additional criteria which you would like to use to find species, such as
growth form, flower colour or endemism. Please let us know what you would like
and it may be included in future versions of SIBIS.
SIBIS Manual version 1.1 Aug 2009
- 19 -
Adjacent to each of the four main search groups is a checkbox
which will indicate
whether that group is being used in the current search. You can manually turn
criteria on and off by toggling these checkboxes. The ‘Search criteria’ on the
Information panel will list the active criteria that you are using.
Taxonomic criteria
To search using taxonomic criteria, enter the taxon name or part of the name in the
appropriate text box. For example, to find all species in the Protea genus, enter
‘Protea’ in the Genus text box. To find all species with specific epithets starting with
‘afr’, enter ‘afr’ in the Species text box. To find all species with specific epithets
containing ‘afr’ (e.g. to find ‘austroafricana’), then you must put the wildcard at the
start of your entry, i.e. ‘*afr’ or ‘%afr’, since SIBIS otherwise assumes that your entry
forms the start of the name.
When searching, you don't need to enter complete names, so you could use 'Aco'
and 'op' for Genus and Species respectively if you were interested in finding the
species Acokanthera oppositifolia.
If you would like to pick from the genera within a family, enter the family name (or
part of the family name) in the Family text box and then click on the ‘Show list’ link
next to the Genus text box to see a list of genera.
SIBIS Manual version 1.1 Aug 2009
- 20 -
You can use the same technique to see a list of species within a genus.
If you are unsure of the spelling of a family, genus or species, you can enter a few
letters (with or without wildcards), and click the adjacent ‘Show List’ link. A list of
matching entries will then be shown.
To remove the drop-down list of options so that you can again type in the box, click
on the ‘Show Text Box’ link.
By default, SIBIS will find species names for both current species and synonyms in
your search results. If you want to omit the synonyms, toggle the ‘Name status’
options to ‘Is Current’. (Note that this does not affect the dropdown lists described
above, which always show all possible names.)
Conversely, if you want synonymous names, select ‘Is Not Current’ from the Name
Status options.
Common Name criteria
Enter a common name or part of a common name. In the search above, species
commonly called ‘Woodland mouse’ as well as ‘mouse barley’ will be returned.
Selecting a language from the drop-down list will ensure that the results are
restricted to only that language. Because we do not have equal coverage of names
in various languages, not all are included in the drop-down. There may be entries in
other languages, but not enough at present to justify their inclusion as a search
SIBIS Manual version 1.1 Aug 2009
- 21 -
criterion. Hopefully as the quality of the data improves we will be able to review this
to include further South African languages as distinct options.
Threatened Status criteria
The Threatened Status options allow you to filter the species by their South African
threat status. You can pick from the categories defined by the IUCN, CITES or
NEMBA. In general these will be the most recently defined categories in use by
these organisations, though certain additions may be made for local terminology
(e.g. ‘Rare’). Note that the categories are local, so ‘Extinct’ means ‘Locally extinct’
as opposed to globally extinct!
If you select an option for more than one threat listing (e.g. IUCN and CITES), then
you will find species which match according to either of these criteria, not those
species which appear on both lists.
By default, SIBIS searches for species matching the option you have selected. If
you would like to find species that are more threatened than the option you have
selected – for example to find all species with an IUCN status of Endangered,
Critically Endangered, Extinct in the Wild or Extinct – then you can use the
checkboxes to the right of the three dropdowns. Select ‘All species more threatened
than selected status’ to perform this search.
Included on the lists are useful composite criteria. For the IUCN you can select
‘Threatened’ which includes species which are vulnerable, endangered or critically
endangered. For CITES picking ‘Any’ will include all species listed on any of the
appendices. NEMBA option ‘Listed’ will include all species listed by NEMBA.
You may also tick the right hand three checkboxes to find all species which have
simply been classified according to IUCN, CITES or NEMBA criteria.
Specimen Results criteria
SIBIS Manual version 1.1 Aug 2009
- 22 -
The ‘Specimen Results’ criteria are used in conjunction with the Interactive Map to
limit the species returned to those with specimen or observation records found within
a particular area, in addition to any other criteria you may define on the Species
Search page.
This allows you to search for, for example, threatened species that are found in the
Kogelberg, or Agapanthus species in East London.
More detail on how to include this in your searches will be described in the Mapping
Species Distribution section of the guide under ‘Using the map to build a species list’.
SIBIS Manual version 1.1 Aug 2009
- 23 -
Species Results
The ‘Species Search Results’ page can be reached by clicking on the ‘Search’
button on the ‘Species Search’ screen, or by clicking on the ‘Species Results’ button
on the left-hand menu. At any point you can click on the 'Species Results' button to
see the current list of species that you are working with.
The Species Results lists the matching species based on your current search
options. The number of matching species is displayed above the list.
The results are listed in pages containing twenty items each. To move between the
pages you can use the controls at the foot of the list.
Click on the arrows to move to the first, previous, next and last page respectively.
You can also enter a specific page number in the text box labeled ‘Page’ and click
the ‘Go’ button to jump to a specific page directly.
Listed species details
The information that you see in columns for each species in the list is determined by
what criteria you used for your search. Family, Species and Category are always
SIBIS Manual version 1.1 Aug 2009
- 24 -
included. The table below indicates what details are added to the list when you
include criteria from that section in your search:
Search criteria
Result list details
Taxonomic
Current name/synonym
Common name
Language, Common name
Threatened status
IUCN, CITES and NEMBA ratings
This means that a search for threatened (Threatened status) mesembs (family
Aizoaceae, Taxonomic) will include the various IUCN, CITES and NEMBA ratings as
well as an indication of the current/synonym status of each species name listed.
Sorting your results
By default, the results are sorted by Family and Species.
Sort the list of species by clicking on one of the column headings. The icon on the
right of the column heading will change from the paired arrows
to a down-arrow
, indicating that the selected column is the first (1) priority for sorting, and that the
sort is in ascending order (i.e. from A to Z). The column will also be highlighted. To
change the sort order for the column, bringing the last entries to the top of the list,
click on the down-arrow icon
at the head of the column. This will change to an
up-arrow , indicating that the sort is now in descending order from Z to A.
To sort by more than one column, click on the ‘Plus’ icon
shown in the column
headings. This will add the selected column to the sort criteria, and indicate that it is
of secondary priority by the ‘2’ in the new down-arrow icon
at the top of the
column.
To remove the sort order from the listing, click on the ‘Clear sort’
button above
the column headings. This will restore the list to the default listing order.
Viewing a species
To examine a species click the ‘Details’
button on the right of the species;
this will take you to the ‘Current Species’ page for the selected species. This also
loads the relevant specimens into the ‘Specimen Results’ page and prepares the
Interactive Map page with the distribution for that species.
Refining your search
To refine your search criteria, click on the ‘Refine search’
top of the page.
SIBIS Manual version 1.1 Aug 2009
button at the
- 25 -
Species Details
The ‘Species Details’ page can be reached by clicking on the ‘Details’ button for one
of the species on the ‘Species Results’ page, or by clicking on the ‘Current Species’
button if you have previously viewed the species.
The ‘Species Details’ page provides an overview of the species, combining
information from all the selected data sources. In addition, you can now click on the
‘View Map’ button at the top of the screen to view a distribution map for the species,
or the ‘View Specimens’ to see a list of specimen and observation records for the
species. To return to your list of search results click on the ‘Back to List’ button.
SIBIS Manual version 1.1 Aug 2009
- 26 -
The information on the ‘Species Details’ page is broken down into generic and
specific information. The generic information is common to all species:
• Taxonomic Details
• Threat Status
• Common Names
• Known Synonyms
• Is a Synonym for
• South Africa Provinces
• Notes
The specific information is specific to the type of species that you are looking at. For
plants, this will include sections for Pollinators, Growth Forms, Life History, etc.
In the future SIBIS will include additional sections of species information, depending
on what is available in the data sources, and requests from users. Please let us
know the types of species information you would like to see.
Since the information is drawn from many different sources, there are overlaps
where more than one data source contains information on, for example, the family to
which a species belongs. These may not always agree. At the top of a section you
will see the data source whose information is being presented.
The default data source which is shown is generally the most authoritative; for
example, PRECIS is considered to be the most qualified reference for plant
taxonomy within SANBI, so its ‘version’ of the species taxonomy is shown by default.
You can examine the different versions of information by selecting the data source
from the dropdown list. All the information within the section will then be drawn from
the new data source.
To interrogate the data in more detail, click on the ‘View’
button at the top of the
page. This will display additional icons adjacent to each field. The square of
coloured dots
will produce a complete listing of all the ‘opinions’ of the data
sources regarding that particular piece of information.
SIBIS Manual version 1.1 Aug 2009
- 27 -
The single line of coloured dots
particular piece of information.
displays the discrete range of values for that
If a species has synonyms, these are listed under ‘Known synonyms’. You can view
any of these entries by clicking on the item and then clicking the ‘View Synonym’
button. In general, synonyms will have less information associated with
them, and may have fewer distribution points than the currently valid species names,
since specimens will have been reassessed in the light of the revised taxonomy.
SIBIS Manual version 1.1 Aug 2009
- 28 -
You can sort the entries in the tabular layouts (e.g. Common name) by clicking on
the column header.
To view the distribution map for the species, based on its specimens and
observation records, click on the ‘Interactive Map’
button on the menu,
or use the ‘View Map’ button in the upper right-hand corner.
SIBIS Manual version 1.1 Aug 2009
- 29 -
Mapping species distribution
The ‘SIBIS Map’ page is reached by clicking on the ‘Interactive Map’
button on the menu.
This page displays a map with the distribution of the current species based on the
specimen and observation records found in SIBIS. For data which is at the quarterdegree square (QDS) resolution, i.e. the specimen is only identified as being found in
a particular QDS, as opposed to a specific point as determined by a GPS for
example, the map will display red squares. Point-resolution data is displayed as
points on the map. If there are no georeferenced records for the current species,
then the map will be blank. Overlapping records found in the same area will result in
a darker red colour.
Note that point-resolution data is currently regarded as sensitive, so you will only see
QDS-scale distributions in SIBIS.
SIBIS Manual version 1.1 Aug 2009
- 30 -
Selecting layers
Layers are sets of information such as towns, rivers and protected areas. To change
the layers which are visible on the map, click on the blue ‘+’
button on the upper
right of the map frame. A list of available layers will be shown. Turn the layers on or
off by using the checkboxes next to each one. You can also toggle between a world
map and the Google Earth coverage as an underlying backdrop to the other layers.
When you have finished click on the ‘-‘
button to hide the layer panel again.
Please let us know if there other layers which you would find useful.
Zooming and moving the map
Use the slider on the left to zoom in or -out on the map. Moving the slider up will
bring you closer to the surface, while moving it down will take you further away from
ground level.
You can also zoom to a specific area on the map by clicking on the ‘Zoom in’
button on the right and then drawing a box around the area of interest on
the map. Zoom out using the ‘Zoom out’
button
Scrolling your mouse wheel while over the map will also zoom in or out.
To move the map either use the blue compass
above the zoom slider,
which will set the map moving in whichever direction you click on, or click on
the ‘Hand’
button on the right and then click and drag the map as needed.
Downloading the specimen shapefiles
Shapefiles are used in Geographic Information Systems (GIS) such as ESRI
ArcViewTM or ArcGISTM to display data. Various free desktop GIS tools are also
available, such as MapWindow GIS (http://www.mapwindow.org).
You can download the shapefiles of the specimens you are viewing on the map by
clicking on the link at the foot of the map.
SIBIS Manual version 1.1 Aug 2009
- 31 -
This will only download the specimen data: the other layers or background image are
not downloaded. You can then open the shapefiles in your desktop GIS system: two
shapefiles are downloaded, one for the QDS-scale specimens (a polygon shapefile),
and one for the point precision specimens (a point shapefile). If there are no pointprecision data available (which is the current situation), then only the polygon
shapefile will be downloaded.
The attributes which are downloaded with your shapefiles are as follows:
• Source
• Family
• Species
• Collection date
• Category (Plant/Animal)
Using the map to select specimens
You can refine your specimen list to select only a subset of the specimens which are
currently being shown on the map.
To refine your list of specimens, click on the ‘Select specimens’
button on the
right of the map. Then click and drag a box around the specimens you would like to
focus on. When you have dragged the box SIBIS will return with a specimen list
reflecting the specimens falling within your selected area. If the data is at QDS
resolution then if your selection overlaps with the QDS the data will be included;
point-resolution data is only included if it falls within your selected area.
SIBIS Manual version 1.1 Aug 2009
- 32 -
The selection above returns the following specimens for Leucadendron argenteum
(the Silver tree).
SIBIS Manual version 1.1 Aug 2009
- 33 -
If you now return to the interactive map, you will notice that only the specimens that
you have selected are shown, excluding (in the case of the example above), those
specimens found in Gauteng and the Eastern Cape.
Using the map to build a species checklist
You can use the map to find all specimens (of all species) which occur within a
particular area. This in turn provides you with a species list for that area, at least as
far as SIBIS has specimen and observation records for that area. Note that with
QDS resolution data this is not likely to be a very accurate list except for large scale
areas.
To create a checklist click on the ‘New’
button on the map interface and drag a
box to select the area of interest. Since the search is database intensive, you are
limited to an area no bigger than half a degree latitude by half a degree longitude. If
you attempt to select a larger area a pop-up message requesting a smaller selection
will be shown.
As with the ‘Refine’ search, QDS resolution data which overlap with your selected
box will be included, so although the ½º x ½º maximum size is only 4 QDS’s, you
may get results from up to 9 QDS’s if your selection overlaps with them.
SIBIS Manual version 1.1 Aug 2009
- 34 -
Since the search may take a few seconds, SIBIS temporarily disables the interface
and displays a message.
Once the search is complete, you are presented with a list of specimens for the
selected area.
SIBIS Manual version 1.1 Aug 2009
- 35 -
You can now click on the ‘Show species list’
button above the list of
specimens on the right to see the species list of the selected area. (If you view the
details of one of these specimens, the distribution of that specimen’s species can be
mapped by returning to the Interactive Map and clicking the ‘Reload Current Species
button. Otherwise the map will display the specimen data in
your selected area, and the title of the map will be ‘More than one species in
Specimen List’)
SIBIS Manual version 1.1 Aug 2009
- 36 -
To further refine this list of species, you can go to the ‘Species Search’ screen and
use the ‘Specimen Results’ option combined with additional criteria to select
matching species. You will notice that the ‘Specimen Results’ section of the search
now indicates how many species you can choose to work with: these are the species
from the area you selected on the map. Note that you must tick the checkbox next to
the ‘Specimen Results’ section to restrict your search to these species.
For instance, to identify which species from that area are threatened, you might
choose to add an IUCN Threatened criterion.
This will return the IUCN threatened species from the list of 686 species that were
present in the selected area:
SIBIS Manual version 1.1 Aug 2009
- 37 -
SIBIS Manual version 1.1 Aug 2009
- 38 -
Specimen results
You can view the Specimen Results page by clicking on the ‘Specimen Results’
button on the menu, or by using the Interactive Map and ‘Refining’ your specimens
or selecting a ‘New’ area to retrieve a complete checklist of specimens.
The Specimen Results page provides a list of the specimens for your current
species, or a subset of these if you have selected some of these on the map. The
page can also list specimens for a range of species if you have used the map to get
a specimen set for a selected area.
The Specimen Results page is similar to the Species Results page in the
functionality it offers for sorting the list. Please refer to that section of the manual to
learn how to sort by various columns. Unlike the Species Results page, the list of
specimens always include the same columns, namely
• Data source
• Family
• Species
• Collection date
• Quarter-degree grid
• Species category (plant or animal)
Clicking on the ‘Details’
specimen.
SIBIS Manual version 1.1 Aug 2009
button will show the details of the selected
- 39 -
Clicking on the ‘Show Species List’
button is useful if you have used
the map to select all specimens within a particular area: the ‘Show Species List’ will
then give you a species list for that area. If you are already only working with a
single species then it will simply list that single entry.
SIBIS Manual version 1.1 Aug 2009
- 40 -
Specimen details
You can view the ‘Specimen Details’ page by clicking on the ‘Details’ button for a
specimen on the list of Specimen Results. You can also return to a previously
selected specimen by clicking on the ‘Current Specimen’
button on the
menu.
The ‘Specimen Details’ page is organised in a similar way to the ‘Species Details’
page. It is broken into two parts: the upper comprising the details which are common
to all specimens, while the lower section gives details specific to the data source
from which the specimen is drawn.
Note that at present, the Longitude, Latitude and Locality fields have been blanked
out as sensitive data: these may appear greyed out in the interface. For animal
samples the Collectors are also not made public.
SIBIS Manual version 1.1 Aug 2009
- 41 -
If you notice an error in the specimen data, or have a query regarding the specimen,
you can click on the ‘Report a problem with this specimen’ link at the top of the
screen. This will create an email message with the details of the specimen which
you can send to SANBI.
SIBIS Manual version 1.1 Aug 2009
- 42 -
Frequently Asked Questions
Listed below are some of the more common queries about SIBIS. If you have a
question which is not answered here, please let us know.
Why isn’t my search returning any species?
The most common cause of a search not returning any results is that the criteria are
too specific. The Search screen remembers your last search settings, so if you
entered some taxonomic criteria, say ‘Fi’ for Family, and then perform a new search
where you add some criteria around threat status, it is possible that no species will
match both criteria. Either clear the search before entering your new criteria, or use
the checkboxes on the left of the section headings to turn off irrelevant criteria.
You may also click on the ‘Where am I?’
the criteria which are being applied.
button below the menu to see
You may have disabled the data sources needed to find the information. Click on
the ‘Search options’
button to see if there are additional data sources
that may contain the species you are looking for.
It could be that SANBI does not have any data that matches your search.
Why is my map blank?
If you have selected a species from the result list, you expect the ‘Interactive Map’ to
display the specimens and observation records as red squares and points on the
map. Sometimes the map does not display any records. This can be due to a lack
of specimens for the selected species, or because the specimens that do exist are
not georeferenced, and thus cannot be displayed. Click on the ‘Specimen Results’
button on the menu to see if there are specimens; if so then the most
probably cause for the lack of display on the map is that they have not yet been
georeferenced, or are georeferenced at a resolution cruder than quarter-degree
square.
If you were looking at a synonym species name, then it is quite likely that no
specimens are associated with it. You need to select its current name (or one of its
current names, if it has been split), and view the distribution map of that species.
If you have not selected a species by picking an entry on the species result list and
clicking on the ‘Details’
button, then SIBIS will not display anything on the map.
At present you cannot display the specimens from more than one species on the
map except by doing a spatial search using the ‘New’
button on the right of the
map to pick species within a particular area. You cannot move directly from the
SIBIS Manual version 1.1 Aug 2009
- 43 -
‘Species Results’ page to the ‘Interactive Map’ page to see the combined distribution
of all your species.
Why is my map pink? Or not loading at all?
Er, that’s not right. Please let us know and we’ll take a look. It could be a problem
with your firewall or network settings blocking port 8080.
Why can’t I search for species by growth form / flower colour / etc.?
Let us know what options you would like, and if SANBI has the data to support those
type of searches we may be able to add it to SIBIS.
Why does my search return two copies of the same species?
If you search for Leucospermum bolusii you may well find two “copies” of this
species: one of which is currently valid and one of which is a synonym. There are a
relatively small number of species that appear to be duplicated, but you may
encounter them from time to time. The reason for this is as follows: because we are
not showing the taxonomic authority for the species, some species which share a
name and are only distinguished by the person who named them will appear
identical. In the above case the synonymous species is actually Leucospermum
bolusii E.Phillips = Leucospermum cordifolium, while the current species is
Leucospermum bolusii Gand.
Why does the map only show squares: doesn’t SANBI have fine-scale data?
SANBI does have specimen and observation data at finer resolution than QDS. In
the next version of SIBIS we plan to allow users to log-in, and see information at the
best resolution available.
At present some information is sensitive, such as the precise locality details of
species at risk of harvesting. The public, anonymous SIBIS user will not be able to
see the precise coordinates or locality descriptions for specimens.
I’ve noticed an error in SIBIS!
If you notice some information on the site which you know is wrong, drop us an
email, or better yet, email the owner of the record identified on the ‘Data Sources’
page. Hopefully the next time we load that data set the problem will have been
resolved.
If you notice a bug in the code, or if the site doesn’t work properly, please let us
know at [email protected].
In future versions of SIBIS, logged-in users may be able to add and review
comments on the data displayed.
Why can I only search small areas on the map?
The search for all specimens within a particular area is quite time consuming to run.
We have made a judgment call on what is a reasonable area to be interested in, and
SIBIS Manual version 1.1 Aug 2009
- 44 -
limited the search accordingly. If you think we’ve miscalculated, let us know why and
perhaps we can find a way of expanding the searchable area. But not the entire
country, please!
Why is mapping so slow?
Mapping may be slow because of bandwidth issues (you might want to turn off the
Google backdrop, or some of the other layers), or because of the browser you are
using. Internet Explorer 6 is particularly prone to this problem unfortunately, since it
cannot handle varying transparency in the images that are loaded. You can check
the version of your browser by clicking on ‘Help’ and ‘About’ from the main menu.
If you are using Firefox, and the map page never loads completely, this may indicate
a problem with the configuration of your proxy server. Please let the people who
manage your network, and us, know.
How do I find threatened species for an area?
You can use the map to find species within an area with the ‘New’ button. Then filter
this list to just threatened species (or whatever other criteria you want) on the
‘Species Search’ page. For further details see ‘Using the map to build a species list’
in the ‘Mapping Species Distribution’ section of this guide.
Why is there so little data for animals?
We hope to have more animal data available soon! One artifact of SANBI’s history
as the National Botanical Institute is that the older data sets tend to be plant-focused.
Newer work at SANBI, and through the network of SANBI partners, will bring a more
balanced perspective to SIBIS.
Where are the pictures?
Images of species will be added to SIBIS soon. At present you should look on
Plants of southern Africa (http://posa.sanbi.org) for plant images.
SIBIS Manual version 1.1 Aug 2009
- 45 -
I would like to download the data, is this possible?
We intend to allow users to download data in the near future. This will comprise
species and specimen lists, and will be available in zipped delimited-text formats for
incorporation into your own databases. Please respect the Terms of Use for the
data and acknowledge its source appropriately. Since this is still in development, let
us know if you have any ideas.
How can I find a specimen?
SIBIS allows you to find specimens in two ways: either by first identifying the
species, or by using the map to find all specimens within a selected area. There is
no ‘Specimen’ search screen in the same format as the ‘Species’ search screen. If
this is something that you would find particularly useful, please let us know, and
describe what criteria you would like to use to uncover the specimens you are
interested in, such as collector’s name, etc.
Why is everything behaving strangely?
Do you have two browser tabs open with SIBIS in each? The site cannot
differentiate between your tabs so it treats them as a single session: what you do on
one tab will affect the other as well, so you will notice inconsistencies as you move
from page to page. We advise you to only work with one copy of SIBIS open on your
computer. But we are flattered by your enthusiasm.
Why do none of the specimens have latitude/longitude or localities?
At present these are considered sensitive, and only the quarter-degree grid value is
being made available.
I used SIBIS to generate a species list for an area I know; I never realised it
was so diverse!
While it may indeed be mega diverse, please be aware that the resolution of the data
may lead to inaccurate results particularly at a small scale: for instance, using SIBIS
to generate a species list for a team member’s suburban garden indicates 768
species! Given that most data is at QDS resolution, all the species found in the
overlaid QDS’s will be included, including the specimen records from the 1800’s
(unless you have filtered those out on the Search Options page). These species
may sadly no longer occur in the area.
Why has my current species changed?
Your current species dictates what you will see when you click on the ‘Current
Species’ button on the menu, as well as which species distribution will be plotted on
the Interactive Map, and which specimens will be shown on the Specimen Results
page. It is important to know how the current species is set.
You can set your current species in two different ways. The most common is when
you select a species from the Species Results list: this will show you the details of
that species, and change your current species to that species.
SIBIS Manual version 1.1 Aug 2009
- 46 -
The second way to change your current species is by doing a ‘New’ search on the
Interactive map to find a list of specimens within a particular area. If you click on the
details of one of the specimens listed, your current species is set to that species.
The diagram below provides details of the effect of all the actions you can take on
your SIBIS context (comprising Species Results, Current Species, Specimen Results
and Current Specimen).
FIN
SIBIS Manual version 1.1 Aug 2009