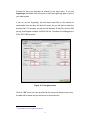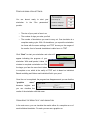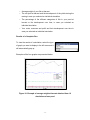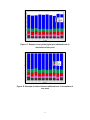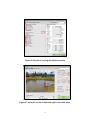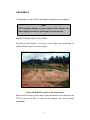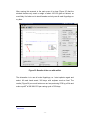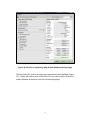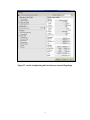
1
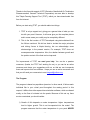
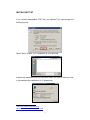
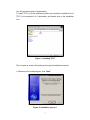
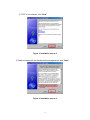
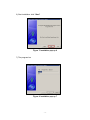
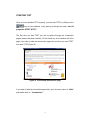
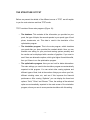
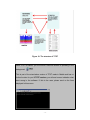
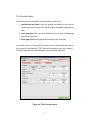
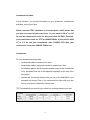
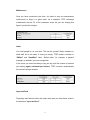
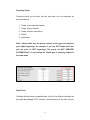
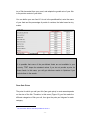
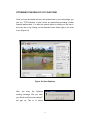
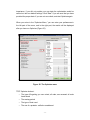
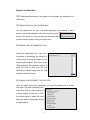
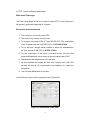
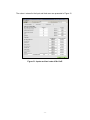
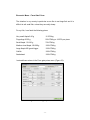
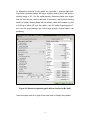
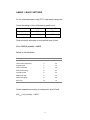
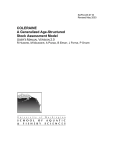
TILAPIA FARMING SUPPORT TOOL
TFST 1.0
USERS MANUAL
NOVEMBER 2003
TABLE OF CONTENTS
FOREWORD ................................................................................................... 5
INSTALLING TFST ......................................................................................... 8
STARTING TFST .......................................................................................... 13
THE STRUCTURE OF TFST ........................................................................ 14
THE MAIN MENU.......................................................................................... 16
Tilapia type............................................................................................... 16
Culture type.............................................................................................. 18
Predator type ........................................................................................... 19
Feed type ................................................................................................. 20
The economic menu ................................................................................ 21
Investment and Labor ......................................................................... 22
Input and Feed ................................................................................... 23
Farm Gate Prices ............................................................................... 25
Pond and simulation settings ................................................................... 27
Visualizing the results of your simulation ................................................. 27
Results of a Complete Run................................................................. 28
Results of an Individual Simulation ..................................................... 31
OPTIMISING THE RESULTS OF YOUR POND ........................................... 34
Optimising with a predator ....................................................................... 36
Optimising with all male fingerlings .......................................................... 37
Optimising for the number of days ........................................................... 37
Optimising for different types of feed ....................................................... 37
Start optimise ........................................................................................... 38
Results of optimise................................................................................... 38
SAVING FILES.............................................................................................. 40
Saving the results of your runs................................................................. 40
Saving the graphics of your results .......................................................... 41
AN EXAMPLE ............................................................................................... 42
Mr Koffi Gombo from Ivory Coast............................................................ 42
Main menu-Tilapia type ...................................................................... 43
Economics menu-Investments............................................................ 43
Economic menu-inputs and feed ........................................................ 44
Economic Menu – Farm Gate Prices.................................................. 46
Optimising........................................................................................... 47
THE SCIENTIFIC VERSION OF TFST ......................................................... 52
ACKNOWLEDGEMENTS.............................................................................. 53
REFERENCES.............................................................................................. 54
ANNEX 1: BASIC SETTINGS ....................................................................... 55
LIST OF FIGURES
Figure 1: Installing TFST ................................................................................. 9
Figure 2: Installation pop-up 1 ......................................................................... 9
Figure 3: Installation pop-up 2 ....................................................................... 10
Figure 4: Installation pop-up 3 ....................................................................... 10
Figure 5: Installation pop-up 4 ....................................................................... 11
Figure 6: Installation pop-up 5 ....................................................................... 11
Figure 7: Installation pop-up 6 ....................................................................... 12
Figure 8: Installation pop-up 7 ....................................................................... 12
Figure 9: The second introduction page ........................................................ 13
Figure 10: The structure of TFST .................................................................. 15
Figure 11: The Main menu ............................................................................ 16
Figure 12: Local and GIFT tilapia of the same age....................................... 17
Figure 13: The Tilapia menu.......................................................................... 18
Figure 14: The Economic menu .................................................................... 21
Figure 15: Farm gate prices .......................................................................... 26
Figure 16: Example of average weight at harvest obtained from 10 simulations
of one pond ............................................................................................ 28
Figure 17: Example of net yields (kg/ha/year) obtained from 10 simulations of
one pond ................................................................................................ 29
Figure 18: Example of relative biomass obtained from 10 simulations of one
pond ....................................................................................................... 29
Figure 19: Example of cost, revenue and profit obtained from 10 simulations
of one pond (on a ha basis).................................................................... 30
Figure 20: Example of the development of the average weight in one
simulation ............................................................................................... 31
Figure 21: Example of the development of the net yields in one simulation .. 32
Figure 22: Example of the development of the relative biomass in one
simulation ............................................................................................... 32
Figure 23: Example of the development costs, revenues and profits of one
simulation ............................................................................................... 33
Figure 24: Start Optimise .............................................................................. 34
Figure 25: The Optimise menu ...................................................................... 35
Figure 26: Results of running the Optimise module....................................... 39
Figure 27: Using the results of Optimise again in the main menu. ................ 39
Figure 28: saving your data files.................................................................... 40
Figure 29: Mr Koffi’s ponds, under construction ............................................ 42
Figure 30: Investments of Mr. Koffi................................................................ 43
Figure 31: Inputs and feed costs of Mr. Koffi ................................................. 45
Figure 32: Farm gate prices of Mr. Koffi ........................................................ 46
Figure 33: Results of the first optimising of Mr Koffi ...................................... 47
Figure 34: Results of optimising with African Catfish for Mr. Koffi ................. 48
Figure 35: Results of the run with catfish. ..................................................... 49
Figure 36: Results of optimising with all male hand sexed fingerlings........... 50
Figure 37: results of optimising with all male sex reversed fingerlings .......... 51
FOREWORD
Gertjan de Graaf (NEFISCO1, Amsterdam, the Netherlands) and Pieter
Dekker (Xi2, Delft, the Netherlands) developed an Individual-Based Tilapia
Farming Simulation Model.
The development of this model is the result of G.J. de Graaf’s experiences
with large-scale farming of Nile tilapia (Oreochromis niloticus) in Congo
Brazzaville during a FAO/UNDP aquaculture project.
In Congo Brazzaville, use of proper feeding and stocking regimes led to
productions of 6-8 t/ha/yr. and elimination of the famous tilapia stunting was
not a problem. These results were published in a number of scientific articles
(de Graaf et al. 1996, 1999). During the analysis of the Congo Brazzaville
data and writing of the articles it was realised that there could be some basic
biological driving forces behind the failure or success of tilapia farming,
especially in rural Africa. Field experiments to test the validity of the ideas
were too expensive to conduct.
However, the availability of the large data set acquired during five years of
tilapia farming in Congo Brazzaville and the development of the computer
industry with increased availability of cheap, powerful computers and
software, provided the idea:
“Why not build a simulation model that can identify the most important
driving forces within the system?”
The tilapia model was built in MATLAB and calibrated with the data set of
Congo Brazzaville. The first simulations of the model provided good results
and the idea of making a more user friendly version of the model to support
tilapia farmers and students in developing countries was introduced.
1
2
http://www.nefisco.org/software.htm
http://www.xi-advies.nl
-5-
Thanks to the financial support of GTZ (Deutsche Gesellschaft für Technische
Zusammenarbeit, German Technical Cooperation) we were able to develop
this Tilapia Farming Support Tool (TFST), which you have downloaded free
from the Internet.
Before you start using TFST, you should realize two things:
1. TFST is only a support tool, giving you a general idea of what you can
do with your pond. However, it will never give you the complete picture
and in some cases your reality may be completely different.
2. This is the first version of TFST developed using data obtained from
the African continent. We did our best to include the major principles
and driving forces in tilapia farming, but we acknowledge some
shortcomings in the present version, For example, TFST does not
encompass water temperature. Also, the relation between growth and
the protein content of the feed can be improved.
For improvement of TFST, we need your help. You can be a passive
consumer, (thanks, but TFST isn’t working for me), or you can be an active
consumer and share your suggestions with us, so that we can incorporate
them and improve this free software. I hope you are an active consumer and
that you will send your comments to us at [email protected]
The Program
The program is based on population dynamics. In other words, it follows each
individual fish in your virtual pond throughout the rearing period. In this
respect, it differs from other aquaculture simulation software, which are based
mostly on the flow of nutrients into the ponds. Because of this set up, there
are two constraints you should realize:
1) Growth of fish depends on water temperature: higher temperatures
lead to higher growth. This is not incorporated into the model. The
program assumes that the water temperature in your pond NEVER
-6-
gets below 23 degrees Celsius. Do not use the program if the water in
your ponds gets colder.
2) Growth of fish depends on feeding. If you do not feed your fish they will
not grow. The program DOES NOT incorporate natural productivity or
the water quality of your pond.
Gertjan de Graaf
Amsterdam, the Netherlands
November 2003
-7-
INSTALLING TFST
If you correctly downloaded TFST from our websites3 you went through the
following menus:
Select “Save” to save TFST installation on your hard disk.
Indicate the subdirectory on your hard disk where you want to save your file,
in this example the subdirectory is C:\downloads.
3
http://www.nefisco.org\sofware.html
http://www.xi-advies.nl/project-tilapias.shtml
-8-
You will see the progress of downloading.
To install TFST, go to the subdirectory where you saved the installation file of
TFST, in the example it is C:\downloads, and double click on the installation
icon.
Figure 1: Installing TFST
The next pop up screens will guide you through the installation process:
1) Welcome to the install program: click “Next”
Figure 2: Installation pop-up 1
-9-
2) TFST is free software: click “Next”
Figure 3: Installation pop-up 2
3) Read and agree with the Disclaimer/License agreement: click “Next”
Figure 4: Installation pop-up 3
- 10 -
4) Select the subdirectory for the installation or agree with the standard
setting: click “Next”
Figure 5: Installation pop-up 4
5) Create this new sub directory: click “Yes”
Figure 6: Installation pop-up 5
- 11 -
6) Start installation: click “Start”
Figure 7: Installation pop-up 6
7) The progress bar
Figure 8: Installation pop-up 7
- 12 -
STARTING TFST
Once you have installed TFST properly, you can start TFST by clicking on the
icon on your desktop, or by opening it through the menu: start à
programs àTFST àTFST
The first time you start TFST you will be guided through two introduction
pages, please read them carefully. Fill the check box on the bottom left of the
page if you want to skip the introduction pages the next time you start TFST,
then start TFST (Figure 9).
Figure 9: The second introduction page
If you want to read the introduction again later, go in the main menu to “Help”
and double click on “Introduction.”
- 13 -
THE STRUCTURE OF TFST
Before we present the details of the different menus of TFST, we will explain
to you the main structure and how TFST works.
TFST consists of three main programs (Figure 10):
o The database: This contains all the information you provided on your
pond, the type of tilapia, the second species in your pond, type of feed
prices, investments, etc. This data is used in the simulation of the
optimisation program.
o The simulation program: This is the main program, which simulates
your pond after you have provided the needed details. Here you can
simulate one setting for your pond and rearing system precisely and
the results can be displayed with a number of graphics. If you want to
see if there are alternative options, which give higher financial benefits,
then you’ll have to run the optimisation program.
o The optimisation program: Here you can look for better alternatives.
The main settings you used in the simulation program are automatically
exported to this program. You can select other rearing systems and
different types of feed, look at the number of days you culture your fish,
different stocking rates, etc, and see if this improves the financial
performance. After running “Optimise” you can display the three best
options: “Gold,” “Silver” and “Bronze.” Then, the settings of the selected
option are automatically exported to the main screen of the simulation
program, where you can do a new precise simulation with this setting.
- 14 -
Figure 10: The structure of TFST
Once TFST is started, you will notice a MSDOS screen is operating in the
background.
This is part of the stand-alone version of TFST made in Matlab and has no
further function for you. If TFST crashes, you will see here an indication what
went wrong in the software. If this is the case, please send us the lines
displayed in this screen.
- 15 -
THE MAIN MENU
Once you have started TFST, you arrive in the main simulation menu. In this
main screen (Figure 11), you can set the basics of a simulation such as:
1. The type of tilapia you use
2. The culture system, i.e. mixed, mixed with a predator, all male
3. Information on the predator, if you use one
4. The type of feed you use
5. Financial information and prices
6. The size of your pond
7. The number of days you keep the fish in your pond
8. The number of simulations you want to carry out
Details on each function are provided in the following paragraphs.
Figure 11: The Main menu
TILAPIA TYPE
TFST operates with two types of tilapia (Figure 12):
1. A local strain of tilapia, which is the common tilapia used for years in
your area.
- 16 -
2. A Genetically Improved Farmed Tilapia (GIFT strain) developed by
ICLARM and a number of fisheries research stations. The growth of
this strain is much higher if compared with local strains. However, they
are at present only produced in a limited number of countries.
Figure 12: Local and GIFT tilapia of the same age4
In the tilapia menu, you indicate the type of tilapia you want to use and the
weight of the tilapia fingerlings you stock. You
enter this menu by clicking on the green arrow.
4
http://www.worldbank.org/html/cgiar/newsletter/Oct94/SupTil.html
- 17 -
Figure 13: The Tilapia menu
First you select the tilapia type (Figure 13). On the right hand side of the
screen a small description of your tilapia is displayed. Then you enter the
stocking weight of your tilapia fingerlings. Note that you cannot change the
stocking density of your tilapia. TFST uses a standard setting of 2.2
fingerlings per m2 or 22,000 fingerlings per ha. When finished, click on the
“OK” button. Your settings will be saved and you will return to the main menu.
CULTURE TYPE
TFST can work with four culture types:
1. Mixed without a predator: You stock your pond with un-sexed tilapia
fingerlings, in general 50% of the fingerlings will be male and 50% will
be female
2. Mixed with a predator: In order to get rid of the excessive fingerling
production, predators can be raised in combination with tilapia. In
TFST, you can use the African catfish or the African snakehead.
- 18 -
3. All male culture, sex reversed: with this option, you stock your pond
with all male fingerlings that are produced with hormone treatment in
their early life. Sex reversed fingerling in general can only be obtained
from specialized hatcheries and are 100% male even if you buy them
at a weight of 15 grams.
4. All male culture, hand sexed: You stock your pond with all male
fingerlings that are obtained by hand sexing. This can be done at a
specialized hatchery or you can sex the fingerlings harvested from your
own pond. Hand sexing can only be done correctly with fish larger then
35 grams, which means that in the “Tilapia type menu” you should give
a stocking weight of 35 grams. With hand sexing, there is always a
small sexing error (5%) which is incorporated in TFST.
Standard TFST opens with “mixed culture, no
predator.” In the menu you can select your own
option. If you select “mixed with a predator,” you
will see that the menu just below “predator type”
pops up and you have to fill in the information on the predator you use.
PREDATOR TYPE
If you intend to use a predator in your pond,
you first have to indicate which predator you
want to use: the African catfish or the African
snakehead.
The second step is to provide the density and
the weight of the stocked predator.
For the African catfish you can stock up to 1
fingerling per m2 (10,000 per ha) and the
- 19 -
maximum stocking density for African snakeheads is set at 0.1 fingerling per
m2 (1000 per ha). Above these values the results are not coherent with the
reality in the field.
NOTE
Here, TFST has a geographical problem, as it was developed with data from the African
continent. In some countries of Asia, Southeast Asia and South America, the African
catfish is imported and raised in ponds and you can use this setting if fingerlings are
available. For the African snakehead it is more complicated, as they are only found on the
African continent. For Asia and Southeast Asia the snakehead settings could be
representative for the use of the “Asian snakehead” (Channa Striatus). The efficiency of
predation for the African snakehead or the Asian snakehead is more or less in the same
order, but for growth, we do not know. So please realize that TFST is not calibrated for this
option and results can be unreliable.
We need your co-operation to solve this and include more predators in updated
versions of FTST
FEED TYPE
Selecting
the
type
of
feed
you
use
is
straightforward: just select one from the menu.
You can define one type yourself, if the feed you
use is not among the pre-defined ones. You can
include your own type of feed in the “economic
menu”.
Go to the economic menu by clicking on the
green arrow
- 20 -
THE ECONOMIC MENU
The economic menu consists of three sub menus (Figure 14):
1. Investments and labor: here you provide the details of the costs of
constructing your pond and the prices of labor needed to operate your
farm.
2. Input and feed: here you give information on the cost of fingerlings
and the feed you use.
3. Farm gate prices: here you enter the selling price of the fish.
In the main menu, you can enter the name of your country and the name of
your currency. Automatically, TFST gives all the results in your own currency.
You open the sub menus by clicking on the name of the sub menu.
Figure 14: The Economic menu
- 21 -
Investment and Labor
In this submenu, you provide information on your investment, maintenance
and labor costs of your farm.
Please note that TFST calculates on a hectare basis, which means that
you have to convert all your costs here, i.e. your pond is 100 m2 or 0.01
ha, and the construction costs for this pond were 200 ZAR. Therefore,
your construction costs for TFST are 20000 ZAR/ha. If your pond is 5000
m2 or 0.5 ha and your investments were 1250000 CFA then your
construction costs were 2500000 CFA/ha, etc.
Investments
For your investments you provide:
o Investments made to construct your pond
o Investments made in equipment needed to operate your farm
o Amortization period, the time period needed to pay off the investments
or for equipment that has to be replaced completely at the end of the
time period
o Interest rate, the annual interest rate you pay to the bank/NGO if you
borrowed the money. Even if you constructed the farm with your own
money, you have to indicate the interest rate.
TFST automatically converts all your values into costs per hectare, per year.
- 22 -
Maintenance
Once you have constructed your farm, you have to carry out maintenance
continuously to keep it in good order. As a standard, TFST calculates
maintenance cost as 3% of the investment costs, but you can change this
figure if you think it is higher.
Labor
You need people to run your farm. This can be yourself, family members or
hired staff, but in all cases, it costs you money. TFST makes a division in
“Skilled” and “Unskilled” labor. Skilled labor, for example a general
manager, is needed if you have a large farm.
In the menu you enter the salary to pay per day, and the number of persons
you employ (again, calculated per hectare). TFST converts it automatically
into annual costs per hectare.
Input and Feed
Fingerlings and feed are often the major costs and you enter these costs in
the submenu “Input and feed”
- 23 -
Fingerling Prices
Fingerling prices are the price per fish and there are five categories as
discussed before:
1. Tilapia, mixed male and female
2. Tilapia, all sex reversed
3. Tilapia, all male, hand sexed
4. Catfish
5. Snakehead
Note: please make sure the prices conform to the type and weight of
your tilapia fingerlings, for example, if you use GIFT tilapia then also
give the price of GIFT fingerlings. The prices are NOT UPDATED
AUTOMATICALLY if you change the Tilapia type or stocking weights in
the main menu.
Feed Prices
Providing the feed costs is straightforward, just fill in the different cells with the
price per ton of feed. TFST converts it automatically into the feed cost per
- 24 -
ton of fish harvested from your pond, and adapts the growth rate of your fish
to the protein content of your feed5.
You can define your own feed. If it is not in the predefined list, enter the name
of your feed and the percentage of protein it contains, the latter based on dry
matter.
Please Note
It is possible that some of the pre-defined feeds are not available in your
country. TFST keeps the standard values if you do not provide a price for
these feeds. In this case, you will get ridiculous results in Optimise if you
include them in the search. . . . . . . . .
Farm Gate Prices
The price for which you sell your fish (farm gate price) in most cases depends
on the size of the fish. Therefore, in this menu (Figure 15) you first make the
different categories of fish you sell, then give the price per kilogram for each
category.
5
The conversion factors used are provided in Annex 1
- 25 -
Provide the price per fingerling as entered in the input menu, if you sell
fingerlings6 harvested from your pond or stock the fingerlings again in one of
your other ponds.
If you do not sell fingerlings, but sell these small fish on the market for
consumption then the price will be much lower, but you still have to enter the
price per fish. For example, you sell the fish between 20 and 50 g for two ZAR
per kg. One kilogram contains 1000/35= 28 fish. Therefore, the selling price is
2/28= 0.07 ZAR per piece.
Figure 15: Farm gate prices
Click on “Ok” once you have provided all the economic details of your farm,
the data will be saved and you will return to the main menu.
6
For example to your neighbour fish farmer
- 26 -
POND AND SIMULATION SETTINGS
You are almost ready to start your
simulation.
In
the
“Run
parameters”
provide:
o The size of your pond or farm in m2
o The number of days you raise your fish
o The number of simulations you want to carry out. One simulation is a
complete rearing cycle. With 10 simulations, you repeat the simulation
ten times with the same settings, and TFST shows you the ranges of
the results. A set of several simulations is called a run in TFST
Click “Start” to start your simulation and a bar will
appear indicating the progress of your
simulation. With small ponds, it takes 1-2
minutes to complete a simulation run. But
the larger your farm the more time it takes
to complete a run, which is the reality of TFST as it is based on Individual
Based modelling and follows each individual fish in your pond.
Once the run is completed, the progress bar disappears and you see that the
“graphics
becomes
menu”
brighter
and
you can visualize the
results of the simulation with this menu.
VISUALIZING THE RESULTS OF YOUR SIMULATION
In the main menu, you can visualize the results either of a complete run or of
each individual simulation. For each you can see a graphics on:
- 27 -
o Average weight of your fish at harvest
o The net yield at harvest and the development of the yields during the
rearing in case you selected an individual simulation
o The percentage of the different categories of fish in your pond at
harvest or the development over time, in case you selected an
individual simulation
o Your costs, revenues and profit and their development over time in
case you selected an individual simulation
Results of a Complete Run
To view the results of a simulation, select the type
of graph you want to display in the left menu and it
will automatically pop up.
Examples of the four graphs are presented below:
Figure 16: Example of average weight at harvest obtained from 10
simulations of one pond
- 28 -
Figure 17: Example of net yields (kg/ha/year) obtained from 10
simulations of one pond
Figure 18: Example of relative biomass obtained from 10 simulations of
one pond
- 29 -
Figure 19: Example of cost, revenue and profit obtained from 10
simulations of one pond (on a ha basis)
- 30 -
Results of an Individual Simulation
If you want to see the results of each
individual simulation, you must first select the
simulation number in the right menu and the
type of graph from the right menu below.
Examples of the four types of graphs are
presented below:
Figure 20: Example of the development of the average weight in one
simulation
- 31 -
Figure 21: Example of the development of the net yields in one
simulation
Figure 22: Example of the development of the relative biomass in one
simulation
- 32 -
Figure 23: Example of the development costs, revenues and profits of
one simulation
- 33 -
OPTIMISING THE RESULTS OF YOUR POND
Once you have simulated with your own preferences or your real settings, you
can use “TFST-Optimize” to see if there are alternatives providing a better
financial performance. You start this module either by clicking on the Icon in
the menu bar or by clicking on the Optimise button below right in the main
menu (Figure 24)
Figure 24: Start Optimise
After
you
start,
the
Optimise
warning message “Did you enter
your Stock and Economic settings?”
will pop up. This is of utmost
- 34 -
importance, if you did not provide your own data the optimisation would be
carried out with our default settings. Click “Yes” If you are sure that you have
provided the proper data. If you are not sure check, and start Optimise again.
When you arrive in the “Optimise Menu,” you can enter your preferences in
the left part of the menu, and in the right part, the results will be displayed
after you have run Optimise (Figure 25).
Figure 25: The Optimise menu
TFST-Optimise looks at:
o The type of fingerling you use: mixed, all male, sex reversed, all male
hand sexed
o The rearing period
o The type of feed used
o The use of a predator: catfish or snakehead
- 35 -
o The stocking density of the used predator
Please note the phrase “Culture type for local Tilapia” on top of the input
menu. It means that in the main menu the local strain was selected as your
“Tilapia type”. If in the main menu GIFT tilapia is selected you will see here
“Culture type for GIFT Tilapia”.
This means that Optimise ONLY calculates with the selected tilapia type
setting. It cannot compare between a local and GIFT strain tilapia. If you
want to compare the two you have to run Optimise two times, once for
the local strain and again for the GIFT strain.
The Optimise menu opens with the standard scenario “mixed, no predator”,
“300 rearing days” and “high quality feed” but you can replace with your own
preferences.
OPTIMISING WITH A PREDATOR
If you click the check box “Mixed with predator,” a new menu appears below
in the menu “The predator settings.” Again, you see that it is the setting
either for catfish or for snakehead, depending on your selection in the main
menu.
In this menu, you can indicate how you want to search for alternatives, if you
intend to use a predator in your pond:
Density range: you can search with a fixed stocking density of your predator,
or you can select a range of stocking densities: 0.1-1.0 per m2 (1000-10.000
per ha) for catfish or 0.01-0.1 per m2 (100-1000 per ha) for snakehead.
- 36 -
Weight in the Main Menu
TFST automatically defaults to the weight of the predator you entered in the
main menu.
OPTIMISING WITH ALL MALE FINGERLINGS
You can optimise for the use of all male fingerlings, sex reversed or hand
sexed, if you have indicated in the main economic menu
that you can buy them. If so, just click the check box and
continue with the types of feed you want to use.
OPTIMISING FOR THE NUMBER OF DAYS
During the optimisation you can see if
increasing or decreasing the number of
rearing days will have an impact on the
financial performance. Just select in the
“Rearing period” the maximum number of
days you want to raise your fish and
Optimise will use the range from 90 – this
maximum number of days.
OPTIMISING FOR DIFFERENT TYPES OF FEED
Here, the same as with the fingerlings, you can only optimise for a certain
feed type if you have indicated in the
main menu that you have access to
it and provided a price for it. Click
the check boxes to select the feed
types you want to incorporate during
the optimisation.
- 37 -
START OPTIMISE
Start Optimise by clicking the “Optimise button” on the right side
below in the screen. After clicking, the “Optimise bar” will pop up, indicating
the number of simulations that will be made, and the progress of the
simulation process.
RESULTS OF OPTIMISE
Once Optimise is ready with the calculations, the best results: “the gold
scenario” will be automatically displayed (Figure 26).
In the example displayed, an optimisation was made for: mixed no predator,
all male sex reversed and all male hand sexed, 360 days of rearing and a
wide range of feed available.
The results indicate that using all male sex reversed fingerlings, rearing them
for 263 days and feeding them with our own defined feed will give the highest
profit of 690 ZAR for one rearing cycle of the pond/farm.
Select the “Silver” or “Bronze” to display
the second best or third option.
By clicking on the “OK” button below right on the screen the displayed option
will be automatically saved in the main menu settings (Figure 26, Figure 27)
and you can run this scenario to get information that is more precise.
- 38 -
Figure 26: Results of running the Optimise module
Figure 27: Using the results of Optimise again in the main menu.
- 39 -
SAVING FILES
SAVING THE RESULTS OF YOUR RUNS
You can save your settings once you have found your optimal settings
Go to File à Save (in the top left corner of the main screen) or click on the
“save button”
The save menu will pop up and we recommend you save your data in the
“data” subdirectory:
Figure 28: saving your data files
To open your files again go to File à Open or click on the “Open file
button”
and select the file you want to run again.
TFST only saves your settings and not the generated data, as this usually
results in huge files.
- 40 -
SAVING THE GRAPHICS OF YOUR RESULTS
Once you have completed a simulation and displayed the results as a graph,
you can save this graph as a picture file by File à Print plot or by clicking on
the “Printer button”
The save a picture menu will automatically pop up and you can save the file
as a Bitmap file (bmp).
- 41 -
AN EXAMPLE
To familiarize you with TFST in this chapter we present you an example.
Note
TFST includes variation, so your results of this exercise can
differ slightly from the one presented here in the manual
MR KOFFI GOMBO FROM IVORY COAST
My name is Koffi Gombo, I am living in Ivory Coast, and constructing 10
ponds of 500 m2 each in my home village.
Figure 29: Mr Koffi’s ponds, under construction
Before I start running my farm I want to find the best way to do it and I will use
TFST to give me an idea. To carry out this example, open the file “Ivory
Coast.sim.”
- 42 -
In TFST, I use the following parameters:
Main menu-Tilapia type
I will use a local tilapia as we do not have a strain GIFT in Ivory Coast and I
will stock my pond with fingerlings of 35 grams.
Economics menu-Investments
1. The currency in my country is the CFA
2. The name of my country is Ivory Coast
3. To construct one pond of 500 m2 I pay 250.000 CFA. The construction
of the 10 ponds cost me 2 500 000 CFA or 5 000 000 CFA/ha
4. To run the farm I bought scales, buckets, a seine net, wheelbarrows,
etc, this cost me 25 000 CFA or 50 000 CFA/ha.
5. For the construction of the ponds I borrowed money from the local
commercial bank and I have to pay an annual interest rate of 20%
6. Replacement and maintenance is 3% per year
7. My two nephews will operate the farm and I will pay them 1100 CFA
per day. My farm is 0.5 ha operated by two nephews, so I need four
persons/ha
8. I do not need skilled labor for my farm
I entered these values in the Investments menu (Figure 30):
Figure 30: Investments of Mr. Koffi
- 43 -
Economic menu-inputs and feed
In my district I can buy mixed fingerlings, all male hand sexed fingerlings,
catfish and snakehead fingerlings. All male sex reversed fingerlings are
available from a specialized hatchery, located 200 km from my village.
Fingerlings
Weight (g)
Price CFA per piece
Mixed male and females
35
35
All male hand sexed
35
75
All male sex reversed
35
150
Catfish
15
100
Snakehead
15
100
All feed types are available and in Bobo-town a Tilapia feed, made of
cottonseed cake, copra cake and wheat bran is available. It has a protein
content of 30% and costs 140 000 CFA/ton. The other prices for feed are:
Feed type
CFA/ton
High quality Tilapia pellet
250 000
Home made Tilapia feed
150 000
Soy bean meal
160 000
Cotton seed cake
Dried chicken dung
7
180 000
7
20 000
Ground nut cake
160 000
Mustard oil cake
160 000
Wheat bran
100 000
Rice bran
60 000
Difficult to get
- 44 -
The values I entered in the Input and feed menu are presented in Figure 31.
Figure 31: Inputs and feed costs of Mr. Koffi
- 45 -
Economic Menu – Farm Gate Prices
The situation in my country is particular as we like to eat large fish and it is
difficult to sell small fish, unless they are really cheap.
For my fish, I can fetch the following prices:
Very small tilapia 0-20 g
10 CFA/kg
Fingerlings 20-50 g
500 CFA/kg or 18 CFA per piece
Small tilapia 50-120 g
700 CFA/kg
Medium sized tilapia 120-200 g
1000 CFA/kg
Large tilapia 200 g and bigger
1200 CFA/kg
Catfish
1000 CFA/kg
Snakehead
1000 CFA/kg
I entered these values in the Farm gate prices menu (Figure 32):
Figure 32: Farm gate prices of Mr. Koffi
- 46 -
Optimising
First, I want to know what will be the best feed to use. So, I optimise for
“mixed culture,” 360 days and all the feed types, except “dried chicken dung”
as this is very difficult to get.
Optimising takes some time as the farm has an area of 5000 m2. But after a
while the results are displayed (Figure 33) and it indicates that I will produce
2695 kg of fish in one rearing cycle of 256 days. The best feed to use is
soybean meal, because it is relatively cheap and has a high protein content.
However, it also indicates that I will go bankrupt, because I produce too many
small tilapia, which are fetching a low price at the market.
Figure 33: Results of the first optimising of Mr Koffi
- 47 -
An alternative would be to use catfish as a predator. I optimise again with:
mixed with a predator-catfish, 360 days, soybean meal as feed, and select a
stocking range of 0.1-1 for the catfish density. Optimising takes even longer
than the first time as it has to calculate 10 scenarios: one for each stocking
density of catfish. Rearing tilapia with the African catfish will increase my yield
to 3164 kg of which 447 kg is the catfish. I use 0.3 catfish fingerlings per m2,
but I am still going bankrupt due to the large quantity of small tilapia I am
producing.
Figure 34: Results of optimising with African Catfish for Mr. Koffi
I save this option and run it again in the main menu to identify the problem.
- 48 -
After running this scenario in the main menu it is clear (Figure 35) that the
stocked females only reach a weight of about 100-120 gram at harvest, so
most likely it is better not to stock females and only use all male fingerlings on
my farm.
Figure 35: Results of the run with catfish.
The alternative is to use all male fingerlings, so I start optimise again and
select: All male hand sexed, 360 days, with soybean meal as feed. The
results (Figure 36) are much better now as I am producing 3792 kg of fish and
make a profit8 of 996 904 CFA per rearing cycle of 259 days.
8
Without tax
- 49 -
Figure 36: Results of optimising with all male hand sexed fingerlings
The last option is to look at the use of sex reversed all male fingerlings (Figure
37). I would still make a profit of 638 296 CFA per rearing cycle but here the
major bottleneck is the price of the sex-reversed fingerlings.
- 50 -
Figure 37: results of optimising with all male sex reversed fingerlings
- 51 -
THE SCIENTIFIC VERSION OF TFST
The development of TFST was based on the Individual Based Tilapia Farming
model developed by Nefisco and Xi (de Graaf et al., in press). This scientific
version has more options, this as the standard settings can be changed, it can
be adapted to use it for other species, or it can be used for prey-predator
modelling in fisheries.
For more information on the scientific version please contact Nefisco or Xi
[email protected]
[email protected]
- 52 -
ACKNOWLEDGEMENTS
First, we would like to thank GTZ (Deutsche Gesellschaft für Technische
Zusammenarbeit, German Technical Cooperation) for their financial support to
develop this user friendly version of the original Tilapia Simulation Model, and
offer special thanks to Mrs. Maike Walthemath of GTZ for making this happen.
Further, we would like to thank Mr. Jean Pierre Marquet and Mr Joris Colman
from the PAPPE project in Ivory Coast for providing data for the examples and
Mrs. Tami Brunk for editing of this manual
- 53 -
REFERENCES
de Graaf, G.J., Galemoni, F. and Banzoussi, B., 1996, Successful
recruitment control of Nile tilapia, Oreochromis niloticus by the African catfish,
Clarias gariepinus (Burchell 1822) and the African snakehead, Ophiocephalus
obscuris, A biological analyses. Aquaculture 146: 85-100.
de Graaf, G.J. and Janssen, H., 1996, Artificial reproduction and pond
rearing of the African catfish Clarias gariepinus in sub-Saharan Africa, A
handbook. FAO Fisheries Technical Paper. No. 362. Rome, FAO, 73 pp.
de Graaf, G.J., Galemoni, F. and Huisman, E.A., 1999. The reproductive
biology of pond reared Nile tilapia (Oreochromis niloticus), Aquaculture
Research, 30, 25-33.
de Graaf, G.J. Dekker, P., Huisman, E.A. and Verreth, J.,
in press.
Simulation of the pond rearing of Nile tilapia (Oreochromis niloticus) through
Individual Based modelling, based on population dynamics, Aquaculture
Research.
- 54 -
ANNEX 1: BASIC SETTINGS
For the scientists/experts using TFST, major basic settings are:
Growth according to the von Bertalanfy growth curve:
Linfinitif (cm)
K ( year-1)
Tilapia ,males
32.5
1.73
Tilapia females
23.0
1.28
Feed conversion according to crude protein level of feed:
CV = 0.523*(% protein) + 19.015
Based on the data below:
Feed type
Conversion factor Crude protein (DM)
High Quality Tilapia dry pellet feed
1.7
30
Home made Tilapia feed
3
30
Soybean meal
4
35
Cotton seed cake
5
26
Dried chicken dung
5
24
Groundnut cake
5
23
Mustard oil cake
5
30
Wheat bran gluten
6
25
Rice bran
10
12
Growth adaptation according to crude protein level of feed:
K=Kmax*Ln(% protein) –0.0821
- 55 -