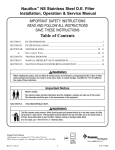
1
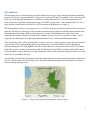
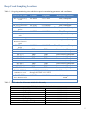
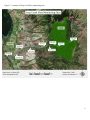
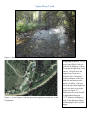
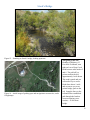
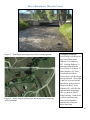
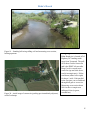
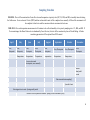
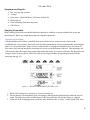
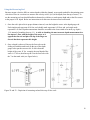
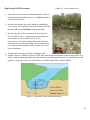
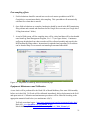
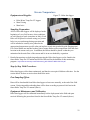
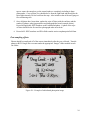
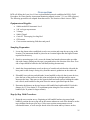
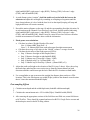
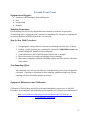
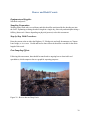
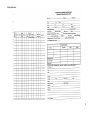
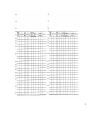
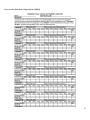
Standard Operating Procedures for the Deep Creek Watershed Restoration 2015 Sampling and Analysis Plan Prepared by: Holly Kreiner, 2015 Big Sky Water Corps Member Broadwater Conservation District 415 So. Front Street Townsend, MT 59644 Additional Contributors: Adam Sigler, MSUEWQ Alli Bratton, 2014 Big Sky Watershed Corps Member 1 Page intentionally left blank 2 Introduction This document serves as field sampling procedures manual for the Deep Creek watershed restoration monitoring program. The Deep Creek watershed is located just east Townsend, MT and flows roughly 30 river miles from the West slope of the Big Belt Mountains to its confluence with the Missouri River. The monitoring program will focus on the lower watershed, containing the Deep Creek WRP “project reach,” which includes about 20.7 river miles from the United States Forest Service (USFS) boundary to the Missouri (see figure 1). This monitoring plan will serve two purposes. First, it will provide project partners the ability to draw conclusions about the effectiveness of the Deep Creek watershed restoration project and assess whether targets outlined in the Watershed Restoration Plan (WRP) are being achieved. Second, it will build upon the efforts of previous monitoring assessments, allowing for trends in the condition of Deep Creek to be evaluated over time. See the Sampling and Analysis plan for a thorough explanation of the Deep Creek Watershed Restoration Plan. These monitoring efforts will be implemented over the next ten years with the support of data collectors Jim Beck, Associate Supervisor and monitoring volunteer for Broadwater Conservation District’s (BCD), Ron Spoon, Fisheries Biologist for MT Fish, Wildlife, and Parks, Natural Resource Conservation Service (NRCS) Townsend Field office employees, and present and future Big Sky Watershed Corps (BSWC) members and/or MSU interns. If local volunteer’s sign up for this project and are properly trained in data collection methods in future years, their efforts may be included in this study. The techniques described herein depict the methods for data collection for each monitoring parameter addressed in the SAP. All who collect data for the Deep Creek Watershed Monitoring Program are encouraged to use this as a reference during sampling events. Figure 1 – Deep Creek watershed and depiction of project reach 3 Sampling Sites A total of 25 on-going monitoring locations have been chosen for the Deep Creek monitoring project. The locations of each sampling site is provided below. An entire page is dedicated to each flow monitoring site to aid in navigation to these sites. The flow sampling sites will be listed from the upper most to the lowest location, for easier navigation to each site within this document. 4 Deep Creek Sampling Locations Table 1 – On-going monitoring sites and their respective monitoring parameter and coordinates Site ID; Site Name Latitude Longitude Monitoring Parameter DC- U; Upper Deep 46.34894 -111.13592 Flow, Photopoint 46.33049 46.33501 46.33297 -111.20977 -111.220828 -111.26112 Flow, Photopoint Flow, Photopoint Flow, Temperature, Photopoint 46.32752 46.32681 -111.28308 -111.36844 Flow, Photopoint Flow, Temperature, Photopoint 46.31509 46.29708 -111.41744 -111.46201 Flow, Photopoint Flow, Temperature, Photopoint 46.28514 -111.50617 Flow, Temperature, Photopoint TBD TBD TBD TBD TBD TBD TBD TBD TBD TBD TBD TBD TBD TBD TBD TBD TBD TBD Cross-section, Photopoint Cross-section, Photopoint Cross-section, Photopoint Cross-section, Photopoint Cross-section, Photopoint Cross-section, Photopoint Cross-section, Photopoint Cross-section, Photopoint Cross-section, Photopoint Creek DC-SB; Sulphur Bar DC-CG; Cabin Gulch DC-HP; Horse Pasture DC-NF; North Fork DC-CL; Clopton Lane DC-S; Stock’s Bridge DC-BM; Above Broadwater Missouri Canal DC-HR; Hahn’s Ranch DC–XS-1 DC–XS-2 DC–X -3 DC–XS-4 DC–XS-5 DC–XS-6 DC–XS-7 DC–XS-9 DC –XS -10 DC-CL-HWY12; Redd/Beaver reach DC-HR-FISH; 46.32669 -111.36868 through 46.32465 -111.29332 46.28479 -111.51181 Above Montana Ditch DC-R-FISH; Reiders 46.30334 -111.44510 Table 2 – HUC codes for all streams included in this study Redd/Beaver dam count Juvenile, Out-migrant trout count Resident trout count HUC (hydrologic Unit Codes) for Streams Russell Fork 100301010802 Sulphur Bar 100301010804 Cabin Gulch 100301010804 North Fork 100301010803 Clopton Lane 100301010805 Stock’s Bridge 100301010805 Lower Deep Creek Bridge 100301010805 Hahn Ranch 100301010805 5 Figure 2 - Location of Deep Creek flow monitoring sites 6 Upper Deep Creek Figure 3 - Standing at measuring cross-section, looking downstream Figure 4 – Aerial image of parking spot and navigation to stream site; credit Googlemaps Navigating to the site: To get to the Upper Deep Creek site, head east on Highway 12 from Townsend through Deep Creek canyon. The pull-off to the Upper Deep Creek site is marked by the “Thomason” property entrance on the lefthand side and between mile marker 19 and 20. Park just left of the shed, head right and cross over fence to get to the stream (see figure 3). Monitoring site can be located by highlighted bank pins (~175’ upstream of highway) and a 1-inch diameter stilling well housing for the TruTrack logger. 7 Sulphur Bar Figure 5 - Standing at measuring cross-section, looking upstream Navigating to the site: From Townsend, take Highway 12 East up Deep Creek Canyon. Sulphur Bar pull-off is located between mile marker 15 and 16 and is the first right turn past the “Sulphur Bar” sign. Drive over the bridge and park on the left just before the Forest Service gate and next to the stream (see figure 5). Monitoring site can be located by highlighted bank pins and a 1-inch diameter stilling well housing for the TruTrack logger just downstream of Forest Service gate (~350 feet from highway) Figure 6 - Aerial image of stream site (parking spot immediately adjacent); credit Googlemaps 8 Cabin Gulch Figure 7 – Standing at measuring cross-section, looking downstream Navigating to the site: The Cabin Gulch site is less than a mile downstream of Sulphur Bar, located between mile marker 14 and 15 of Highway 12 East. From Townsend, pull-off is on the left hand side and is indicated by “Cabin Gulch” road sign. Park on the first pull-off on the road (facing a gated private road) and walk up Cabin Gulch road (note: not the gated road) about 50 feet and turn right to access site. Measuring cross-section is ~450’ from highway. Highlighted bank pins are not located at this site, so be sure to located metal fence posts to find established crosssection. Stilling well is located just downstream of cross-section. Figure 8 - Aerial image of parking spot and navigation to stream site; credit Googlemaps 9 Horse Pasture Figure 9 - Standing at measuring cross-section, looking downstream Figure 10 - Aerial image of parking spot and navigation to stream site; credit Googlemaps Navigating to the site: Heading east on Highway 12, the Horse Pasture site is located between mile marker 12 and 13 about a mile below the official Forest Service boundary. Watch for wooden fence and take the pull-off on the right to park in front of the gate (note: slow down as soon as you approach fence as it is easy to pass this pull-off). Jump over fence and follow navigate to a poorly worn trail that heads to the left side of the paddock. Follow trail to the left-hand side of fence and down to stream site. You will see field instruments just in front of fence. Measuring cross-section bank pins are located just above fence, which is accessed most easily by wading under fence. 10 North Fork Figure 11 - Standing at measuring cross-section, looking downstream Navigating to the site: The North Fork road turn-off is a left-hand turn between mile marker 11-12 on Highway 12 East. As soon as you go over Deep Creek, take a right onto Log Cabin Road and follow that road for several hundred yards until you reach a conspicuous pulloff on the right (see figure 11). Find a path through the woods just to the left of the parking space and walk ~100 feet down to the still well site. Measuring cross-section and highlighted bank pins are located about ~30 feet upstream of still well. Site is ~ 900 feet upstream from highway. Figure 12 - Aerial image of parking spot and navigation to stream site; credit Googlemaps 11 Clopton Lane Figure 13 - Standing just below bridge, looking upstream Navigating to the site: Head east on Highway 12, Clopton Lane Road is located on the right-hand side between mile marker 7-8. Follow the road down and park on the right just before the bridge over Deep Creek (see figure 13). To access the site, cross over the barbed fence to the left of the road and walk down to stream. Highlighted bank pin for measuring cross-section visible in the gravel bar. Bubbler and staff gauge attached to bridge and stilling well is accessible at the top of bridge. Cross-section ~125 feet from Clopton Lane Bridge. Figure 14 - Aerial image of parking spot and navigation to stream site; credit Googlemaps 12 Stock’s Bridge Figure 15 – Standing on Stock’s bridge, looking upstream Figure 16 - Aerial image of parking spot and navigation to stream site; credit Googlemaps Navigating to the site: Heading on Highway 12 East from Townsend, turn right on Lower Deep Creek Road between mile marker 5 and 6. The pull-off is a private road on the left, approximately 1 mile down. This road is gated and you will need a key to access. Head down about ¼ mile and as soon as you cross private bridge, park on the left. Jump the fence to the left and follow established path through the brush to access measuring crosssection, ~ 50 feet from bridge. 13 Above Broadwater Missouri Canal Figure 17 – Standing at measuring cross-section, looking upstream Figure 18 - Aerial image of parking spot and navigation to stream site; credit Goolemaps Navigating to the site: Lower Deep Creek Road can be accessed from either Highway 12 or Highway 287. If taking Highway 12, turn right and head down Lower Deep Creek Road. If taking Highway 287 from Townsend, turn left on Lower Deep Creek Road and head up the road. Above BM Canal site is located around the halfway point on Lower Deep Creek Road. From Highway 287, pull off to the right and park immediately after you pass the FIRST bridge crossing. Walk down to stream and measuring cross section should be immediately visible just below the bridge. 14 Hahn’s Ranch Figure 19 – Standing bellowing stilling well and measuring cross-section, looking upstream Figure 20 - Aerial image of stream site (parking spot immediately adjacent); credit Goolemaps Navigating to the site: The Hahn Ranch site is located off of Highway 287 heading south away from Townsend. The pulloff is about 2 miles from town and is the FIRST left turn after Deep Creek is crossed (note: watch for sign and slow down; road is inconspicuous). Follow road down (either left or right) for about ½ mile. Park parallel to the first gate you see and head through that gate to access site. Measuring cross-section about 100 feet above conspicuous stillingwell site (in green, wooden box). 15 Sampling Schedule 2015-2020 - Flow will be monitored at all nine flow sites and temperature at priority sites (HP, CL, BM, and HR) at monthly intervals during the field season. Cross-sections at 10 sites (TBD) and beaver dam/redd counts will be completed once annually. All three fish assessments will be completed at least twice and the macroinvertebrate assessment at least once. 2020: 2015 - Flow and temperature measurements will continue to be collected monthly at two priority sampling sites: CL, BM, and HR. If flow monitoring at the Horse Pasture site is abandoned by Forest Service, this site will be monitored in place of Stocks Bridge. All other monitoring parameters will be optional from 2020 onward. April Flow, Photopoint May Flow, Photopoint, Temperature June Flow, Photopoint Temperature July Flow, Photopoint Temperature Cross-sections and photopoints, once annually August Flow, Photopoint Temperature September October Flow, Photopoint Flow, Photopoint Temperature Temperature Macroinvertebrate sampling* Out-migrant trout count - Spring runoff period November Flow, Photopoint Beaver dam/redd count Juvenile Count Resident Trout Population Estimate - Spring or Fall Assessment (TBD) 16 Sampling Methods The following section describes the proper filed methods and data collection protocols for each of the monitoring parameters included in this study. For each monitoring parameter, the following elements will be addressed: Equipment and supplies, sampling preparation, step-by-step field procedures, post-sampling efforts, and equipment maintenance and calibration (if applicable). All protocols should be followed as instructed, to ensure accuracy and consistency of the data collections. 17 Stream Flow Equipment and Supplies • • • • • • 100’ reel-type tape measure 2 clamps Flow meter – Marsh McBirney FLO-mate or Hach 950 Measuring rod Flow monitoring field sheet and pencil GPS Camera Sampling Preparation Before heading to the field, one should familiarize themselves with how to operate both the flow meter and measuring rod. Below are simple instructions for using this equipment. Operation of FLO-Mate A Marsh-McBirney FLO-Mate or Hach950 flow meter will be used to measure stream velocity at the established flow cross sections. These units work by taking instantaneous velocity measurements and averaging them over a set period of time. When you receive the unit, the averaging time should be set to 40 seconds. If flow sensor is not already attached to measuring rod, secure it on to the bottom of the rod. This measuring rod will accurately place the sensor at the proper depth within the stream for accurate collection. The procedures for using the meter are shown below, followed by the step-by-step procedures for operating the meter with the measuring rod (pg. 24). Figure 21 – Depiction of Marsh McBirney FLO-mate screen 1. Hit the ON/C button once to turn on or clear meter during use. 2. The unit display will immediately begin averaging by showing the horizontal time bar under the velocity output. The time bar provides an indication as to the amount of time left until the display is updated. 3. At the end of the averaging period, record the value indicated in the “velocity” column on the field form. 18 Using the Measuring Rod Because stream velocities differ at various depths within the channel, an accepted method for determining mean velocities of flow in a section is to measure the velocity at 60% (0.6) of the depth (from the top of water). To use the measuring rod, one should familiarize themselves with how to read stream depth and set the flow sensor to the proper 0.6 ft. depth. Below are instructions to do this once the interval has been located. 1. Once the rod is placed in its proper distance interval, note the height the water at the depth gauge rod. Each single mark represents 0.10 foot, each double mark represents 0.50 foot, and each triple mark represents 1.00 foot. Depth measurements should be recorded to the closest tenth of an inch (e.g. depth = 1.14, instead of rounding down to 1.1). A trick to obtaining the most accurate depth measurement is to line up one’s finer with the height of the water as it approaches the rod and place the tip of the finger on the rod that best represents this height. 2. Once a depth is observed, line up the foot scale on the sliding rod with the tenth scale on the top of the depth gauge rod to put the sensor at 0.6 ft. down from the height of the water. If, for example, the total depth of the water is 2.70 feet, then line up the 2 on the foot scale with the 7 on the tenth scale (see figure below). Figure 22 and 23 – Depiction of measuring rod and close-up of foot scale 19 Step-by-step Field Procedures Figure 24 – Cross-section set up 1. Locate the cross sections at each monitoring site, which are pre-determined and marked with a set of highlighted stakes and/or metal rebar pins. 2. Stretch a tape measure across the channel to establish the cross-section. The beginning of the tape should be hooked to the rebar stake on the left bank (facing downstream). 3. Spacing intervals for flow measurements at each site are listed in Table 3 below. If spacing interval procedures are not available, be sure to collect at least 20 flow measurements. To do this, measure the wetted width and divide into 20 even intervals; taking a flow measurement at each. Measurements should be made in tenths of a foot for easier calculations. 4. Sand just below the tape at the left wetted edge of the 5. channel. Observe Left-Edge-of-Water (LEW) and record the tape measurement at that location with a zero depth. Continue measuring depths across the channel at your determined interval. You should finish on the opposite wetted edge with a zero measurement, recorded as Right-Edge-of-Water (REW). Figure 25 - Depiction of cross-section subsections 20 Post-sampling efforts 1. Field calculations should be entered into saved excel master spreadsheet on BCD’s Google drive account immediately after sampling. This spreadsheet will automatically calculate flow when data is entered. 2. Once field calculations are complete, hardcopies should be stored in the BCD monitoring filing cabinet and scanned and transferred to the Google Drive account (see Google drive “Filing Instructions” folder). 3. At end of field season, all flow sampling sites will be visited and data will be downloaded onto OmniLog Data Management Program, Ver. 1.75 (see figure below). Continuous staff gauge height data from chart recorders will be collected monthly and stored in the BCD monitoring filing cabinet. Instructions for uploaded and exporting TruTrack data can be found at http://www.trutrack.com/omnilog/usermanual/index.html Figure 26 – Depiction of OmniLog software download page Equipment Maintenance and Calibration A zero check will be performed for the Hach 950 or Marsh McBirney flow-mate 2000 monthly before use in the field. TruTracks will be calibrated immediately before deployment in the field and upon retrieval. Calibration and maintenance procedures will be followed according to the appropriate manuals listed below (see attachments A,B,C): TruTrack water data logger - http://www.trutrack.com/omnilog/usermanual/index.html Hach 950 - www.hachflow.com/pdf/FH950_ds.pdf Marsh McBirney 2000 - www.hachflow.com/pdf/Model_2000_Manual.pdf 21 Stream Temperature Equipment and Supplies • • • Figure 27- Hobo data logger Hobo Water Temp Pro V2 loggers Metal Casing Metal wire Sampling Preparation All five Hobo data loggers will be deployed at the beginning of every field season, when conditions are safe enough to wade (sometime in May). Each Hobo will be placed in a metal casing (see picture below) to prevent damage during operation and will be attached to a sturdy wire pinned to the appropriated temperature-specific rebar pin in place at each site (marked by pink flagging tape). It is critical Hobos are attached to these pins to ensure Hobos collect temperature from the same location in the stream each year. In addition, the Hobos should be placed so that they are maintained in the main flow of the stream and lie in an area shaded by vegetation. 1. Detailed instructions on deploying and protecting the Hobo data loggers can be found in the Onset Hobo Temp Pro V2 manual and will be followed for the duration of this monitoring program. http://www.onsetcomp.com/files/manual_pdfs/10366-F-MAN-U22-001.pdf Step-by-Step Field Procedures Hobo data loggers collect data continuously and thus do not require field data collection. See the section below for how to retrieve data from Hobo units. Post-Sampling Efforts Data will be downloaded from Hobo data loggers at least once annually, at the end of the field season. Retrieving and downloading data will be done according to protocols laid out in the Onset Hobo Temp Pro V2 manual (above). Equipment Maintenance and Calibration Hobo data loggers will be calibrated immediately before deployment in the field and upon retrieval following the procedures listed in the Onset Hobo Temp Pro V2 manual (above). 22 Photopoints Photopoints at will be taken in conjunction with flow monitoring and cross-section assessments. It is essential that photos are taken according to the procedures listed below to ensure that they exactly replicate previous photographs for drawing comparisons. The following procedures are adapted from the Standard Operating Procedures of the Madison Stream Team SAP (see SAP references) Equipment and Supplies Needed Required: • GPS camera • Photo-log data sheets • Whiteboard • Dry erase marker • Rag to erase white board • Topographic and/or road map • Timepiece • Optional: • Aerial photos if available • Extra batteries for camera • Ruler (for scale on close up views of streams and vegetation) • Steel fence posts for dedicating fixed photo points in the absence of available fixed landmarks Step-by-Step Field Procedures 1. First and foremost, ensure that the date and time in the camera are set correctly. If they are not correct and you cannot figure out how to reset them, make a note of the incorrect time in the field remarks section of the photopoint field form. 2. The first photograph should be of a whiteboard that displays the information about the site (see figure below). The wipe off sheet should be photographed before any site photos are taken and again after all photos are taken at the site to facilitate data management. 3. Locate flow/cross-section monitoring sites by referencing the description contained within the station location guide and by finding existing cross-section markers (highlighted rebar pins or metal stakes). Use GPS waypoints in Sampling Location table above if needed. Secure tape across cross-section before taking photographs. 4. Take AT LEAST three field photographs including: 1) cross-section view, 2) upstream view 3) and downstream view. Walk approximately 20 feet upstream and downstream of 23 tape to ensure the enough to get the stream banks are completely including in those photographs. Cross-section view should also be from the right bank and should also be taken approximately 20 feet back form the tape. Also include a shot of the staff gauge at flow monitoring sites. 5. Once all photos have been taken, update the wipe off sheet with the end time and the number of photos taken/jpeg numbers and photograph the board (example below). Record all applicable JPEG numbers on this whiteboard photo. A photo of the wipe off sheet should be the first and last photograph taken at each site. 6. Record ALL JPEG numbers and fill in field remarks section on photopoint field form. Post-sampling efforts Photos should be transferred off of the camera immediately after they are collected. Transfer photos to BCD Google Drive account under the appropriate “Images” folder nestled in each site folder. Figure 28 – Example of whiteboard photopoint image 24 Cross-sections BCD will follow the Laser Level Cross-section Method protocol established in DEQ’s Field Procedures for Water Quality Assessment Monitoring manual; section 7.2.1 (see SAP reference). The following procedures are adapted from that section. The location of these sites are TBD. Equipment and Supplies • • • • • • • Sokkia model B30 Automatic Level 100’ reel-type tape measure 2 clamps Sokkia Tripod Crain 20’ Telescoping Leveling Rod GPS camera Cross-section monitoring field sheet and pencil Sampling Preparation 1. Locate the datum stakes established at each cross-section and setup the surveying at this location. The instrument should be placed at an elevation higher than the highest feature required for the survey. 2. Stretch a measuring tape (in ft.) across the channel and attach to datum stakes on either side with clamps, making sure the tape is perpendicular to the direction of the flow. Zero side of tape should be hooked to the left bank (looking downstream). 3. Attach the clamp attachment exactly at the top of a stadia rod such that the side with the laser panel on the clamp is facing away from the numeric gradations on the stadia rod. 4. If bankfull is not obvious on both banks, locate bankfull on the side that is most obvious, place the base of the stadia rod at this point and adjust the rod height until the sensor intercepts the laser. Then move to the opposite bank and walk upslope holding the stadia rod vertical; mark bankfull at the point where the sensor again intercepts the laser. 5. Determine the distance on the tape between left bankfull and right bankfull. Divide this distance by 15-30 to obtain 15-30 equidistant points along the cross-section within bankfull (use 30 points for larger streams). Step-by-Step Field Procedures 1. Begin the cross-section survey. Beginning at left bankfull and moving toward right bankfull, position the surveying rod on the stream substrate at each of the distances on the tape calculated in the previous step. Collect cross-section measurements at each calculated distance, as well as major breaks in bed elevation and key features such as 25 right bankfull (RBF), right water’s edge (RWE), Thalweg (THL), left water’s edge (LWE), and left bankfull (LBF). 2. At each distance point (“station”), hold the stadia rod vertical with the base on the substrate and adjust the rod height by extending or collapsing rod segments until the laser clamp indicates it is level with the laser level on the tripod (beeping will stop and high-pitched tone will remain constant). 3. Record the station (distance on the tape, ft) and the corresponding foresight (elevation, ft) at each station on the Channel Cross-Section (Laser) Form. Include notation indicating right bankfull (RBF), right water’s edge (RWE), Thalweg (THL), left water’s edge (LWE), and left bankfull (LBF). Note: It may be easiest to have one field crew member read the measurements off and the other record the information. 4. Flood-prone area calculations • Calculate in column “Height; Depth or Elevation”: Line 1: Subtract RBF from itself = 0 Lines 2 - X: Subtract RBF from each subsequent foresight measurement • Calculate the average of all values in the “Height” column = average elevation • Calculate the elevation of the flood-prone area (FPA): Step 1: Measure foresight at Max Depth (Dmax) Step 2: Measure foresight at right bankfull (RBF) Step 3: Subtract step 2 from step 1 (Dmax – RBF) Step 4: Multiply step 3 by 2 ((Dmax-RBF) x 2) Step 5: Subtract step 4 from Step 1 (Dmax - ((Dmax-RBF) x 2)) 5. Adjust the stadia rod height to the elevation of the FPA (step 5 above). Move the rod up the bank slope and along the cross-section (away from the stream channel) in both directions until the sensor intercepts the laser. Mark the FPA locations on both banks. 6. Use a rangefinder or tape to measure the straight-line distance between the two FPA locations. This is the flood-prone area width (Wfpa) (width of the channel at an elevation that is 2 times the maximum bankfull depth). Post-sampling Efforts 1. Calculate mean depth and the width/depth ratio (bankfull width/mean depth) 2. 3. Calculate the entrenchment ratio = FPA width (Wfpa) / Bankfull width (Wbkfl) 4. After ensuring the appropriate sections of the field sheet are filled out, return field sheets to BCD office. These should be scanned and stored on BCD’s Google Drive account and the hardcopies stored in the BCD filing cabinet. 26 Juvenile Trout Count Equipment and Supplies • • • • Smith-root LR24 Backpack Electrofishing unit Nets Length board Notepad Sampling Preparation Before heading out to field, one should familiarize themselves with how to operate the electrofishing unit by reading the user’s manual (see attachment D). Navigate to sampling site, located just upstream of Hahn’s Ranch flow cross-section. Step-by-Step Field Procedures 1. Set appropriate voltage and wave form on electrofishing unit (200 volts, 30 hertz) 2. Perform a single upstream pass, sampling for a duration of 1000-2000 seconds (one person holding unit, another person netting fish) 3. Count and measure total of all fish captured and record on notepad 4. Record exact time (in seconds) of sampling effort on notepad 5. Make note of sampling conditions. including turbidity and flow patterns, and other field remarks Post-Sampling Efforts After sampling, the catch per unit effort for each individual species observed should be calculated. A qualitative assessment of how sampling conditions might have effected sampling efficiency should be included in analysis. Equipment Maintenance and Calibration Calibration of electrofishing unit will be performed immediately proper to use in the field. Procedures for maintenance and calibration can be found the user’s manual (see attachment D). http://www.smith-root.com/images/smith-root/downloads/70/07288.005_lr24_electrofisher_manual.pdf 27 Out-migrant Trout Count Equipment and Supplies • • • • • • • 5’ diameter rotary screw trap Net Gallon buckets Length board Fish ID book Notebook and pencil Thermometer Sampling Preparation To perform this assessment, the screw trap needs to be installed in the creek immediately downstream of concrete head gate structure (above the Montana Ditch syphon). It will take at least 5 people to move screw trap and position it properly. Attach screw trap to head gate structure with rope to secure it in place. Step-by-Step Field Procedures Fish trap should be visited at least two times a day (morning and afternoon) during the high flow season so that debris jams can be removed if present. Once flows have gone down, visits can reduce to once a day. During the sampling period, trap should be visited and fish recorded at least 5 days/week. 1. 2. 3. 4. Use a net to catch all fish caught in the trap, and move to gallon bucket. Record the species and length of trout on notepad Record the number of non-game fish species Record stream conditions, including both staff gauge height, turbidity and any other field remarks 5. Place thermometer in stream for at least 10 minutes and record temperature 6. Perform periodic efficiency check To perform this check, mark portion of captured fish with fin clips, record their number on the appropriated field notes for the day, and re-release up stream. On the following day, make note of how many marked fish were re-captured and record the percent efficiency of the fish trap for that sampling day (Note: efficacy check needs to be performed at least once and again if stream conditions change) 28 Post-Sampling Efforts Field sheets will be collected and stored together at the FWP office over the sampling period. At the end of this sampling, total fish movement will be calculated using number of fish observed and percent efficiency. Only data from “complete trap nights” (e.g. no debris jams observed the following morning) will be used to calculate the total number of trout. Resident Fish Population Estimate This assessment will be performed following the same procedures outlined in the 1991 “Initial Effects of Stream bank Stabilization on a Small Trout Stream” study performed by Water Virgil McClure. Macroinvertebrate Sampling This assessment will be conducted in accordance to procedures used by Hydrotech Inc. personnel in the 1997 and 2003 macroinvertebrate assessments on Deep Creek. See attachment E below for the final report of this assessment, which includes detailed description of the protocols used to collect and analyze macroinvertebrate data. Revegetation Assessment BCD is currently in the process of hiring a contractor to create a revegetation design for Deep Creek. Methods to monitor these sites post-implementation will be conducted according to recommendations established in this revegetation plan. The protocol for monitoring revegetation will be added to the next modified version 29 Beaver and Redd Counts Equipment and Supplies Notebook and pencil Sampling Preparation Walking entire reach takes several hours and this should be anticipated before heading out into the field. If planning on doing the whole length in a single day, start early and anticipate taking a full day (between 6-9 hours depending on physical prowess) to do this assessment. Step-by-Step Field Procedures Enter the stream at the at either the Highway 12 E bridge site and walk downstream to Clopton Lane bridge, or vice versa. Redds and beaver dams observed should be recorded for the entire length of this reach. Post-Sampling Efforts Following this assessment, data should be transferred to ongoing beaver dam/redd excel spreadsheet, which computes data to a graph for reporting purposes. Figure 29 – Beaver dam on Deep Creek 30 Blank Field Data Sheets 31 Flow field sheet 32 33 Cross-section field sheets (Adopted from MDEQ) 34 35 Photopoint field sheet 36 Attachment A – Hach 950 Handheld Pro Flowmeter user’s manual Attachment B - Marsh McBirney FLO-mate 2000 user’s manual Attachment C - Hobo Water Temp Pro V2 user’s manual Attachment D - LR-24 Electrofisher user’s manual Attachment E – “A Biological Assessment of Sites on Deep Creek: Broadwater, CT”, 2003 37 38