1
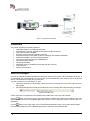
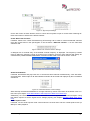
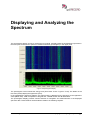
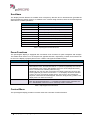
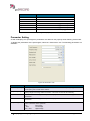
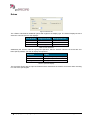
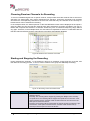
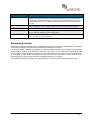
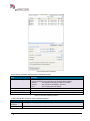
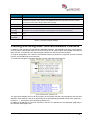
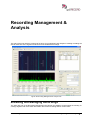
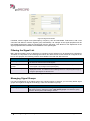
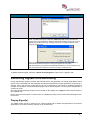
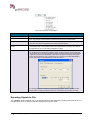
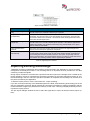
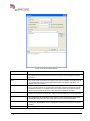
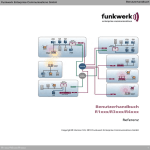
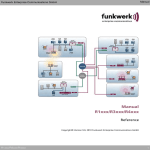
User Manual go2RECORD by PLATH AG, Switzerland Imprint PLATH AG Stauffacherstrasse 65 CH-3014 Bern Phone: +41 311 6446 www.go2signals.ch [email protected] All brand names in this document are trademarks or registered trademarks of their owners. © 2013 PLATH AG All rights, including those for translation, reserved. Reproduction in whole or in part in any form is prohibited without written consent of the copyright owner. Specifications are subject to change. All rights reserved Printed: 5 August 2013 Contents Introduction 1 Revisions ................................................................................................................. 1 Configuration ........................................................................................................... 1 Features .................................................................................................................. 2 GUI Concepts.......................................................................................................... 2 Quick Start 3 Receiver Configuration ........................................................................................... 3 Graphical User Interface ......................................................................................... 3 Operation ................................................................................................................ 4 Displaying and Analyzing the Spectrum 9 Scrollbars .................................................................................................10 Zoom Functions .......................................................................................10 Context Menu ...........................................................................................10 Keyboard Shortcuts .................................................................................11 Parameter Setting ....................................................................................12 Cursors.....................................................................................................13 Extras .......................................................................................................14 Real-Time Monitoring & Recording 15 Selecting and Controlling the Wideband Receiver(s) ...........................................15 Setting the Receiver Frequency and Bandwidth......................................16 Advanced Receiver Control Functions (Option) ......................................17 Recording Wideband Signals................................................................................17 Choosing Receiver Channels for Recording ............................................18 Starting and Stopping the Recording .......................................................18 Recording Scheduler ...............................................................................19 Creating and Using Real-Time Narrowband Channels.........................................21 Creating, Moving and Deleting Real-Time Channels ..............................22 Audio Demodulation and Playback of Real-Time Channels ....................23 Streaming Real-Time Channels ...............................................................23 Recording Management & Analysis 25 Browsing and Managing Recordings ....................................................................25 Opening Recordings ................................................................................26 Deleting Recordings .................................................................................26 Displaying and Analyzing Single Recordings .......................................................26 Using Magnifier and Overview .................................................................26 Selecting and Organizing Signals of Interest ........................................................27 Creating New Signals ..............................................................................28 Editing the Signal List ..............................................................................29 Filtering the Signal List .............................................................................30 Managing Signal Groups .........................................................................30 Extracting Signals from Recording........................................................................31 User Manual go2RECORD Contents iii Playing Signal(s) ......................................................................................31 Exporting Signals to File ..........................................................................32 Importing Existing Recordings ..............................................................................33 iv Contents Glossary of Terms 37 List of Figures 43 List of Tables 44 Index 45 User Manual go2RECORD Introduction Revisions Release 0.9 Date 2013-06-14 Editor MBu History Spectrogram Display first level chapter go2RECORD is an application for recording and analysis of digital wideband radio signals. This document provides a brief overall introduction as well as detailed instructions for controlling the system through its graphical user interface. Configuration Each system instance consists of the following components: One or several digital wideband receivers (currently supported are IZT R3xxx, PLATH DBT 5400 or NI PXI-5661) A server with a RAID storage unit This component performs all operations on a wideband signal including real-time and offline spectrum calculation, signal storage in a RAID array and the extraction of narrowband signals from recordings. It is delivered as a ready-to-use combination of server grade hardware and preinstalled software. The GUI is a software solution enabling the operator to control all other system components. It is delivered as an installable software package and can run on a standard PC under a Windows operating system. It connects to a running server. Optional signal analysis software for in-depth analysis of extracted signals may be installed, usually on the same computer as the GUI. User Manual go2RECORD Introduction 1 Figure 1 Configuration Example Features The system provides the following features: Wideband real-time and offline spectrogram Simultaneous recording, playback and analysis of signal scenarios Fast and interactive navigation Selection and processing of signals of interest Extraction and export of signals or parts of recording with arbitrary bandwidth Seamless integration of technical signal analysis Listening to narrowband signals (SSB/AM/FM) Several recording modes Recording scheduler Panorama mode for wideband monitoring (with IZT-receiver) Import function Intuitive user interface GUI Concepts The GUI is a standard software package providing full control of the system and the wideband receivers. It is preinstalled and preconfigured to connect to the server automatically upon starting. Only a single GUI can be connected to the server at any given time. The GUI consists of two main areas, i.e. tabs: Real-Time Monitoring & Recording including all tools to manage and record the real-time wideband signal Recording Management & Analysis including all tools to manage and analyze existing recordings Figure 2 GUI Main Tabs These UI's areas are organised in two separate tabs visible at the top of the main window. Use the button in the upper right corner of the window to detach the currently active tab from the main window and use this tab as a separate application window. This is especially useful in dual-monitor configurations. Use the button in the upper right corner of the detached window to dock it in the main window again. The following chapters provide a detailed description of these two user interface tabs. . 2 Introduction User Manual go2RECORD Quick Start To start the application, double click the control icon on your desktop or your start menu. If questions occur, please consult your system administrator. Receiver Configuration After installation of the software you have to make several changes in the configuration files. If your current user profile has administrator privileges, open the configuration file “wplayer.conf” in the installation directory. The configuration file will be copied to your user directory after first startup. All further changes have to be made in the configuration file in the user directory. If you do not have administrator privileges, start the application first by clicking its shortcut on your desktop. Close your application after startup and edit the file “wbplayer.conf”, which is now located in your user directory. You can edit this configuration file without administrator privileges. Open the configuration file and change the values of the keys “IPAddress” for VDC and IZT receivers to their corresponding IP addresses. For IZT receivers you must also set the value of the key “LocalHostAddress” to the IP address of your local system. Check whether the values of the keys “InitSequence” and “OverviewSequence” refer to the files “IZT_InitSequence.txt” and “IZT_OverviewSequence.txt” in your installation directory and correct them if necessary. Open the file “IZT_InitSequence.txt” in your installation directory and set the IP address of your system for “Ch1CbbDestIP”. Start the application by clicking the shortcut on your desktop. Graphical User Interface Once the application is started, the user interface will be displayed on screen. It features two tabs labeled <Real-Time Monitoring & Recording> and <Record Management & Analysis>. User Manual go2RECORD Quick Start 3 Figure 3 Graphical User Interface Operation Select Receiver Select the desired receiver in the list of available receivers on the <Real-Time Monitoring & Recording> tab. Figure 4 Receiver Selection The receiver's real-time signal is visualized in the wideband spectrum (spectrogram and instantaneous spectrum). The context menu and the property sheet provide access to the desired functions and parameters. 4 Quick Start User Manual go2RECORD Specify Frequency or Bandwidth (Option) Figure 5 Receiver Frequency Settings If need be, specify the desired receiver frequency and bandwidth for the selected receiver in the group box Receiver settings (not supported by every receiver). Select Channels Select the channels to be recorded from the list of available channels. Figure 6 Channel Selection Please bear in mind that only adjacent channels can be selected. Channels with a disabled disk symbol cannot be selected. Start/Stop Recording Figure 7 Recording Control After selection of the channels use the controls and list boxes in the group box Start/stop recording to make your recordings. Open Recording Open the <Record Management & Analysis> tab. Open the desired recording from the list of recordings via double click or via the context menu. User Manual go2RECORD Quick Start 5 Figure 8 Recording Selection Create Signals The recording is displayed in the spectrogram and the spectrum display. The context menu and the property sheet provide access to the desired functions and parameters. In addition, use the magnifier and overview tool windows for further analysis (see chapter Using Magnifier and Overview). . Figure 9 Signal Selection Select the desired signals using the mouse and the item Create signal from selection on the context menu, or insert X-cursors and select the context menu item Create signal from cursor position. The signals are highlighted in the display and included in the signal list on the property sheet. Figure 10 Signal List Extract Signals All exporting and streaming functions are accessed via the <Play> and <Export> buttons at the bottom of the <Signals> tab. 6 Quick Start User Manual go2RECORD Figure 11 Signal Export Settings On the left of each of these buttons, there is a down-arrow symbol to open a context menu featuring different menu items to influence the button behavior. Create Real-Time Channels If desired, switch to the <Real-Time Monitoring & Recording> tab in order to create narrowband channels using the context menu in the spectrogram or use the button <Add new channel…> on the <Real-time channels> tab. Figure 12 Real-Time Channel Creation Settings A dialogue box for manual entry of the desired channel frequency is displayed. The frequency entered must be within the frequency range of at least one of system’s receivers. New channels will always be created with a predefined default bandwidth of 20 kHz for DBT 5400 or 25 kHz for the IZT receiver. Figure 13 Real-Time Channel Addition Settings Audio Demodulation If desired, demodulate and play back one or several real-time channels simultaneously, each with different parameters. Audio output of all demodulated channels will be mixed and replayed by the local default soundcard. Figure 14 Audio Demodulator Control Settings Start and stop the audio demodulation for a single channel by means of the items at the bottom of its context menu (see chapter Audio Demodulation and Playback of Real-Time Channels). Additionally, the real-time channels can be streamed to external applications for further analysis. Using this feature requires to set the signal source settings properly (see chapter Streaming Real-Time Channels). Audio Squelch Level If desired, use the Audio squelch level control below the channel list to set the overall squelch level (in dBFS) for audio playback. User Manual go2RECORD Quick Start 7 Figure 15 Audio Squelch Level Settings 8 Quick Start User Manual go2RECORD Displaying and Analyzing the Spectrum The spectrogram display serves to monitor the input signal. It displays both the instantaneous spectrum in the lower pane as well as the spectrum variations with time (spectrogram) in the upper pane. Figure 16 Spectrogram Display The spectrogram colors indicate the energy level (from black blue green red). The labels on the time axis (Z-axis) display the signal time (UTC). In the instantaneous spectrum graphics, the signal energy is displayed in the spectrum on the logarithmic scale (dBFS units). 0 dB corresponds to full gain and –100 dB means 100 dB attenuation. The spectrogram display provides various features for navigation and measurements in the displayed spectrum data. These features are described in detail in the following chapters. User Manual go2RECORD Displaying and Analyzing the Spectrum 9 Scrollbars The display window features a scrollbar each in frequency direction and in time direction (provided the signal exceeds the display section). In addition to the common drag functions, there are several keyboard shortcuts for scrollbar operations: Shortcut Function Mouse Wheel Move scrollbar in time direction <Shift> + Mouse Wheel Move scrollbar in frequency direction <Right Arrow> Move frequency scrollbar to the right <Left Arrow> Move frequency scrollbar to the left <Up Arrow> Move time scrollbar up (closer to the start) <Down Arrow> Move time scrollbar down (closer to the end) <Page Up> Move time scrollbar up one page towards the start <Page Down> Move time scrollbar down one page towards the end <Home> Move time scrollbar up to the start <End> Move time scrollbar down to the end Table 1: Spectrogram Scrollbar Shortcuts Zoom Functions The spectrogram display is equipped with convenient zoom functions for quick navigation and analysis. The default zoom factor is 2 or its reciprocal in opposite direction, respectively. Custom zoom factors can be set on the display's property sheet on the <Extras> tab (spin box Relative factor). Item Function <Ctrl> + Mouse Wheel Zoom in/out (no cursors activated) <+> Zoom in With enabled cursors, the keyboard shortcut <+> permits to graphically zoom into the area delimited by the cursors. With disabled cursors, the zoom enlarges the area by factor ½ each time it is activated (X-direction only). Additionally, the user may draw a rectangle in the display window and zoom into this section graphically by means of the shortcut <+>. If the display window has activated cursors, the zoom via rectangle will take priority. After zooming, the rectangle displayed as a white dotted line will disappear. Otherwise, simply click any position in the display window to delete the rectangle. <-> Zoom out Each time the keyboard shortcut <-> is activated, the display area is enlarged by factor 2. With disabled cursors the zoom is exclusively made in X-direction. Table 2: Spectrogram Zoom Functions Context Menu The spectrogram display provides a context menu with a number of useful functions: 10 Displaying and Analyzing the Spectrum User Manual go2RECORD Figure 17 Spectrogram Display Context Menu Note : The Overview is available only with recordings. Item Function Cursor Activate and deactivate X-, Y-, Z- and Harmonic cursors Zoom range Max. Frequency Range Zoom to maximum frequency range Max. Time Range Zoom to maximum time range (display entire buffer without scrollbar) Zoom in Enlarged view of the section delimited by the cursors. Repeat this process until the spectrum area displayed is satisfactory. Zoom out Reduced view of the section delimited by the cursors. Repeat this process until the spectrum area displayed is satisfactory. Immediate mouse zoom Zoom in by clicking the mouse at the desired position (zoom out using the <Ctrl> key). Move The mouse pointer changes into a hand. Drag the displayed section in the desired direction by moving the mouse while keeping the left mouse button pressed. Magnifier The mouse pointer changes into a magnifying glass superimposed on a rectangle. On mouse click, a separate window is opened displaying the magnified contents of the spectrogram display. Select the section to magnify, either by drawing a rectangle before activating the magnifier function or simply clicking the position of interest in the spectrogram display. For further details, see chapter Using Magnifier and Overview. Overview (Recordings only) The mouse pointer changes into a magnifying glass superimposed on a rectangle. A separate window is opened displaying the spectrogram overview of the complete recording. For further details, see chapter Using Magnifier and Overview. Table 3: Spectrogram Display Functions Keyboard Shortcuts In summary, the following keyboard shortcuts are available in the spectrogram display: Shortcut Function Mouse Wheel Move scrollbar in time direction <Shift> + Mouse Wheel Move scrollbar in frequency direction <Right Arrow> Move frequency scrollbar to the right <Left Arrow> Move frequency scrollbar to the left <Up Arrow> Move time scrollbar up (closer to the start) <Down Arrow> Move time scrollbar down (closer to the end) <Page Up> Move time scrollbar up one page towards the start <Page Down> Move time scrollbar down one page towards the end <Home> Move time scrollbar up to the start User Manual go2RECORD Displaying and Analyzing the Spectrum 11 Shortcut Function <End> Move time scrollbar down to the end <+> Zoom in <-> Zoom out <x> Activate and deactivate X-cursors (toggle function) <y> Activate and deactivate Y-cursors (toggle function) <z> Activate and deactivate Z-cursors (toggle function) <h> Activate and deactivate Harmonic cursors (toggle function) Table 4: Spectrogram Display Keyboard Shortcuts Parameter Setting As with all displays, the spectrogram’s parameters are edited on the property sheet featuring several tabs. To display the parameters of the spectrogram, select the <Parameters> tab. The following parameters are available: Figure 18 Parameters Tab Parameter Function Centre frequency The frequency section to be viewed is set in combination with the frequency range. The center frequency is the center of the section. Frequency range The frequency section to be viewed is set in combination with the center frequency. The frequency range is the range within the section. The zoom can thus be set manually. Maximum level Definition of the level range in the spectrum display. The maximum level is the upper end of the section. Minimum level Definition of the level range in the spectrum display. The minimum level is the lower end of the section. Exp. average The spectrum is displayed as an average of several spectra. Changing the spectrum will result in a total view of the spectrum. 0%: No average - 80%: Low average 80% - 99%: High average 12 Displaying and Analyzing the Spectrum User Manual go2RECORD Parameter Function 100%: No updating of the spectrum Lines / second Number of spectra that can be calculated and displayed within one second. This parameter permits to set the time resolution for the spectrogram, thus also setting the scroll speed. Display mode In mode Line, the spectrum is displayed as a closed curve. In mode Beam, the individual values are displayed as bars. Peak hold time When the time adjusted has elapsed, the peak hold (the red curve in the spectrum) will be reset by setting on the current spectrum. 0 means no reset. Peak hold pause This checkbox serves to freeze the continuous display after a period specified in the spin box Peak hold time (button <Pause> is activated and locked). It can only be ticked if the button <Peak hold> has been activated. This function will not stop the signal flow between the signal processing modules. To reactivate the continuous update of the display, press the button <Pause> again (toggle switch). <Pause> In Pause, the display is stopped (not the signal processing). Editing the parameters is possible for a more detailed analysis of the current signal range. <Autorange> Automatic setting of the displayed range to view the total amplitude and frequency range. The mode Autorange analyzes 12 spectral lines approx. The display is adapted in every change of the range. On pressing <Autorange> again, the process will be deactivated (toggle). <Peak hold> On activation of Peak Hold, the maximum energies in the spectrum are recorded and displayed as a red curve. Table 5: Spectrogram Display Parameters Cursors Figure 19 Cursor Tab The <Cursor> tab accommodates all functions related to cursor operations except for the relative zoom factor setting. User Manual go2RECORD Displaying and Analyzing the Spectrum 13 Extras Figure 20 Extras Tab The <Extras> tab features additional options with regard to the display type. The list box Display serves to select the color schemes for the displays: Color Scheme Foreground Color Background Color Standard light black Inverse dark white Monochrome shades of grey white Table 6: Color Schemes Additionally the <Extras> tab has a group box Spectrum, which is inactive unless the Z-cursors are enabled. Specify whether you wish to display the spectrum: Spectrum Display Normal Usually averaged exponentially At Cursor 1 Exactly at the position of Cursor1 Average value Cur. 1/2 Averaged between the two cursors Table 7: Spectrum Display The group box Zoom with the spin box Relative factor determines the relative zoom factor when zooming in or out in the spectrogram. 14 Displaying and Analyzing the Spectrum User Manual go2RECORD Real-Time Monitoring & Recording This part of the user interface controls all functions related to the wideband receivers, the real-time signal display and the starting or stopping of wideband recordings. Figure 21 Real-Time Monitoring & Recording Tab Selecting and Controlling the Wideband Receiver(s) A single system can control and use several wideband receivers at a time. The receivers currently supported are IZT R3xxx (HF/VUHF, max. bandwidth 16 MHz), PLATH DBT 5400 (HF, max bandwidth User Manual go2RECORD Real-Time Monitoring & Recording 15 2 MHz) and NI PXI-5661 (HF/VUHF, max bandwidth 20MHz). The physical receiver configuration is preconfigured in the server and cannot be changed via the GUI software. Once the GUI has been started and the connection to the server is established, the current receiver configuration appears in a Receivers and channels tree view on the <Spectrum & Recording> tab. The screenshot below shows an example configuration with two DBT 5400 receivers and one IZT R3xxx receiver. Figure 22 Receivers and Channels Tree View The first tree-view level displays the physical receivers, their types, their connection status and current frequency range. Each receiver on this level can be selected for monitoring by activating the checkbox next to the corresponding item (first DBT5400 in the above example). This selection will cause this receiver's real-time spectrogram to be displayed in the spectrogram pane. In the case of DBT5400, it is possible to select two receivers at a same time provided they have adjacent frequency ranges. For details about viewing and managing this real-time spectrogram please see chapter Displaying and Analyzing the Spectrum. The second tree-view level displays the single channels of each receiver with their frequency range. These channels represent the smallest unit of a wideband signal which can be chosen for recording. Default setting for DBT5400 is to have four channels with a bandwidth of 500 kHz, and for the IZT receiver one channel with a bandwidth of 16 MHz. For details about channel selection and recording please consult the chapter Choosing Receiver Channels for Recording. Setting the Receiver Frequency and Bandwidth For IZT and NI receivers, the GUI provides the option to adjust the receiver frequency and bandwidth directly in the user interface. The corresponding controls are located under the receiver’s tree-view in the group box Receiver settings: Figure 23 Receiver Settings Having highlighted an IZT receiver in the tree view, this group box is enabled, permitting to enter the new receiver frequency and bandwidth and to command it to the receiver. After the frequency or bandwidth setting, the user interface will be disabled for a few seconds until the new settings have been accepted by the receiver. Also, any active recording will be stopped automatically once the receiver frequency or bandwidth has been changed. In special configurations in which the application shares the receiver with other systems, this feature might be permanently disabled to ensure that other systems be not interrupted in their operations. 16 Real-Time Monitoring & Recording User Manual go2RECORD Advanced Receiver Control Functions (Option) In addition to the controls to change the receiver frequency and bandwidth, the GUI provides two more receiver control functions for monitoring purposes: Frequency Stepping With this function the operator can command the application to step through defined set of frequencies automatically, dwelling a certain amount of time on each frequency. The application always uses its current receiver frequency as start frequency for stepping. Figure 24 Frequency Stepping Settings Item Function Step up to frequency This spin box determines the end frequency for stepping. Once the application reaches the frequency adjusted, it will switch back to the start frequency and continue stepping. Step time interval This spin box specifies how many seconds the application is to stay on one frequency during stepping. Table 8: Frequency Stepping Parameters The stepping function is especially useful in monitoring big frequency ranges. The function cannot be used together with the recording – as soon as the recording process detects a frequency change, it will report an error and stop the current recording. Therefore, the stepping function is disabled while recording. Panorama (IZT only) The panorama function uses the frequency scan feature of the IZT R3xxx receivers to provide a panorama spectrum display of very wide frequency ranges (up to 3 GHz). During this operation, the receiver scans through the wide frequency range very fast and delivers a small piece of signal data for each frequency. The application calculates the spectrum from each signal piece and concatenates those in one very wide spectrum for monitoring purposes. The spectrum is displayed in a standard spectrogram view of the GUI. The spectrum resolution will usually be much lower than in standard view. Figure 25 Panorama Settings The stepping function is especially useful in monitoring big frequency ranges. The function cannot be used together with the recording – as soon as the recording process detects a frequency change, it will report an error and stop the current recording. Therefore, the panorama function is disabled while recording. Recording Wideband Signals The operator can choose the frequency range for recording by selecting the receiver and its channels in the receiver tree view. The following chapters describe this operation in detail. User Manual go2RECORD Real-Time Monitoring & Recording 17 Choosing Receiver Channels for Recording To record a wideband signal from a specific receiver, always select the actual receiver first to see its live spectrum in a spectrogram view. Having viewed the live spectrum, choose the channels to be recorded and select the corresponding channels in the tree view. Note that only the channels of the currently selected receiver can be selected for recording. In the example below, the whole spectrum of the first DBT5400 receiver will be displayed in the spectrogram (5-7 MHz), but only the first two channels have been selected for recording (5-6 MHz). The user interface will not permit the selection of channels unless they form a continuous frequency range without any gaps. Therefore, in the example below, the 4th channel is impossible to select in combination with the first two channels selected, and the channel item is therefore automatically disabled. Figure 26 Receivers and Channels Tree View Starting and Stopping the Recording Having selected the channels, i.e. the frequency range to be recorded, choose how long to record, and then start the recording process. To do so, use the controls in the group box Start/Stop recording: Figure 27 Recording Control and Status Pane Item End Function This field defines when and how the recording will be stopped. A list box provides the following options: Manually: The recording will be stopped by pressing the <Stop> button manually At specific time: The recording will be stopped at a specific time in the future. If this option has been chosen, enter the actual recording stop time (as UTC time) in the time spin box next to the list box. Duration: The recording will be stopped after the signal has been recorded for a specific duration. If this option has been chosen, enter the actual duration time (in minutes) in the time spin box next to the list box. 18 Real-Time Monitoring & Recording User Manual go2RECORD Item Function Loop recording If this checkbox is selected, the recording will be made in a ring buffer of a certain length. The length of ring buffer can be entered in the spin box next to the checkbox (in minutes). Once this buffer length is reached, the new signal data will overwrite the oldest signal data so you can always access the last (buffer length) minutes of the recording. <Record now> This button starts the recording in accordance with the above settings. It is not possible to change any of the recording settings once the recording has been started. <Stop active recording> Stops the recording currently active. Lock recording If this checkbox is selected, the recording will be locked so that it cannot be deleted by the automatic deletion from the storage server. Activity A text box containing information about events in the server, e.g. starting and stopping of recordings, errors or warnings. Table 9: Recording Parameters Recording Scheduler Apart from the manual recording control described in the previous chapters, the application also provides a recording scheduler to start and stop recordings automatically in the future. For each scheduled recording, the operator can define its desired start/end time as well as the frequency and the desired receiver. This information is stored on the server. Ten seconds prior to the defined start time, the server checks whether the recording can be started and sets the receiver to the desired frequency, if required. In case another recording runs at the time, or if it is not possible to set the receiver to the desired frequency, the server will mark the scheduled recording as erroneous. The recording scheduler is located on the right side of the <Real-Time Monitoring & Recording> tab. User Manual go2RECORD Real-Time Monitoring & Recording 19 Figure 28 Recording Scheduler The recording scheduler GUI features the following controls: Item Function Scheduled recordings table This table displays a list of all scheduled recordings including the ones already finished or erroneous ones. Generally, there are three different states: Finished: The application was able to make the recording. Pending: The recording is scheduled in the future Error: The recording cannot be started. <Delete all listed> This button serves to delete all listed scheduler entries. <Delete> This button serves to delete the selected item. Filter This checkbox is used to filter the content of the scheduled recordings table. Table 10: Recorder Scheduler Controls To add a scheduled recording, use the following settings: Item Function Begin and End-time These spin boxes determines the begin and end times of the planned recording. Duration The duration of the recording is displayed and can be edited in this spin box. 20 Real-Time Monitoring & Recording User Manual go2RECORD Item Function <Now> Use this button to set the begin and end times to the current time. Use receiver This drop-down list box permits to select a specific receiver which is to make the scheduled recording. On selection of any receiver, the application will go through all the receivers installed and try to find one which can be used for the recording. At frequency Use this spin box to define the desired center frequency for the scheduled recording. Bandwidth Use this spin box to define the desired bandwidth for the scheduled recording. Daily recording This checkbox determines whether the scheduled recording is to be made each day at the defined time. If so, the date information in the begin/end time spin boxes will ignored. Lock recording Activation of this checkbox causes the recording to be locked to prevent it from automatic deletion. <Add to scheduler> Select this button to schedule a recording and add it to the list of scheduled items. Table 11: Recorder Scheduler Settings Creating and Using Real-Time Narrowband Channels In addition to the monitoring of the real-time wideband spectrum, the application can also provide access to the receiver's narrowband channels. These channels can be used for audio demodulation and listening within the GUI, or streamed to the signal analysis software via network for further analysis. In a typical configuration, the number of narrowband real-time channels for a single IZT receiver is limited to three, and for DBT 5400 to ten channels. To create and manage the real-time channels, use the <Real-time channels> tab: Figure 29 Real-Time Channels Tab The upper pane displays a list of all the receivers in the system with their corresponding active real-time channels. Each channel in the list is represented by its automatically generated unique name (Channel 1, Channel 2,…), its frequency and a streaming network port. In addition to displaying the real-time channels in the list, the channels are also displayed graphically in the real-time spectrogram view: User Manual go2RECORD Real-Time Monitoring & Recording 21 Figure 30 Real-Time Channel in Spectrogram View Double-clicking on a real-time channel item in the list will zoom in the spectrogram view to the area around the channel. The same effect can be achieved by choosing the item Zoom in this channel on the context menu on the channel list. Creating, Moving and Deleting Real-Time Channels There are two ways to create new real-time channels: Item Function From live spectrogram view If X-cursors are inserted in the spectrogram (see chapter Cursors), these cursors serve to create real-time channels straight from the spectrogram context menu. Having positioned one of the X-cursors on the desired frequency position, choose one of the following options on the context menu to create a new real-time channel at the cursor position: From “Add new channel” dialog Clicking the <Add new channel…> button calls a dialogue box for manual entry of the desired channel frequency of the new real-time channel. The frequency entered must of course be within the frequency range of at least one of system’s receivers. On selecting the <OK> button, the new real-time channel will be created at the desired frequency. Table 12: Real-Time Channel Creation Options New channels will always be created with a predefined default bandwidth of 20 kHz for DBT 5400 or 25 kHz for the IZT receiver. Existing channels can be moved to another frequency in two ways. First select the channel by clicking its entry in the channel list or click its graphical representation in the spectrogram view. Item Cursors in spectrogram view Function If X-cursors are inserted in the spectrogram (see chapter Cursors), these cursors serve to move the currently selected real-time channels by selecting one of the following items on the spectrogram context menu: 22 Real-Time Monitoring & Recording User Manual go2RECORD Item Function Double-click in spectrogram view Double-click the desired position in the spectrogram to automatically move the currently selected real-time channel to the clicked frequency position. Table 13: Real-Time Channel Reassignments To delete a real-time channel, click its entry in the tree view and choose the item Delete this channel on the context menu. To delete all real-time channels simultaneously, select the button <Delete all channels>. Audio Demodulation and Playback of Real-Time Channels The GUI features audio demodulation and playback functions to enable the direct processing of the created real-time channels in the application without using external applications. It is possible to demodulate and playback several real-time channels simultaneously, each with different parameters. Audio output of all demodulated channels will be mixed and replayed by the local default soundcard. Audio demodulation for a single channel can be started or stopped by use of the items at the bottom of its context menu: Figure 31 Audio Demodulation Context Menu The default setting for new channels is No playback, meaning that the real-time channel data will not be used for audio demodulation by the GUI. In this case, it is possible to use external applications to access the channel data. For further details, see chapter Streaming Real-Time Channels. To start the audio demodulation of a channel, simply select one of the Play as… options on the context menu with the desired demodulator type (USB, AM, LSB or FM). Demodulation and playback will start instantly. To turn demodulation off, select the menu item No playback again. Channels currently subjected to audio demodulation are displayed in the channel list with an asterisk and the demodulation type text inserted in front of channel data as shown in the example below: Figure 32 Real-Time Channel with Audio Demodulation Highlighted The Audio squelch level control below the channel list serves to set the overall squelch level (in dBFS) for audio playback: Figure 33 Audio Squelch Level Control Streaming Real-Time Channels If the real-time channel is not being used for audio demodulation in the application as described in the previous chapter, signal analysis software can be used to receive the channel data and to analyze it further in real time. User Manual go2RECORD Real-Time Monitoring & Recording 23 Using this feature requires to set the signal source settings properly in the signal analysis software. Go to Options dialogue box (menu Extras - Options), and enter the IP address of the server computer in the group box Signal source on the <Network> tab. If questions occur, contact your system administrator for the exact value. In the Channel box, enter the channel ID + 200 (e.g. 201 for Channel 1). Figure 34 Signal Source Settings On closing the Options dialog box and pressing the button <Play>, you will see the signal data as generated by the real-time channel. Please note that audio demodulation in the GUI application and streaming to the signal analysis software are mutually exclusive operations, i.e. it is not possible to use one channel for audio demodulation in the GUI application and at the same time receive its data in the signal analysis software. 24 Real-Time Monitoring & Recording User Manual go2RECORD Recording Management & Analysis This part of the user interface controls all functions for management and analysis of existing recordings as well as extraction of the signals of interest from the wideband recordings. Figure 35 Recording Management & Analysis Tab Browsing and Managing Recordings The lower left part of the Recording Management & Analysis view displays a table listing the existing recordings together with some basic information about each recording and its current state. User Manual go2RECORD Recording Management & Analysis 25 Figure 36 List of Recordings The recording state is signaled by color coded icons in the State column of the table: Color Recording State Green The recording is completed and can be opened for analysis. Yellow The recording process is currently running. The actual recording cannot yet be opened or used. Red An error has been detected in this recording. An error description will be displayed in the Information column. Table 14: Recording State Color Code Opening Recordings The first step when working with recordings will usually be to choose and open a recording. To do so, double click the respective row in the table or select the item Open recording on the table context menu. The recording is opened and its spectrogram is displayed in the offline spectrogram view. Deleting Recordings Existing recordings can be deleted by choosing the item Delete recording on the table context menu. Deleting multiple recordings simultaneously is also possible by selecting multiple rows in the table and choosing the item Delete X recordings on the context menu. Displaying and Analyzing Single Recordings After the recording has been opened as described in the chapter Opening Recordings, its spectrogram will be displayed in the offline spectrogram view above the recordings table. Since the spectrum data has already been calculated and stored on the server while recording, the spectrogram display will be instantaneous even with very long recordings. The initial recording display will display the full recording bandwidth (in the upper screenshot 16 MHz) and a maximum of 10s time segments from the beginning of recording. Using Magnifier and Overview For faster navigation in long recordings, the spectrogram provides two tools, i.e. Overview and Magnifier, which are opened as separate tool windows via the context menu of the offline spectrogram (see chapter Context Menu). 26 Recording Management & Analysis User Manual go2RECORD Figure 37 Magnifier and Overview Windows The Overview window always displays the complete recording. On selecting part of the overview spectrogram with the mouse, the main offline spectrogram will zoom in or out to display exactly that part of the recording. The Magnifier window always displays a small part of the main offline spectrogram. On selecting part of the spectrogram in its main offline spectrogram with the mouse, the Magnifier spectrogram will display the part magnified. Selecting and Organizing Signals of Interest Signals of interest are highlighted directly in the offline spectrogram with the mouse pointer, or more accurately using frequency/time cursors. The highlighted signal is inserted into the signal list together with its parameters such as center frequency, bandwidth and time. The complete management of selected signals and groups is accommodated on the <Signals> tab next to the offline spectrogram. User Manual go2RECORD Recording Management & Analysis 27 Figure 38 Signals Tab The following sections describe all operations with signal selection, grouping and exporting. Creating New Signals New signals are selected directly in the offline spectrogram using one of these methods: Item Direct mouse selection Function Simply make a selection in the offline spectrogram using the mouse and then choose the item Create signal from selection on the context menu. A new signal will be created and will appear in the list. The name of the new signal will be automatically generated in the form of Signal<ID>. 28 Recording Management & Analysis User Manual go2RECORD Item Frequency/time cursor Function Provided the X- and Z-cursors are active, use these cursors to select exactly the part of the spectrogram to be used to create the new signal. On choosing the item Create signal from cursor position on the context menu, a new signal will be created and appear in the list. The name of the new signal will be automatically generated in the form of Signal<ID>. Table 15: New Signal Creation Functions The new signal will automatically be created with a group membership in the group selected in the Current group list box (for details, see chapter Filtering the Signal List). Editing the Signal List On clicking a signal entry in the signal list, the signal's detailed properties will be displayed below the list. User Manual go2RECORD Recording Management & Analysis 29 Figure 39 Signal List Details If desired, edit the signal name (Description), frequency, time and bandwidth. Furthermore, add a text comment and define or edit the signal’s group membership. All changes of the signal properties will be immediately displayed in both the spectrogram and the signal list. This allows for fine adjustment of the signal properties with immediate visual feedback in the spectrogram. Filtering the Signal List Many signal operations such as streaming or exporting can be performed on all signals from a signal list. Therefore, it is important to have filtering tools which can affect the list content and order of signals in the list. For this purpose, the following controls are available in the filter bar above the list: Item Function Current group This list box defines whether only the signals belonging to a certain group will be visible in the list. Choose All to see all signals. Recording-specific groups This list box determines the order of the signals in the list. Sort either by the start time of the signal or by the signal name (Description). List visible only If this checkbox is selected, only signals currently visible in the spectrogram will be displayed in the list. This allows for exact filtering based on a frequency/time range by using the spectrogram as selection tool. Table 16: Signal List Filtering Parameters Managing Signal Groups For easy management of recordings with many selected signals of interest, you can freely define signal groups and organize its signals accordingly. There are two kinds of groups: Item Default groups Function Default groups are valid for all recordings and will appear in each recording. Define or edit these groups by clicking the button <Edit default groups> and enter the group names in the text pane of this dialogue window: 30 Recording Management & Analysis User Manual go2RECORD Item Sort by Function Recording-specific groups can be created in each recording and will be valid only there. To create a new group, select the <Add new group> button and enter the group name in the dialogue box displayed. Additional checkboxes permit to move all signals from the list to the newly created group and to set a filter to select the new group as current group. Once the group has been created, it will become available in the signal properties where the Group list box allows for moving the signal to the new group. Recording-specific groups will be automatically deleted if they do not contain any signals and the operator switches to another recording or closes the GUI. Table 17: Record Signal Group Management To delete all listed signals, select the <Delete all listed signals> button on the <Signals> tab. Extracting Signals from Recording Having selected the signals of interest and grouped them in the application, the actual signal data of these signals can be extracted from the wideband recording and transferred to other applications for further processing. During this process, signal groups can be concatenated to one signal to facilitate subsequent analysis. For example, several short-time signals can be joined together in a group and analyzed like a continuous signal. All exporting and streaming functions are accessed via the <Play> and <Export> buttons at the bottom of the <Signals> tab. Next to each of these buttons, a context menu is available providing various menu items affecting the button function. Playing Signal(s) The <Play> button serves to extract one or several signals and to stream the signal data to an external application in accordance with the settings on its context menu. User Manual go2RECORD Recording Management & Analysis 31 Figure 40 Play Button Context Menu Item Function Play selected signal only This option will cause only one selected signal to be extracted and streamed. Play all listed signals This option will extract all signals currently visible in the list exactly in the list order. Each signal will be streamed with its specific time information and bandwidth. Play in loop This option will cause endless extraction and streaming by repeating the whole process each time the last signal has been extracted and streamed. Play as USB/AM/LSB/FM audio If one of these options is selected, the extracted signal will be streamed to the GUI, demodulated with a selected demodulator and played back for listening. This feature is supported only up to a recording bandwidth of 2 MHz. Play with external This option will enable the optional signal analysis software to receive streamed data. To use this feature, signal source settings has to be setup properly in the signal analysis software. Go to the signal analysis software’s Options dialogue box (menu Extras - Options), and enter the IP address of the server computer in the group box Signal source on the <Network> tab. If questions occur, contact your system administrator for the exact value. In the Channel box, enter the value 1. On closing the Options dialog box and pressing the button <Play>, you will see the signal data in the signal analysis software as generated by the real-time channel. Table 18: Signal Playing Functions Exporting Signals to File The <Export> button extracts one or several signals from the wideband recording and stores them in a complex WAV file in accordance with the settings on its context menu. 32 Recording Management & Analysis User Manual go2RECORD Figure 41 Export Button Context Menu Item Function Export selected signal only This option will cause only the selected signal to be extracted and stored in a file. The file name for the result file is defined by the operator. Export all listed signals (multiple files) This option will cause all signals currently visible in the list to be extracted to separate signal files. The file name for the new file is defined by the operator. This name will be used as a base for the result file – the actual file name will be generated from the base name and the signal name. Export all listed signals (single file) This option will cause all signals currently visible in the list to be extracted to one file. The file name for the new file is defined by the operator. If the selected signals have different bandwidths, they will all be extracted by using the bandwidth of the signal with the maximum bandwidth. Open exported files in external This option will cause the resulting signal to be opened in the signal analysis software as soon as the export operation is completed. Generate file names automatically This option will cause the file name(s) to be generated automatically without prompting the operator about the file name. The file name will be internally generated from the recording IDs and the time/date information. This option is especially useful for opening exported files in the signal analysis software, providing a single-click integration between the recording software and the signal analysis software. Table 19: Signal Export Functions Importing Existing Recordings Wideband recordings created with other systems can be imported in the application to use its recording management and analysis functions. The recording files to be imported must be provided as .wav files containing complex IQ signals. During import, the files are converted into a special format and copied to the storage server. Parallel to the import operation, the server calculates the spectrum information for the newly imported recording to enable fast browsing in the GUI. Once the spectrum calculation is completed, the recordings can be used as if they were recorded by the application. To start the import process, use the menu item File - Import recording… If you are currently monitoring a live wideband signal in the Real-Time Monitoring & Recording part of the GUI, the application will not be able to generate any spectrum information for imported recordings until the monitor has been stopped (for performance reasons). In that case, a warning is displayed before proceeding with the import process. The File Import dialogue window serves to select the signal files to import as well as various import options: User Manual go2RECORD Recording Management & Analysis 33 Figure 42 File Import Dialog Window Item Function Channel count This spin box defines the number of channels to be imported. Only signal files containing multiple channels with consecutive frequency ranges can be imported as a single recording. User defined signal time Check box and Date/Time edit field serve to define a specific signal time for the beginning of the signal. If this option is not used (check-box not selected), the application will try to extract the time from the signal file itself (usually a file creation date/time), see chapter Editing the Signal Li. Channel bandwidth This field can be optionally used to define the effective bandwidth of the imported signal. If not used (value of 0), the application will set the recording bandwidth to the total available bandwidth, i.e. a sampling rate of the complex signal. This option should be used to reduce the bandwidth to the known effective bandwidth of the signal. First channel frequency This field can optionally be used to define a center frequency of the first imported channel. If not defined, the application will try to read this frequency from the signal file. Files to import This field is used to define signal files to be imported for each channel (Add files… button). Multiple files can be added for each channel – those will always be sorted alphabetically and imported in that order. Clear button serves to clear all added files. <Start Import> After setting all parameters and defining signal files, the Import process is started by pressing the <Start Import> button. A progress bar displays the progress of the import process. <Stop Import> The Import can be stopped anytime by pressing the <Stop Import> button. 34 Recording Management & Analysis User Manual go2RECORD Table 20: File Import Parameters All information about the import status, recording Ids, etc. are displayed in the lower part of the dialogue window. Imported recordings are available in the recording browser just as any native recordings. If there is no spectrum information available (recording status message “Spectrum not available” message), please stop any monitoring processes possibly running for a few minutes to enable the application to calculate the spectrum information. User Manual go2RECORD Recording Management & Analysis 35 Glossary of Terms AF Audio Frequency 40 … 20000 Hz Audio Frequency is the range of acoustic waves which the human can perceive, in contrast to ultrasonic waves, which humans cannot hear. ALE Automatic Link Establishment, commonly known as ALE, is the worldwide de facto standard for digitally initiating and sustaining HF radio communications. ALE is a feature in an HF communications radio transceiver system that enables the radio station to make contact, or initiate a link between itself and another HF radio station or network of stations. The purpose is to provide a reliable rapid method of calling and connecting during constantly changing HF ionospheric propagation, reception interference, and shared spectrum use of busy or congested HF channels. ARQ The Automatic Repeat reQuest protocol ARQ is a method to increase the reliability of data-transfer. The data to transfer is split into smaller packets, each packet is extended by a packet-number and a checksum. On the receiving side a checksum is generated on the received data-part of the packet and compared to the checksum that was sent. If they do not concur, the receiving station sends a message to the originator of the message, reporting which packet failed. This message prompts the originator to send the indicated packet another time. ASCII The American Standard Code for Information Interchange commonly known as ASCII is a characterencoding scheme originally based on the English alphabet. ASCII codes represent text in computers, communications equipment, and other devices that use text. ASCII evolved from telegraphic codes. Its first commercial use was as a seven-bit code for teleprinting promoted by Bell data services. ASCII includes definitions for 128 characters: 33 are non-printing control characters (many now obsolete) for formatting and 95 printable characters, both upper and lower case. Signals consist of 1 start bit, 7 or 8 data bits, 1 or 2 stop bit and optionally a parity bit, thus each character consists of a total of 9, 10 or 11 bits. BCH In coding theory the BCH codes form a class of parameterized error-correcting codes. BCH codes were invented in 1959 by Hocquenghem, and independently in 1960 by Bose and Ray-Chaudhuri. The acronym BCH comprises the initials of these inventors' names. User Manual go2RECORD Glossary of Terms 37 Reed–Solomon codes, which are BCH codes, are used in applications such as satellite communications, compact disc players, DVDs, disk drives, and two-dimensional bar codes. In technical terms a BCH code is a multilevel cyclic variable-length digital error-correcting code used to correct multiple random error patterns. BCH codes may also be used with multilevel phase-shift keying whenever the number of levels is a prime number or a power of a prime number. A BCH code in 11 levels has been used to represent the 10 decimal digits plus a sign digit. Context menu A context menu (also called contextual, shortcut, popup or pop-up menu) is a menu in a graphical user interface (GUI) that appears upon user interaction, such as a right-click mouse operation. A context menu offers a limited set of choices that are available in the current state, or context, of the operating system or application. Usually the available choices are actions related to the selected object. dB Decibel (Symbol: dB) is a logarithmic unit that indicates ratio or gain. Decibel is used to indicate the level of acoustic or electromagnetic waves or electronic signals. The logarithmic scale can characterize very big or very small numbers with short notation. The dB level can be viewed as relative gain or attenuation of one level vs. a second, or absolute logarithmic scale level for well known reference levels. Decibel is a dimensionless unit. The ratio in Bel is the base 10 logarithm of the ratio of P1 to P0: Ratio (dB) = 10*log10(P1 / P0) DDC In digital signal processing, a Digital Down-Converter converts a digitized real signal centered at an intermediate frequency to a baseband complex signal centered at zero frequency. In addition to downconversion, DDC’s typically decimate signals to a lower sampling rate. DDL The Decoder Description Language is a programming language developed by Procitec for the easy implementation of modems. A compiler converts the source-code into binary intermediate code, which is interpreted by the application. DHCP The Dynamic Host Configuration Protocol (DHCP) is a network protocol used to configure devices that are connected to a network (known as hosts) so they can communicate on that network using the Internet Protocol (IP). It involves clients and a server operating in a client-server model. FEC The Forward Error-Correcting code is a method to increase the reliability of data-exchange. Additional data is appended to the original data which can be used to correct data if they are partly corrupted. This technique is applied in cases where there is no channel for back-reporting, e.g. in a broadcast situation. It is used as well in situations where the switch-over and retransmission time by far exceeds the time to generate, transfer and evaluate the correction code (deep space communication). FFT The Fast Fourier Transformation is a variant of the Fourier transformation. This is a method to convert data between time- and frequency-domain. Data are sampled in the time-domain, in many applications they are transformed into the frequency-domain for further processing. 38 Glossary of Terms User Manual go2RECORD The DFT is the discrete variant of the Fourier transformation. It works with every integer number N of 2 m samples and requires N operations. The FFT is a special variant, where N is 2 , m being an integer. In this case only N*logN operations are required, accelerating processing significantly for larger N. HF High Frequency 3 … 30 MHz This is the frequency range for world-wide information-transfer over radio with low bandwidth. Propagation in this range is marked by reflections of the waves in the ionosphere, a layer which encloses planet earth at a high of about 60 to 600 kilometers. This way almost every 2 points on earth can exchange information sometimes within 24 hours, either by ground wave or via reflected waves. The ionization depends heavily on the solar radiation, so the available propagation-paths are a function of the time of the day. I/Q I/Q data are signals represented in the complex plane by their Inphase and Quadrature parts. While the sole amplitude information of a signal is ambiguous regarding the phase, the combination of I and Q data 2 2 identifies the phase positively. The magnitude of an I/Q signal is the square-root of (I + Q ) , the phase is arcsin(I) plus the quadrant information derived from Q. LF Low Frequency 30 … 500 kHz This is the frequency range for medium-range information-transfer over radio with low bandwidth. Propagation in this case is restricted to ground-waves, so the coverage is limited to a few 100 kilometers. Modem Modem is an abbreviation for modulator / demodulator. It characterizes a device which is used to transfer information over radio, telephone- or fiberglass-line. The information which is to be sent is adapted to the channel so that it can be retrieived as reliable as possible, given the characteristics of the channel. RCM Receiver Control Modul (receiver.exe) SLEW Link11 is a NATO standard exchange of for tactical data over radio. Single Tone Link Eleven Waveform is a variant with extended data protection by interleaving and convolutional block coding. SNR Signal-to-noise ratio (often abbreviated SNR or S/N) is a measure used in science and engineering that compares the level of a desired signal to the level of background noise. It is defined as the ratio of signal power to the noise power. A ratio higher than 1:1 indicates more signal than noise. Normally the values are indicated in dB. UHF Ultra High Frequency 0.3 … 3 GHz This is the frequency band for information-transfer with high bandwidth. Due to the quasi-optical wave propagation the range is limited to about 10 kilometers for omnidirectional antenna systems, and to lineof-sight links in case of directional antennas. User Manual go2RECORD Glossary of Terms 39 VHF Very High Frequency 30 … 300 MHz This is the frequency range for information-transfer with medium bandwidth. Due to the more or less quasi-optical wave propagation the range is limited to some 10 kilometers for omnidirectional antenna systems, and to close to line-of-sight links in case of directional antennas. XSLT XSLT (Extensible Stylesheet Language Transformations) is a language for transforming XML documents into other XML documents, or other objects such as HTML for web pages etc., The original document is not changed; rather, a new document is created based on the content of an existing one. 40 Glossary of Terms User Manual go2RECORD User Manual go2RECORD Glossary of Terms 41 List of Figures Figure 1 Configuration Example ....................................................................................................................2 Figure 2 GUI Main Tabs .................................................................................................................................2 Figure 3 Graphical User Interface ..................................................................................................................4 Figure 4 Receiver Selection ...........................................................................................................................4 Figure 5 Receiver Frequency Settings ...........................................................................................................5 Figure 6 Channel Selection ............................................................................................................................5 Figure 7 Recording Control ............................................................................................................................5 Figure 8 Recording Selection .........................................................................................................................6 Figure 9 Signal Selection ...............................................................................................................................6 Figure 10 Signal List ......................................................................................................................................6 Figure 11 Signal Export Settings ...................................................................................................................7 Figure 12 Real-Time Channel Creation Settings ...........................................................................................7 Figure 13 Real-Time Channel Addition Settings ............................................................................................7 Figure 14 Audio Demodulator Control Settings .............................................................................................7 Figure 15 Audio Squelch Level Settings ........................................................................................................8 Figure 16 Spectrogram Display .....................................................................................................................9 Figure 17 Spectrogram Display Context Menu ........................................................................................... 11 Figure 18 Parameters Tab .......................................................................................................................... 12 Figure 19 Cursor Tab .................................................................................................................................. 13 Figure 20 Extras Tab ................................................................................................................................... 14 Figure 21 Real-Time Monitoring & Recording Tab ..................................................................................... 15 Figure 22 Receivers and Channels Tree View ........................................................................................... 16 Figure 23 Receiver Settings ........................................................................................................................ 16 Figure 24 Frequency Stepping Settings ...................................................................................................... 17 Figure 25 Panorama Settings ..................................................................................................................... 17 Figure 26 Receivers and Channels Tree View ........................................................................................... 18 Figure 27 Recording Control and Status Pane ........................................................................................... 18 Figure 28 Recording Scheduler .................................................................................................................. 20 Figure 29 Real-Time Channels Tab ............................................................................................................ 21 Figure 30 Real-Time Channel in Spectrogram View .................................................................................. 22 Figure 31 Audio Demodulation Context Menu ............................................................................................ 23 Figure 32 Real-Time Channel with Audio Demodulation Highlighted ......................................................... 23 Figure 33 Audio Squelch Level Control ...................................................................................................... 23 Figure 34 Signal Source Settings ............................................................................................................... 24 Figure 35 Recording Management & Analysis Tab .................................................................................... 25 Figure 36 List of Recordings ....................................................................................................................... 26 Figure 37 Magnifier and Overview Windows .............................................................................................. 27 Figure 38 Signals Tab ................................................................................................................................. 28 Figure 39 Signal List Details ....................................................................................................................... 30 Figure 40 Play Button Context Menu .......................................................................................................... 32 Figure 41 Export Button Context Menu ....................................................................................................... 33 Figure 42 File Import Dialog Window .......................................................................................................... 34 User Manual go2RECORD List of Figures 43 List of Tables Table 1: Spectrogram Scrollbar Shortcuts .................................................................................................. 10 Table 2: Spectrogram Zoom Functions ....................................................................................................... 10 Table 3: Spectrogram Display Functions .................................................................................................... 11 Table 4: Spectrogram Display Keyboard Shortcuts .................................................................................... 12 Table 5: Spectrogram Display Parameters ................................................................................................. 13 Table 6: Color Schemes.............................................................................................................................. 14 Table 7: Spectrum Display .......................................................................................................................... 14 Table 8: Frequency Stepping Parameters .................................................................................................. 17 Table 9: Recording Parameters .................................................................................................................. 19 Table 10: Recorder Scheduler Controls ...................................................................................................... 20 Table 11: Recorder Scheduler Settings ...................................................................................................... 21 Table 12: Real-Time Channel Creation Options ......................................................................................... 22 Table 13: Real-Time Channel Reassignments ........................................................................................... 23 Table 14: Recording State Color Code ....................................................................................................... 26 Table 15: New Signal Creation Functions ................................................................................................... 29 Table 16: Signal List Filtering Parameters .................................................................................................. 30 Table 17: Record Signal Group Management ............................................................................................ 31 Table 18: Signal Playing Functions ............................................................................................................. 32 Table 19: Signal Export Functions .............................................................................................................. 33 Table 20: File Import Parameters ............................................................................................................... 35 44 List of Tables User Manual go2RECORD Index A Advanced Receiver Control Functions (Option) 17 AF 37 ALE 37 ARQ 37 ASCII 37 Audio Demodulation and Playback of Real-Time Channels 23 Extracting Signals from Recording 31 Extras 14 F Features 2 FEC 38 FFT 38 Filtering the Signal List 30 G B BCH 37 Browsing and Managing Recordings 25 Graphical User Interface 3 GUI Concepts 2 H C Choosing Receiver Channels for Recording 18 Configuration 1 Context Menu 10, 38 Creating and Using Real-Time Narrowband Channels 21 Creating New Signals 28 Creating, Moving and Deleting Real-Time Channels 22 Cursors 13 HF 39 I I/Q 39 Importing Existing Recordings 33 Introduction 1 K Keyboard Shortcuts 11 D L dB 38 DDC 38 DDL 38 Deleting Recordings 26 DHCP 38 Displaying and Analyzing Single Recordings 26 Displaying and Analyzing the Spectrum 9 LF 39 E Editing the Signal List 29 Exporting Signals to File 32 User Manual go2RECORD M Managing Signal Groups 30 Modem 39 O Opening Recordings 26 Operation 4 Index 45 P Parameter Setting 12 Playing Signal(s) 31 Q Quick Start 3 R RCM 39 Real-Time Monitoring & Recording 15 Receiver Configuration 3 Recording Management & Analysis 25 Recording Scheduler 19 Recording Wideband Signals 17 Revisions 1 Setting the Receiver Frequency and Bandwidth 16 SLEW 39 SNR 39 Starting and Stopping the Recording 18 Streaming Real-Time Channels 23 U UHF 39 Using Magnifier and Overview 26 V VHF 40 X XSLT 40 S Scrollbars 10 Selecting and Controlling the Wideband Receiver(s) 15 Selecting and Organizing Signals of Interest 27 46 Index Z Zoom Functions 10 User Manual go2RECORD