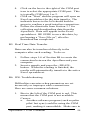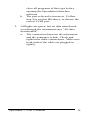
1
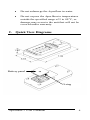
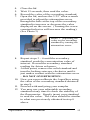
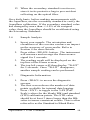
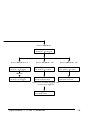
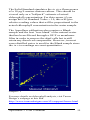
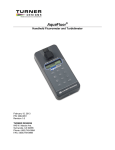
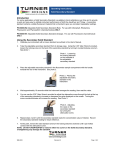
Aquafluor™
Handheld Fluorometer and Turbidimeter
User’s Manual
Dated: September 2004
Version: 1.3
P/N 998-0851
Table of Contents
1.
Introduction
1.1 Description ........................................................ 4
1.2 Inspection and Setup ....................................... 4
1.3 General Information, Precautions & Cleaning
............................................................................. 5
2.
Quick View Diagrams ........................................... 6
3.
Instrument Operation and Calibration
3.1 Instrument Power Up ....................................... 8
3.2 Detection Channel Configuration.................. 8
3.3 Calibration Overview....................................... 9
3.4 Calibration Procedure .................................... 10
3.5 Instructions for using the Adjustable ......... 12
Secondary Standard
3.6 Sample Analysis ............................................. 14
3.7 Diagnostic Information ................................ 14
3.8 Internal Data Logging (IDL) ........................ 15
3.8.1
Activate Data Logging .................. 15
3.8.2
Download Data............................... 15
3.8.3
Erase Data........................................ 16
3.9 Display Screen Flowchart ............................. 17
4.
Sample Analysis Guidelines
4.1 Handling Samples .......................................... 19
4.2 Positioning Samples....................................... 20
4.3 Linear Range and Quenching....................... 19
4.4 Temperature Considerations ........................ 21
4.5 Data Quality .................................................... 22
5.
Warranty
5.1 Terms ................................................................ 22
5.2 Warranty Service............................................ 23
5.3 Out of Warranty Service ............................... 24
Aquafluor™ User’s Manual
2
Appendices:
A. Instrument Specifications
A1. General Specifications.................................. 25
A2 – A4. Optical Configurations ....................... 25
A5. Cuvette Information...................................... 27
B. Internal Data Logging
B1. Shipping Checklist........................................ 28
B2. Hardware Requirements ............................... 28
B3. Installation....................................................... 28
B4. Connecting...................................................... 28
B5. Real Time Data Transfer.............................. 29
B6. IDL Troubleshooting .................................... 29
C. Applications
C1. In Vivo Chlorophyll......................................... 31
C2. Extracted Chlorophyll .................................... 33
C3. Ammonium Detection.................................... 33
C4. Turbidity........................................................... 35
C5. Fluorescent Tracer Dyes................................ 35
C6. Cyanobacteria Monitoring………………..36
Aquafluor™ User’s Manual
3
1. Introduction
1.1 Description
The Aquafluor™ is a lightweight, handheld
fluorometer/turbidimeter. Its dual channel
capability allows the user to measure either
fluorescence or turbidity in one sample.
The Aquafluor can be configured for any two
channels as follows: in vivo chlorophyll a;
cyanobacteria (phycocyanin or phycoerythrin);
turbidity, Rhodamine WT; fluorescein;
ammonium and extracted chlorophyll a.
1.2 Inspection and Setup
1.2.1 Inspection
Upon receiving your instrument, please inspect
everything carefully and make sure all accessories
are present. All shipments include:
•
•
•
•
•
The Aquafluor™
The User’s Manual
4 AAA batteries
Cuvettes – Qty 4, See Appendix A5
Storage Pouch
1.2.2 Setup
Before the Aquafluor can be used, the supplied
batteries must be installed.
1.
On the backside of the instrument, remove the
battery panel by loosening the center screw
and then gently pull on the screw. There is
some resistance due to the o-ring, used for
watertight sealing (see Section 2 for diagram).
Aquafluor™ User’s Manual
4
2.
Install the 4 AAA batteries and verify the
batteries are positioned correctly.
3. Replace the battery panel and press it down
into position.
4. Hold the battery panel down in place and
gently tighten the screw until it is snug.
Do not over tighten the screw.
Note: If the battery panel is very difficult to press
down or remove, you can apply a small amount of
silicon based o-ring grease to lubricate the o-ring
as needed.
1.3 General Information, Precautions and Cleaning
•
•
•
•
•
•
The sample compartment cannot accept
10mm square glass or quartz cuvettes because
their cuvette wall thickness exceeds the 12
mm maximum outer dimension that the
Aquafluor can accept. The 10 mm size is the
internal dimension of the cuvette and some
plastic cuvettes may also be too large.
Do not force oversized cuvettes into the
sample compartment. This can damage the
sample compartment. If the cuvette does not
easily fit down inside the Aquafluor you will
need to purchase different cuvettes.
Round glass test tubes can be used with an
optional adapter that is available. Refer to
Appendix A5 for cuvette information.
Use caution around solvents because they
may attack the plastic case of the Aquafluor.
If a sample is accidentally spilled inside the
Sample Compartment, you can invert the
Aquafluor to drain out the excess liquid. Then
wipe the inside area dry with a clean soft
towel or tissue.
If extra cleaning is needed, use a mild
detergent to dampen the towel for cleaning.
Aquafluor™ User’s Manual
5
2.
•
Do not submerge the Aquafluor in water.
•
Do not expose the Aquafluor to temperatures
outside the specified range of 5 to 40 o C, or
damage may occur to the unit that will not be
covered under warranty.
Quick View Diagrams
Battery panel
O-ring
Aquafluor™ User’s Manual
6
Aquafluor™ User’s Manual
7
3. Instrument Operation and Calibration
3.1 Instrument Power Up
To turn on the Aquafluor, press the <ON/OFF>
button. After a 5 second warm up, the Aquafluor is
ready for operation.
Pressing the <ON/OFF> button again will turn the
unit off or if left idle for 3 minutes the unit will
turn itself off to save battery power.
A set of new batteries will last for over 1,000
sample readings. If the batteries have low power
or are not positioned properly, the following
warning message will be displayed –
“Batt Level < 20% !! Caution !!”
The contrast of the display can change with
temperature and will get lighter as the unit gets
colder. The contrast can be easily adjusted. Press
the ↑ arrow button to darken the contrast and press
the ↓ arrow to lighten the display contrast.
3.2 Detection Channel Configuration
The Aquafluor has 2 detection channels that are
configured as two fluorescent channels or one
fluorescent and one turbidity channel.
You should identify the configuration by looking
at the label on the back side of the Aquafluor.
Refer to the table in Appendix A4 to confirm the
correct configuration for your application.
The appropriate channel is selected by pressing
the <A/B> button to toggle between the 2
channels. The display will show a label in the
lower left corner of the Home screen to identify
which channel is activated.
Aquafluor™ User’s Manual
8
3.3 Calibration Overview
The Aquafluor can be calibrated using Primary or
Secondary standards. A Primary Standard is one
that contains the same fluorescent material that
you are measuring in your unknown samples. The
Aquafluor will give an actual quantitative
concentration reading when a primary standard of
known concentration is used for calibration.
The standard and samples must be in the linear
detection range to get accurate quantitative results.
Refer to Section 4.3 for more details about the
linear range and quenching of the samples.
For some applications, Secondary Standards are
used for calibration. A secondary standard is one
that contains a different type of fluorescent
material than your samples. The in vivo
Chlorophyll application is an example where a
Secondary Standard is often used for the
calibration, and we recommend using the Solid
Secondary Standard (PN 8000-950).
Refer to Appendix C for details on Chlorophyll
applications and calibration. This appendix also
has details about the Ammonium and Turbidity
applications.
When a Secondary Standard is used for
calibration, the Aquafluor will give relative
sample readings that are proportional to the
measured fluorescence. In some cases these
relative sample readings will be correlated back to
actual concentrations that are determined later. For
example, this is commonly done for in vivo
Chlorophyll monitoring applications as described
in Appendix C1.
Aquafluor™ User’s Manual
9
For Dye tracing applications the calibration is
normally performed with a primary standard made
from the same dye that is being used for the
testing. The primary standard will either be made
to a known concentration, typically in ppb or ug/L
units, or to a known dilution factor. Ideally the
Primary Standard and Blank samples used for
calibrating will be made with the same water the
tests are being performed in. For more details on
this and tracer dye use, please refer to the
Application Note, “A Practical Guide to Flow
Measurement” at the following web link:
http://www.turnerdesigns.com/t2/doc/appnotes
3.4 Calibration procedure
It is recommended for best accuracy, that you
always calibrate before performing your sample
analysis. The Aquafluor will save the calibration
settings for each channel until a new calibration is
performed.
If the temperature of your samples or the
Aquafluor changes significantly, the readings may
show a small shift and in this case, you should
consider recalibrating. The solid secondary
standard is useful for checking the reading
stability over time and can also be used to
recalibrate if needed.
The Aquafluor is designed with “ambient light
rejection”. The black sample compartment cover
does NOT need to be closed when calibrating or
reading samples. This allows for the use of
cuvettes with different height dimensions, such as
the 12x75 mm round glass tubes.
The orientation and cleanliness of the cuvettes can
have an impact on the accuracy of your results.
Aquafluor™ User’s Manual
10
Refer to Section 4, Sample Analysis Guidelines
for information to help insure the best results for
your analysis.
3.4.1
Assign a Calibration Standard Value.
This defines the numeric value that you want the
standard to read. For example, if you calibrate
with a primary standard that has a concentration of
50 ug/L, then you will set the value to 50 and the
implied unit of measure will be in ug/L. If you use
a Secondary standard to calibrate with, you will
set this value to a desired relative value and call
the units RFU (Relative Fluorescent Units).
1.
2.
3.
3.4.2
1.
2.
3.
4.
5.
Press the <STD VAL> button.
Use the ↑ and ↓ arrow buttons to set the
standard value. Holding down either arrow
button down will allow you to change the
value using fast scrolling.
When finished, Press the <ENT> or <ESC>
button to accept the value and to return to the
Home screen.
Perform the Calibration.
Press the <CAL> button.
Press <ENT> to start the calibration.
Insert your blank sample and press <ENT>.
The Aquafluor will average the reading for 10
seconds and set the blanking zero point.
Insert the standard sample and press <ENT>.
The reading is averaged for 10 seconds and
the Standard Calibration value is set.
Press <ENT> when the calibration is
complete to accept the calibration. If <ENT>
is not pressed within 10 seconds, you will be
asked if you want to abort the calibration.
Aquafluor™ User’s Manual
11
Press the ↑ or ↓ arrow button to abort or
accept the calibration respectively.
If at anytime during steps 1-4 you want to stop the
calibration, press <ESC>. This will return you to
the Home screen and will default the instrument to
the previous calibration.
3.5 Instructions for using the Adjustable Secondary
Standard.
1.
2.
Calibrate the Aquafluor with a solution of
known concentration.
Take the adjustable secondary standard from
its storage bag. Using the 0.05 allen wrench
provided, loosen the locking screw on the
back of the secondary standard by turning it
counterclockwise one turn. (See photo 1)
Photo 1. Loosening
the locking setscrew on
the backside of the
adjustable secondary
standard
3.
Place the adjustable secondary standard in the
fluorometer sample compartment with the
handle towards the rear of the instrument.
(See photo 2).
Photo 2. Placing the
adjustable secondary
standard in the
Aquafluor
Aquafluor™ User’s Manual
12
4.
5.
6.
7.
Close the lid
Wait 15 seconds, then read the value.
Record the value of the secondary standard.
Open the lid, and use the 3/32” allen wrench
provided to adjust the attenuation screw
through the hole at the top of the secondary
standard to increase or decrease the value
displayed on the screen. (Turning the screw
counterclockwise will increase the reading).
(See Photo 3)
Photo 3. Adjusting the
value on the secondary
standard by turning the
attenuation screw.
8.
Repeat steps 3 – 6 until the secondary
standard reads the concentration value of
interest. Record the secondary standard
reading for future reference.
9. At this point, remove the solid standard and
turn the locking setscrew clockwise until it
just makes contact with the attenuation screw
- DO NOT OVERTIGHTEN.
10. Now you can recalibrate the Aquafluor using
the value of the secondary standard obtained
in step 8.
11. Proceed with analyzing your samples
12. You may use your adjustable secondary
standard at any time to check the stability of
the fluorometer. Simply insert your standard
to read the value. The value should be similar
to what was previously obtained in step 8
above.
Aquafluor™ User’s Manual
13
13. When the secondary standard is not in use,
store it in its protective bag to prevent dust
collecting on the optical fiber.
On a daily basis, before making measurements with
the Aquafluor, use the secondary standard to verify the
Aquafluor calibration. If the secondary standard value
has changed by more than +/-10% of its assigned
value, then the Aquafluor should be recalibrated using
the Secondary Standard.
3.6
Sample Analysis
1.
2.
3.
4.
3.7
Insert your sample. The orientation and
cleanliness of the cuvettes can have an impact
on the accuracy of your results. Refer to
Section 4 for more details.
Press either <READ> button. The instrument
will measure and average the fluorescence
signal for 5 seconds.
The reading result will be displayed on the
top line of the Home screen.
The top left corner will then display “WAIT”
for 5 seconds. Once “WAIT” disappears,
another sample reading can be performed.
Diagnostic Information
1.
2.
3.
Press <DIAG> to access the diagnostic
screens.
The first screen shows the number of data
points available for internal data logging.
Press <ENT> to toggle to the %FS (Full
Scale) values for the blank (Blk) and standard
(STD) calibration points. The STD value
should be at least 3 times larger than the Blk
value to insure consistent results. This is often
referred to as the Standard to Blank Ratio.
Aquafluor™ User’s Manual
14
4.
3.8
Press <ESC> when finished to return to the
Home screen.
Internal Data Logging (IDL)
The Internal Data Logging option allows the
downloading of stored data from the Aquafluor.
For further information, see Appendix B.
The Aquafluor can log up to 1000 data points.
The DATA screens control logging, downloading
and erasing the data as described below.
3.8.1 Activate Data Logging
1.
2.
3.
Press the <DATA> button 2 times.
Press <ENT> to toggle between logging
and stop status.
Press <ESC> when finished to return to
the Home screen.
3.8.2 Download Data
1.
2.
3.
4.
5.
Connect the Aquafluor™ to the serial
port of your computer.
Open the Turner Designs Interface
Software. See Appendix B for computer
requirements and installation.
Press the <DATA> button 3 times.
Press <ENT> 5 times to start the data
download.
Press <ESC> when finished to return to
the Home screen.
Aquafluor™ User’s Manual
15
3.8.3 Erase Data
1.
2.
3.
Press the <DATA> button 4 times.
Press <ENT> 5 times to erase all logged
data.
Press <ESC> when finished to return to
the Home screen.
Aquafluor™ User’s Manual
16
3.8 Display Screen Flowchart
Turner Designs
TD HH1B 0500 5
5 second warm up
Indicates which channel
is active
XXX.X
Fluorescence reading
Indicates activity of
IDL
A
Home Screen
Press <A/B> to toggle
between
XXX.X
A
Press <READ>
Press <CAL>
Calib.
A
<ENT> to start
A
READING
Insert Blank
then press <ENT>
WAIT XXX.X
A
Reading Blank
XX.X
A
and
XXX.X
B
XXX.X
Press <STD VAL>
Cal Val: XXX.X
<UP/DOWN> A
Insert Cal Soln
then press <ENT>
Reading Cal Soln
XX.X
Press <DIAG>
then <ENT> to
toggle between
Logging Points
Left: XXX
Calibration
Completed <ENT>
If <ENT> is not pressed
within 5 seconds,
this screen will appear
and
%FS-Blk: X.XX
%FS-STD: XX.XX
Abort Cal?
<UP>Yes <DOWN>No
Aquafluor™ User’s Manual
17
Press <DATA>
Datalogger:
<DATA> to toggle
Press <DATA> 1X
Status: Stop
<ENT> to toggle
Press <DATA> 2X
Press <DATA> 3X
Download data:
5X<ENT> to start
Erase Data
5X<ENT> to start
Download data:
All downloaded
Erase Data
All data erased
<ENT>
Status: Logging
<ENT> to toggle
If there is no data logged, this
screen will appear
Data logger has
no valid data!
Aquafluor™ User’s Manual
18
4. Sample Analysis Guidelines
4.1 Handling Samples
1.
Take care not to spill samples into the sample
chamber. Wipe up any spills promptly.
2.
The cuvette MUST BE DRY on the outside
when taking readings. Any Moisture or
condensation on the outside of the cuvette can
effect the reading.
3.
Fill the cuvette with at least 2mL solution
volume or at least 50% full. Significant error
in the readings can result if the cuvette
contains less than this minimum volume.
4.
The Aquafluor is very sensitive and even
small amounts of material from a previous
sample may contaminate the sample and
result in errors. Use a clean cuvette for all
readings. If you are using the same cuvette for
your samples it is very important that you
thoroughly clean the cuvette between
samples. A good way to confirm the cuvette
cleanliness is to read a blank solution. If the
reading is higher than the normal blank
reading, the cuvette is not clean.
5.
Any bubbles in the sample will effect the
readings. Take care not to introduce bubbles
into samples. Remove any bubbles by lightly
tapping with your finger on the outside
cuvette wall or cover the top of the cuvette
and tilt the sample to help dissipate bubbles.
Aquafluor™ User’s Manual
19
4.2 Positioning Samples
The orientation of the cuvette in the sample
compartment can give slightly different readings
especially for low concentration samples. This is
due to variations in the walls of the cuvette that
are not readily visible to the eye. We recommend
that the cuvette be marked at the top on one side
and positioned in the sample compartment the
same way each time for best results.
Turbidity sample measurements are particularly
sensitive to the quality and cleanliness of the
cuvette. Small scratches or smudges on the cuvette
will effect the accuracy of the readings. The
Polystyrene cuvettes (P/N 7000-957) give the best
Turbidity measurement results, due to better
quality of the cuvette.
4.3 Linear Range and Quenching
The linear range is the concentration range in
which the readout of the Aquafluor is directly
proportional to the concentration of the
fluorophore in the sample. The linear range begins
with the lowest detectable concentration and spans
to an upper limit concentration that is dependent
on the properties of the fluorescent material and
the cuvette optical path length. For Rhodamine,
Fluorescein dye or Chlorophyll in the 10 mm
square cuvette, the upper limit of linearity is
approximately 300 ppb (ug/L).
At concentrations above this upper limit, the
fluorescence reading will not increase at a linear
rate in comparison to the change in concentration.
At concentrations 10 times higher than the upper
limit , the readings will start to decrease even
though the sample concentration is increasing.
Aquafluor™ User’s Manual
20
This effect is known as "sample quenching" and is
due to light absorption losses in the sample. See
the Figure 1 graph below.
When you start to see visual color in the sample,
this is an indicator that the sample may be above
the upper limit of linearity. The linearity can be
verified by diluting a sample 1:1 or another
convenient dilution ratio. If the sample is within
the linear range, the reading will decrease in direct
proportion to the dilution. If the reading does not
decrease in direct proportion to the dilution or if
the reading increases, the original sample
concentration was above the linear range.
Figure 1. Linearity and Calibration Response Curve
Aquafluor™ User’s Manual
21
4.4 Temperature Considerations
Fluorescence is temperature sensitive. As the
temperature of the sample increases, the
fluorescence decreases. For best accuracy make
sure your samples are at the same temperature as
the calibration standard. Some temperature
coefficients examples are: Rhodamine dye is
approx. 2.6% per degree C and Fluorescein dye is
0.36% per degree C.
4.5 Data Quality
The Aquafluor is only as accurate as the standards
that are used to calibrate it. This is why it is
important to take care when preparing standards,
samples, and blank. One should follow good
laboratory practices when preparing all solutions
and samples.
5
Warranty
5.1 Terms
Turner Designs warrants the Aquafluor
Fluorometer and accessories to be free from
defects in materials and workmanship under
normal use and service for a period of one year
from the time of initial purchase, with the
following restrictions:
The instrument and accessories must be installed,
powered, and operated in compliance with the
directions in this Aquafluor User’s Manual and
directions accompanying the accessories.
Aquafluor™ User’s Manual
22
Damage resulting from measurement of samples
found to be incompatible with the materials used
in the sample system or resulting from contact
with corrosive materials or atmosphere is not
covered.
Damage caused by modification of the instrument
by the customer is not covered.
Damage incurred in shipping is not covered.
5.2 Warranty Service
To obtain service during the warranty period, the
owner shall take the following steps:
1.
Write or call the Turner Designs Technical
Support and describe as precisely as possible
the symptoms or nature of the problem.
Phone: (408) 749-0994
Email: [email protected]
2. Carry out any adjustments or tests as suggested
by Technical Support.
3. If proper performance is not obtained, a Return
Authorization number (RMA) will be issued to
you. Ship the instrument, prepaid, to Turner
Designs, with the RMA number referenced and
include your complete shipping address and
phone number inside.
The instrument will be repaired at no charge, but
for customers outside of the United States, any
shipment or documentation charges will be billed
at cost.
Aquafluor™ User’s Manual
23
NOTE: The instrument or accessories should not
be returned without first contacting Turner
Designs. Prior correspondence is needed to
understand the nature of the problem and to help
decide on the best action to resolve the issue as
quickly as possible.
5.3 Out-of-Warranty Service
Proceed exactly as for Warranty Service, above. If
our Technical Support can assist you by phone or
correspondence, we will be glad to, at no charge.
Repair service will be billed on a fixed price basis.
Shipment to Turner Designs should be prepaid.
Your bill will include return shipment freight
charges.
Address for Shipment:
Turner Designs
845 W. Maude Ave.
Sunnyvale, CA 94085
Aquafluor™ User’s Manual
24
Appendix A: Instrument Specifications
A1. General Specifications
Specification
Size
Weight
Dynamic range
Resolution
LCD Display
Case
Temperature
Detector
Calibration Type
Error message
Cuvette Type
Warm Up Time
Auto Power Off
Description
1.75” x 3.5” x 7.25”
(4.45cm x 8.9cm x 18.4cm)
13.9oz (0.4kg)
3 orders of magnitude
12 bits
2 x 16 characters
Meets IP 67 Standard; dustproof
and waterproof
41-104 oF; 5-40 oC
Photodiode
Single-point and blank
Low battery, High blank
See Appendix A5.
5 seconds
After 3 minutes of inactivity
A2. Optical Configurations for in vivo Chlorophyll,
Rhodamine and Turbidity
Light Source
Excitation
Optics
Emission
Optics
Limit of
Detection
Max range
Temperature
coefficients
in vivo Chlor
Channel
Blue LED
Rhodamine
Channel
Green LED
Turbidity
Channel
Green LED
460±20nm
540±20nm
515±10nm
>665nm
>570nm
515±10nm
0.25ug/l
in vivo Chl
> 300 ppb
0.4ppb
0.5NTU
>300ppb
>150 NTU
o
1.4%/ C
Linear
Aquafluor™ User’s Manual
o
0.026/ C
Exponential
N/A
25
A3. Optical Configurations for Ammonium and
Extracted Chlorophyll
Ammonium
(NH4) UV
Channel
UV LED
Extracted
Chlorophyll
Channel
Blue LED
Excitation Optics
375nm
430nm
Emission Optics
>420nm
>665nm
Limit of Detection
0.1µM
0.5µg/L
Max range
50 µM
300 µg/L
N/A
0.3/oC
Linear
Light Source
Temperature
coefficients
A4. Label Designations for Optical Configurations
Label
INV CHLOR
EXT CHLOR
PC
PE
BLU-515
Green-570
TURB
UV-405
UV-420
UV-445
UV-480
Ex. / Em. nm
460 / >665
430 / >665
590 / 660
525 / 575
475 / 515
540 / >570
515 / 515
375 / 405
375 / >420
375 / 445
375 / 480
Aquafluor™ User’s Manual
Applications
in vivo Chlor
Extracted Chlor
Phycocyanin
Phycoerythrin
Fluorescein
Rhodamine
Turbidity
Ammonium
26
A5. Cuvette information
Cuvette type
Size
Methacrylate
plastic
10 mm Square
(height 44.5
mm)
Polystyrene
Plastic
10 mm Square
(height 47.5
mm)
Borosilicate
glass
12 x 75mm
Round
Usage
Required for UV
(< 400 nm),
works for all
applications, Do
NOT use with
solvents
(ie. Acetone)
Preferred for
Turbidity use,
will NOT work
for UV, Do NOT
use with solvents
(ie. Acetone)
Required for
Extracted Chlor,
where solvents
are used.
Requires Adapter
PN 8000-932
Part No.
7000-959
7000-957
10-029A
A6.Optical Configuration for Cyanobacteria
Light Source
Excitation
Optics
Emission Optics
Limit of
Detection
Max Range
Temperature
Coefficients
Phycocyanin
Yellow LED
595 nm
Phycoerythrin
Green LED
528 nm
670 nm
150 cells/mL
573 nm
150 cells/mL
150,000
cells/mL
Not available
150,000
cells/mL
Not available
Aquafluor™ User’s Manual
27
Appendix B: Internal Data Logging
B1. Shipping Checklist
The Internal Data Logging kit (PN 8000-920)
contains the following items:
• Interface cable
• Turner Designs Spreadsheet Interface
Software on a CD disk.
Both of these items are necessary for downloading
or transferring data from the Aquafluor to a PC.
B2. Hardware Requirements
•
•
•
PC with Windows 95 or later
MS Excel 5.0 or later
At least 1 available serial port
B3. Software Installation
1.
2.
3.
4.
Exit out of any programs that are running.
Insert the CD Disk and select the setup.exe
file.
Follow the steps in the setup wizard to install
the necessary files.
When the setup is complete, an icon named
“Spreadsheet Interface Software” will be
found on the desktop and in the “Programs”
menu list.
B4. Connecting
1.
2.
3.
Using the cable provided, connect the 9 pin
adapter end of the cable into the available
serial port of your computer.
Plug the opposite end of the cable into the
port at the base of the Aquafluor.
Open the Spreadsheet Interface software.
Aquafluor™ User’s Manual
28
4.
5.
6.
Click on the box to the right of the COM port
icon to select the appropriate COM port. This
is typically COM port 1 or 2.
Click on “Start” and the program will open an
Excel spreadsheet for the data transfer. The
indicator boxes to the left should both be
green to confirm a good interface connection.
Follow the directions from Section 3.7 for
collecting and downloading data from the
Aquafluor. Data will appear in the Excel
spreadsheet. BE SURE to save this data, by
performing a “Save File as”, after the
download has completed.
B5. Real Time Data Transfer
Data can also be transferred directly to the
computer after each reading. To do so:
1.
2.
Follow steps 1-6 of Section B4 to create the
connection between the Aquafluor and your
computer.
Insert a sample and press the <READ>
button. When the reading is finished, the
results will automatically transfer to the active
Excel spreadsheet.
B6. IDL Troubleshooting
Difficulties can arise when parameters are set
incorrectly or improper cable connections.
Here are some common solutions.
1.
Box to the left of the COM port is red. This
means that the COM port is not available.
Causes:
a. Another software program (such as palm
pilot/ hot sync) could be using the COM
port, making it unavailable. Make sure to
Aquafluor™ User’s Manual
29
b.
2.
close all programs of this type before
opening the Spreadsheet Interface
software.
The port selected is incorrect. Follow
step 4 in section B4 above, to choose the
correct COM port.
All lights are green, but no data transferred,
even though the instrument says “All data
downloaded”.
a. The connection between the instrument
and the computer is bad. Check and
tighten the cable connections. Make sure
both ends of the cable are plugged in
tightly.
Aquafluor™ User’s Manual
30
Appendix C1: In Vivo Chlorophyll
In vivo chlorophyll analysis is the fluorescent detection
of chlorophyll a in algal cells in water. In this
technique, the excitation light from the fluorometer
passes through the untreated sample of water and
causes the chlorophyll a within the cells to fluoresce.
Environmental conditions, presence of interfering
compounds, cellular physiology, morphology, and
light history can influence the relationship between the
in vivo fluorescence and the actual concentration of
chlorophyll a in the sample. These factors cause in
vivo fluorescence to be a semi-quantitative tool.
Despite its semi-quantitative nature, in vivo
fluorescence data can supply valuable information on
the spatial and temporal distribution of chlorophyll
concentrations quickly and easily.
To obtain quantitative data, the in vivo fluorescence
data must be correlated with extracted chlorophyll a
data that can be obtained through the extraction and
measurement of the pigment from grab samples on a
laboratory fluorometer, spectrophotometer or HPLC.
When collecting “grab” samples for chlorophyll
extraction, the in vivo reading must be noted at the
same time the sample is collected. Several samples
should be collected within each niche or environment.
Once the chlorophyll concentration has been
determined through extraction, the concentration
should be correlated with the corresponding in vivo
value as shown in Graph C1 below.
We recommend using the Solid Secondary Standard to
calibrate the Aquafluor for in vivo chlorophyll use.
Aquafluor™ User’s Manual
31
The Solid Standard simulates the in vivo fluorescence
of a 10 µg/L marine diatom culture. This should be
viewed only as a “ballpark” estimate of actual
chlorophyll concentration. For this reason, if you
assign the Cal Standard Value = 10, this will give
relative reading values that will be proportional to the
actual chlorophyll concentration in the water sample.
The Aqaufluor calibration also requires a Blank
sample and the best “true blank” is the natural water
that has been filtered through a GF/F or membrane
filter in order to remove the algal cells but to still
retain any dissolved components. However, in most
cases distilled water is used for the Blank sample since
the in vivo readings are semi-quantitative.
Graph C1
For more details on chlorophyll analysis, visit Turner
Design’s webpage at this link.
http://www.turnerdesigns.com/t2/esupport/home.html
Aquafluor™ User’s Manual
32
Appendix C2: Extracted Chlorophyll a
In extractive analysis, fluorometric measurements are
made on solvent extracts from algal cells to determine
quantitative concentrations of chlorophyll and
pheophytin. Acetone, methanol, or DMSO can be
used as the extraction solvent. A Primary Chlor a
standard is used for calibration and the measurements
are made using the 12 x 75 mm glass test tubes.
The EPA Method 445 is a popular Chlorophyll
extractive method that was developed using a Turner
Designs Model 10 fluorometer and is published by the
United States Environmental Protection Agency.
The extracted Chlorophyll channel on the Aquafluor
requires performing the acidification step to correct for
the pheophytin. This is referred to as the “corrected
chlor a” method in section 12.2 of the 445 method.
Also, in section 10.1 of the EPA 445 method, the
calculation for the Fs is not required, because it will
always be equal to 1 when using the Aquafluor.
The EPA 445 method is available at the following link.
http://www.epa.gov/nerlcwww/ordmeth.htm
Appendix C3: Ammonium Detection
Accurate determination of ammonium in aquatic
environments is a critical measurement when
investigating Nitrogen cycling and nutrient dynamics.
Historically, methods for ammonium determination
have been a source of frustration within the scientific
community due to the lack of a simple, accurate and
affordable method, particularly for measurements in
the submicromolar range.
Aquafluor™ User’s Manual
33
The new ammonium technique offers researchers and
technicians an excellent alternative to the existing
colormetric ideophenol blue method. Benefits of the
fluorometric method include:
•
•
•
•
Sensitivity: Detection in the submicromolar range.
Accuracy: More accurate than previous methods
for low ammonium concentration samples.
Simple: Requires only one mixed, non-toxic
reagent and no special equipment other than a
fluorometer.
Non-toxic Reagents: OPA, sodium sulfite, and
sodium borate.
The colometric ideophenol blue method is susceptible
to inconsistent results, particularly with submicromolar
ammonium concentrations. Whereas, the new
fluorometric technique has been proven to provide
accurate and precise data over a wide range of water
quality, ammonium concentration and salinity.
This method is particularly useful for work in
oligotrophic systems, where natural ammonium
concentrations are commonly in the submicromolar
range.
The following fluorometric method is available at the
web link below:
Holmes, R.M., A. Aminot, R. Kerouel, B.A. Hooker,
B.J. Peterson. 1999. A simple and precise method for
measuring ammonium in marine and freshwater
ecosystems. Can. J. Fish. Aquat. Sci. 56: 1801-1802
http://www.turnerdesigns.com/t2/doc/appnotes/pdf/ammonium.pdf
Aquafluor™ User’s Manual
34
Appendix C4: Turbidity
The Turbidity channel has a detection range of 0.5 to
150 NTU. A Primary Turbidity Standard is required
for calibration. We recommend using a Turbidity
standard in the range of 10 to 100 NTU. The
Polystyrene cuvettes are preferred for best turbidity
results. Turbidity standards can be purchased from
APS Analytical Stds, a division of GFS Chemicals.
When selecting these AMCO Standards, select the type
for use with “non-ratio” instruments.
For more details refer to the following web link:
http://www.amcoclear.com/amco/index.php
Appendix C5: Fluorescent Tracer Dyes
Fluorescent tracer dyes provide an accurate, cost
effective method for measuring water flow levels,
mixing zones, time of travel, groundwater transport,
leak detection, retention times, etc. The two most
commonly used dyes tracers are Fluorescein and
Rhodamine WT. The Fluorescein dye can be detected
using the Blue channel on the Aquafluor and
Rhodamine dye is detected using the Green channel.
The linear detection range for both dyes is 0.4 to 300
PPB (active ingredient) in potable water.
For more information on tracer dye use, refer to the
Application Note section at the following web link:
http://www.turnerdesigns.com/t2/doc/appnotes/main.ht
ml
Aquafluor™ User’s Manual
35
Appendix C6 : Cyanobacteria Monitoring
The Cyanobacteria channel of the Aquafluor
continually senses the concentration of either
phycocyanin (PC) or phycoerythrin (PE) fluorescent
pigments unique to Cyanobacteria.
Phycobilin pigments are a group of accessory pigments
unique to Cyanobacteria. PC and PE are two
phycobilin pigments that also happen to have strong
and unique fluorescent signals that can be detected by
the Cyanobacteria channel.
The fluorescence is measured directly using in vivo
cyanobacteria detection, without extraction or
chemical treatment. For many types of qualitative
work, in vivo measurements alone may provide
sufficient information. For quantitative measurements,
the in vivo data is calibrated by correlation with other
measurements, such as cell counts or extracted
pigment analysis.
Aquafluor™ User’s Manual
36