1
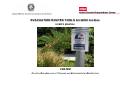
EVACUATION ROUTES TOOLS ArcGIS® toolbox USER’S MANUAL CRATER COASTAL RISK ANALYSIS OF TSUNAMIS AND ENVIRONMENTAL REMEDIATION EVACUATION ROUTES TOOLS ArcGIS® toolbox USER’S MANUAL CRATER COASTAL RISK ANALYSIS OF TSUNAMIS AND ENVIRONMENTAL REMEDIATION Italian Ministry for the Environment and Territory Via Cristoforo Colombo 44 00147 Roma Italy CONTRIBUTING AUTHORS Mario Laghi Alessandra Cavalletti, PhD Eng. Paolo Polo Contact: [email protected] Asian Disaster Preparedness Center P.O. Box 4, Klong Luang, Pathumthani 12120 Thailand CONTENTS 1. Introduction........................................................................................................................ 1 2. Theoretical background ..................................................................................................... 5 3. Getting Started ................................................................................................................ 10 4. Toolset 1: RASTER LAND USE CREATION................................................................... 19 5. TIN creation and Slope extraction ................................................................................... 25 5.1 TIN Creation................................................................................................................. 25 5.2 Slope Extraction........................................................................................................... 33 6. Toolset 2: RECLASSIFICATION ..................................................................................... 39 6.1 RECLASSIFY LAND USE model................................................................................. 40 6.2 RECLASSIFY SLOPE model....................................................................................... 44 7. Toolset 3: EVACUATION SPEED MAP (INVERSE) ........................................................51 8. Toolset 4: EVACUATION TIME MAP & BASINS .............................................................57 9. Toolset 5: BASINS STATISTICS – MAXIMUM VALUE AND AREA ................................67 10. Evacuation routes visualization: Hydrology Modeling interactive properties....................73 10.1 Installation of Hydrologic Modeling extension ...........................................................73 10.2 Interactive properties settings and Evacuation routes visualization..........................79 REFERENCES ...........................................................................................................................85 Appendix .....................................................................................................................................87 1. INTRODUCTION The tsunami event occurred on 26th December 2004 in South Eastern Asia caused more than 200.000 casualties along the coasts of Indonesia, Thailand, Malaysia, India, Sri Lanka and other countries facing the Indian Ocean. Tsunami was initiated by an extremely high magnitude earthquake (9.3 on the Richter scale) localized a few kilometres eastward of Sumatra’s coasts, along the subductive system characterized by the Sunda Arc. Because of the presence of this active tectonic margin a new tsunami event can not be excluded in the future. This is the reason why mitigation measures for tsunami risk must be planned and implemented as soon as possible by the different authorities. Evacuation plans are widely considered as a fundamental instrument for risk mitigation at the local scale; however those are commonly created by choosing main roads as suggested evacuations routes. INTRODUCTION 1 A series of ArcGIS® tools have been built to define the evacuation routes using G.I.S. spatial analysis techniques; the tools are assembled into the EVACUATION ROUTES TOOLS ArcGIS® toolbox that will allow users to apply the method to their own case study. The methodology considers only pedestrian evacuation. This manual will support you step by step in the use of the toolbox, leading you to the choice of best (in terms of time) evacuation routes in the risk areas. Before starting the analysis you should be sure to: 2 Have ArcGIS® 9.0 software correctly installed on your PC. Have Spatial Analyst and 3D Analyst extensions fully functional on your system. Have some elementary knowledge of ArcGIS® 9.0 environment. Have digital data of terrain elevation and land use for the area of interest. EVACUATION ROUTES TOOLS You will find, in the EXAMPLE_BOX folder attached, all the files created for a case study simulation; you can practice performing that analysis again following instructions inside the Example Box and comparing the results. INTRODUCTION 3 4 EVACUATION ROUTES TOOLS 2. THEORETICAL BACKGROUND To define the best evacuation route from a given point we have to find the fastest path from that point to the assembly point. The fastest path is not always the shortest path (which is the direct line between point and the assembly point). In fact this line could intersect natural barriers, buildings, rivers, lakes, sandy areas, or have a very high slope. All these things can reduce dramatically velocity of movement or block it completely. For this reason when we compute a distance between two points we must not consider only the geometric distance but also the cost (in term of time, energy etc.) to move along a particular path. In this way we replace the concept of distance with a concept of Cost Weighted Distance (CWD). If we represent the territory in raster format the CWD to move from a cell to another is calculated as: CWD = cost * cell resolution THEORETICAL BACKGROUND 5 Fig. 1 – Computation of CWD between two adjacent cells The very important step is to define the cost of every cell creating a Cost Surface; this could be done by using Land Use information (and all the elements that can be useful to define the cost) and slope data of territory. Using as cost the inverse of velocity of moving, the CWD between two point will be the time needed to go from one point to the other. Once the cost of all cells is defined it is easy to calculate the CWD between two given points within the domain. For our scope we are interested in the fastest, and consequently less 6 EVACUATION ROUTES TOOLS expensive, path between a point within the domain and an assembly point. To achieve this purpose G.I.S. gives us the opportunity to compute a CWD Surface in respect to a starting point, where the value of each cell is the CWD between cell and the starting point. With CWD Surface it is very easy to find the fastest path between the starting point and any other point in the domain, in particular in respect to the assembly point, to identify the best evacuation route. The method illustrated above have a big limitation: it needs to compute one surface for each starting point we want to consider; to avoid this it is possible to create the CWD Surface in a better way. Instead of defining the CWD Surface as the distance between starting point and each cell in the domain, it is possible to define it as the distance between each cell and the “evacuation points” (safe areas that can be more than one). The value of each cell is the CWD between cell and the closest evacuation point. In this way it will be very easy to compute the escape route from every point within the domain. THEORETICAL BACKGROUND 7 Fig. 2 – CWD Surface computed using 6 evacuation points. 8 EVACUATION ROUTES TOOLS We can also look at the CWD Surface as a topographic surface, recognize mountains and valleys (evacuation shelters are the lowest points of each valley). Following this similarity we are able to use geospatial hydrology tools, widely used in G.I.S., to manage our Surface. For example the fastest path from a point to the closest assembly point is coincident with the course of a rain drop falling on the same point and there are many G.I.S. tools to identify it. Moreover it is possible to define the area influenced by each evacuation point, that is, in our similarity, the subdivision of domain in watershed (in Fig. 2 is reported an example). The subdivision into areas of influence can be very useful: you can identify how many people stay inside each basin, you can understand if the safe area is big enough, and you can calculate the maximum evacuation time of each area and compare it with maximum acceptable time. THEORETICAL BACKGROUND 9 3. GETTING STARTED First of all, please be sure you saved the EVACUATION ROUTES DEFINITION folder you find into the CD-ROM on the hard disk of your Personal Computer. Before starting you need to add the EVACUATION ROUTES TOOLS to your project’s ArcToolbox list. You will do it by following these instructions: Click on icon of ArcToolbox if ArcToolbox is not present. 1) Right - click the ArcToolbox icon. 2) Point Add Toolbox… on the menu. 10 EVACUATION ROUTES TOOLS 2 1 GETTING STARTED 11 3 4 3) Navigate to the EVACUATION ROUTES DEFINITION folder on your computer and select EVACUATION ROUTES TOOLS toolbox. 4) Click Open and the toolbox will be added to your list. 12 EVACUATION ROUTES TOOLS GETTING STARTED 13 Now the toolbox is correctly loaded on your project and you can start using it by double -clicking the icon. Double clicking each of the toolsets will allow you to run the related model and set the parameters for the calculation (Fig. 3). Double-click here Fig. 3 – Menu of EVACUATION ROUTES TOOLS 14 EVACUATION ROUTES TOOLS The EVACUATION ROUTES toolbox created has a user friendly interface; on the right side of each model mask you will find help, suggestions and comments (Fig. 4). By clicking on each element you will obtain description and information. Fig. 4 - EVACUATION ROUTES TOOLS interface example GETTING STARTED 15 Once you have the right instrument be sure that you have created or gathered both a digital representation of terrain elevation and land use. These are the only two fundamental data you need to start the procedure. Land Use should be a polygons shapefile containing one polygon for each land use type (Fig. 5); it should also contain an attribute field describing land use type description. 16 EVACUATION ROUTES TOOLS Fig. 5 - Example of Land Use attribute All the analysis you are going to start are based on Raster Surfaces and Datasets so the first step will be the transformation of your Land Use polygon shapefile into a raster. GETTING STARTED 17 18 EVACUATION ROUTES TOOLS 4. TOOLSET 1: RASTER LAND USE CREATION With this toolset you will transform your Land use shapefile into a Raster Dataset you will use in the next steps of the procedure. Double-click on the RASTER LAND USE CREATION model icon (see Fig. 3), the tool dialog box will be open. TOOLSET 1: RASTER LAND USE CREATION 19 1 2 3 4 5 Once it is opened follow these instructions: 1) Click the dropdown arrow and add the land use shapefile. 2) Select the attribute field containing land use information 3) Choose the cell-size for your raster Dataset (see chapter 2) 4) Set location and name for the Raster Land Use you are creating 5) Click OK 20 EVACUATION ROUTES TOOLS The Raster grid containing land use information will be immediately added to the display. The choice of cell size is a very important step. Choosing a size extremely small the computation in the next steps will be very slow, without any improvement in the results. On the contrary a big cell size is not able to discriminate object smaller than cell resolution, loosing in this way information. For these reasons it is very important to check the Land Use shapefile to identify the element with minimum width you want to represent and consequently choose cell size equal to or smaller than half of this width. TOOLSET 1: RASTER LAND USE CREATION 21 Example Box (you can find all the files described in EXAMPLE_BOX folder attached) 1. Click the dropdown arrow and add LandUse shapefile. 2. Select the attribute field LAND_USE. 3. Choose 1 meter cell resolution by putting a constant value of 1. 4. Set location and name for the Raster Land Use you are creating and click OK. 5. Compare your result with our luseraster grid below. 22 EVACUATION ROUTES TOOLS TOOLSET 1: RASTER LAND USE CREATION 23 24 EVACUATION ROUTES TOOLS 5. TIN CREATION AND SLOPE EXTRACTION Slope of terrain is one of the factors that most influence the evacuation speed; walking or running on a steep area would be more expensive in terms of physical exertion than doing the same on a flat zone. For this reason it is an important input in evaluation of Cost Weighted Distance. If you don’t have slope values in your area, you will be able to calculate them using ArcGIS® tools starting from digital terrain elevation. The fastest way to do so is to create a TIN (Triangulated Irregular Network) Dataset from your elevation source feature and extract slope percentage using Spatial Analyst extension. 5.1 TIN Creation From the 3D Analyst toolbar on your project select: Create/Modify TIN TIN CREATION AND SLOPE EXTRACTION Create TIN From Features…. 25 Use now the dialog box to select the elevation source shapefile and all the other features you want to add to the TIN: 26 EVACUATION ROUTES TOOLS 1 2 4 1) Check the feature of the Table of Contest containing elevation values. If you don’t have the shape file on the list, please browse you computer to the folder you have stored it. TIN CREATION AND SLOPE EXTRACTION 27 2) Select the attribute table field describing elevation. (Add in the same way all the other features you want to add to the TIN: polygon as hard clips, roads as soft lines, etc.) 3) Click OK. The output will be a terrain 3D digital model calculated from the interpolation of contour lines. 28 EVACUATION ROUTES TOOLS Example Box 1. Click Create/Modify TIN and Create TIN From Features 2. Check Topography on the left-side of dialog box 3. Set TP_ELEV as the Height source and hard line in the “Triangulate as” box TIN CREATION AND SLOPE EXTRACTION 29 4. Check Coastline on the left-side of dialog box 5. Set TP_ELEV as the Height source and hard line in the “Triangulate as” box 30 EVACUATION ROUTES TOOLS 6. Check AREA_PROVA (AREA PROVA = TEST AREA) 7. Set <None> as the Height source and hard clip in the “Triangulate as” box 8. Click OK and compare the result to the Tin Dataset called tin in the EXAMPLE_BOX folder. TIN CREATION AND SLOPE EXTRACTION 31 32 EVACUATION ROUTES TOOLS 5.2 Slope Extraction From the 3D Analyst toolbar on your project select: Surface Analysis Slope…. In the dialog box follow these steps: TIN CREATION AND SLOPE EXTRACTION 33 1 2 3 4 5 1) Choose the TIN Dataset you just created. 2) Check the Percent output measurement. 3) Define the output cell size. Choose the same value you chose for Land Use raster dataset (1 meter) so put 1. 34 EVACUATION ROUTES TOOLS 4) Give name and destination folder to the Slope Raster Dataset you will obtain. 5) Click OK. The output is the desired Slope Raster Dataset. TIN CREATION AND SLOPE EXTRACTION 35 Example Box: 1. Select tin as the input surface from EXAMPLE_BOX folder. 2. Check percent output measurement. 3. Leave the default value for z factor (e.g. 1). 4. Set to 1 the value for the cell size. 5. Set location and name for your slope Dataset. 6. Compare your result with the slope surface inside EXAMPLE_BOX folder. 36 EVACUATION ROUTES TOOLS TIN CREATION AND SLOPE EXTRACTION 37 38 EVACUATION ROUTES TOOLS 6. TOOLSET 2: RECLASSIFICATION Reclassification of land use and slope are basic steps of the analysis. By this procedure you will give, to each class of the two datasets, a new value, describing their capability to modify the speed of walking person. The new values will represent how much the average speed will be conserved on the different land use types and slope values. On a road (supposed on a flat land), for example, the average speed will not be reduced so roads will have a new values of 100 representing a speed conservation of 100%. In case of a person walking or running on a beach, his speed will be certainly reduced, so the conservation value must be less than 100, for example 70; It means that his speed has been reduced of 30%. Inside the RECLASSIFICATION toolset you find RECLASSIFY LAND USE and RECLASSIFY SLOPE models that will help you through this process. TOOLSET 2: RECLASSIFICATION 39 6.1 RECLASSIFY LAND USE model Double click on the RECLASSIFY LAND USE model icon (see Fig. 3) and start filling the dialog box following next indications: 1 3 2 4 5 40 EVACUATION ROUTES TOOLS 1) Browse your computer and set the land use Raster Dataset you want to reclassify. 2) Select the field containing land use type information. 3) Set the new values you want to assign to each land use type, according to the “speed conservation” criterion. 4) Choose location and name for your output. 5) Click OK. The result of these operations will be the new land use grid in which each value represent the capability of walking and running on that kind of surface. TOOLSET 2: RECLASSIFICATION 41 Example Box: 1. Select luseraster grid from CASE_STUDY folder. 2. Choose Land_use as the field to be reclassified. 3. Give the new values following the table: 4. Choose name and location for your reclassified land use. 5. Look at luse_recl grid into EXAMPLE_BOX folder. Land Use type New Values Beach 70 Buildings 5 Coconuts_trees 65 Fishing_pools 3 High grass 40 Lakes & Wetlands 2 Rivers & Channels 1 Roads 100 Rubber_trees 55 Reclassification table for land use 42 EVACUATION ROUTES TOOLS TOOLSET 2: RECLASSIFICATION 43 6.2 RECLASSIFY SLOPE model The same criterion must now be applied for the slope reclassification procedure. Double-Click on the RECLASSIFY SLOPE model (see Fig. 3) and the dialog box represented below will be shown: 1) Select the slope raster dataset to be reclassified. 2) Select the reclass field; normally the only option is the Value field. 3) Before proceeding is better to Classify your slope by dividing it into intervals. 44 EVACUATION ROUTES TOOLS 1 2 3 4 5 6 TOOLSET 2: RECLASSIFICATION 45 • 3.1 – Select Defined Interval on the classification method dropdown arrow. • 3.2 – Choose your preferred value for the interval size. 3.1 3.2 46 EVACUATION ROUTES TOOLS 4) Insert the new values for reclassification, and choose them according to the same criterion you used for land use reclassification (speed conservation). 5) Set name and location for your reclassified slope. 6) Click OK. Once you created and reclassified your Land Use and slope you are ready to start using Cost Functions in order to create CWD Surface and analyze it for evacuation routes calculation. TOOLSET 2: RECLASSIFICATION 47 Example Box: 1. Select slope grid from EXAMPLE_BOX folder. 2. Select Value field for reclassification. Slope [%] New Values 0–3 100 3–6 85 6–9 70 9 – 12 55 12 – 15 45 15 – 18 40 18 – 21 35 21 – 24 30 24 – 27 25 6. Click Ok. 27 – 30 20 7. Give the new values for the reclassification following the table on bottom. 30 – 33 25 33 – 36 14 36 – 39 13 8. Set name and reclassified slope. 39 – 42 12 42 – 45 11 45 – 48 10 NoData NoData 3. Click Classify on the right of the dialog box (up on this page you find representation of these steps). 4. Choose Defined Interval on the Classification Method drop-down arrow. 5. Define 3 the value for the interval size. location for your 9. Click Ok and compare your result with slope_recl grid on the EXAMPLE_BOX folder. Reclassification values table for slope 48 EVACUATION ROUTES TOOLS TOOLSET 2: RECLASSIFICATION 49 50 EVACUATION ROUTES TOOLS 7. TOOLSET 3: EVACUATION SPEED MAP (INVERSE) This toolset and the related model will guide you towards the creation of the cost surface. As already explained in the theoretical background chapter (see Chap. 2), the value of each cell of this surface, represents the cost that must be spent to walk through it. The cost will be computed combining the average speed of evacuation with the reclassified value of Land Use and slope. Each cell of the output surface will contain the value of the inverse of the crossing speed or, multiplying the value by the cell dimension, the time necessary to walk through the cell. Double-Click on the EVACUATION SPEED MAP model (see Fig. 3) and follow the instruction: TOOLSET 4: EVACUATION TIME MAP & BASINS 51 1 2 3 4 5 52 EVACUATION ROUTES TOOLS 1) Select the reclassified land use dataset. 2) Select the reclassified slope dataset. 3) Choose a value for the average evacuation speed. 4) Set name and location of the inverse speed map you are creating. 5) Click OK. The output will be the grid of time needed (in sec/m) to walk on each cell, according to the land use type and the slope in the cell. TOOLSET 4: EVACUATION TIME MAP & BASINS 53 Example Box: 1. Set luse_recl dataset as the land use reclassified grid. 2. Select slope_recl from the CASE_STUDY folder. 3. Set 1,2 m/sec as the average value for evacuation speed; that is commonly used as normal speed for pedestrian evacuation. 4. Set name and location for your output. 5. Click Ok and look at the inv_speed raster dataset inside EXAMPLE_BOX folder. 54 EVACUATION ROUTES TOOLS TOOLSET 4: EVACUATION TIME MAP & BASINS 55 56 EVACUATION ROUTES TOOLS 8. TOOLSET 4: EVACUATION TIME MAP & BASINS Using this toolset you will obtain the CWD Surface. In this surface the value of each cell represents the cost needed to go to the nearest (in terms of cost) source point, following the costless path. In our study case, source points will be defined by the assembly points layer, and cost values will be expressed in terms of time: each cell will report the time necessary to go from there to the costless shelter following the fastest path. The first output will be an evacuation time map (time is expressed in seconds if you defined average speed value in m/sec). Take notice that when you create the assembly points layer, you should also insert 4 points, representing imaginary corners, completely outside the study area; this is necessary because the Cost Distance algorithm perform its analysis only in the area included by the source points. With this trick the analysis will be performed for the whole study area. TOOLSET 4: EVACUATION TIME MAP & BASINS 57 Looking at the map and the related values you can suddenly notice which parts of the area need more time to be evacuated. Second output of the toolset will be a basin map; the application of hydrological criteria to the virtual surface created, will allows you to divide the whole space into basins, very similar to the drainage ones. In our case, they will represent the portions of the area referring to each of the shelter points. Double-Click on the EVACUATION TIME MAP & BASINS model (see Fig. 3) and fill the dialog box following the indications: 58 EVACUATION ROUTES TOOLS 1 2 3 4 5 6 7 8 9 TOOLSET 4: EVACUATION TIME MAP & BASINS 59 1) Browse your computer and set the evacuation speed map you created in the previous step of the analysis. 2) Choose the layer containing assembly points for your area. 3) Set name and location for your first temporary time map (you can delete this grid after the analysis). 4) Select the raster grid you want to use as mask. If you did not create it just put the constant value 1 by typing it. This mask is useful because without using it you will find the highest evacuation time values inside cells belonging, for example, to lakes & wetlands land use type. To have a more realistic idea of the highest evacuation time for your study area you should filter those cells out. Follow the instruction in the next Mask Creation Box to create a raster grid assigning NoData to all cells you do not want to consider as starting point and a constant value of 1 to all the rest. If you do not want to use it, please remember that the highest values maybe are not so realistic, because it’s very hard to imagine people starting their evacuation from inside a lake or a fishing pool for example. 60 EVACUATION ROUTES TOOLS 5) Set name and location of your evacuation time map after the correction with mask (if you put the constant value of 1 in step 4 the result will be the same of step 3). 6) Set name and location for the Flow direction raster grid. This dataset will be useful for the evacuation routes visualization at the end of the process. 7) Set name and location for the Flow accumulation grid. Also this raster surface will be used at the end by the Hydrology Modelling interactive tool in the evacuation routes visualization. 8) Set name and location for the Basins raster grid. 9) Click OK. Now you have values, for each point of your area, of the time needed to go to assembly point. You also have a partition of the territory according to the shelter points. TOOLSET 4: EVACUATION TIME MAP & BASINS 61 Mask Creation Box: Once you chose the land use elements you do not want to consider during the evacuation time calculation, you can simply create the Raster Mask to be used on step 4 on this chapter. To do this, just use the RECLASSIFY LAND USE model described in chapter 6.1. By assigning the new values of NoData (see chapter 6.1 - step 3) to all the elements you want to filter out and 1 to all the other land use types you will obtain the desired mask. Performing the calculation using such a filter mask will allow you to obtain more realistic evacuation time for your study area. 62 EVACUATION ROUTES TOOLS Example Box: 1. Select inv_speed raster dataset from EXAMPLE_BOX folder. 2. Choose REF_SHELTER feature for the evacuation shelter layer. 3. Set name and location for your first temporary time map. 4. Select lakeswet_mask dataset from the EXAMPLE_BOX folder. 5. Set name and location for your evacuation time map correct. 6. Set name and location for the flow direction raster grid. 7. Set name and location for the flow accumulation dataset. 8. Set name and location for the basins raster grid. 9. Click OK Compare your outputs with time_map and basins_map dataset of the EXAMPLE_BOX folder. TOOLSET 4: EVACUATION TIME MAP & BASINS 63 time_map raster dataset 64 EVACUATION ROUTES TOOLS basins_map raster grid TOOLSET 4: EVACUATION TIME MAP & BASINS 65 66 EVACUATION ROUTES TOOLS 9. TOOLSET 5: BASINS STATISTICS – MAXIMUM VALUE AND AREA Once basins raster dataset has been created, it is possible to extract important information from it, such as the area and the maximum value of evacuation time for each basin. The output will be a polygon shapefile of basins with the attribute table containing area and maximum evacuation time value for each basin. Double-Click on the BASIN STATISTIC – MAXIMUM VALUE AND AREA model (see Fig. 3) and follow the instructions: EVACUATION ROUTES VISUALIZATION: HYDROLOGY MODELING INTERACTIVE PROPERTIES 67 1 2 3 4 5 6 7 8 68 EVACUATION ROUTES TOOLS 1) Select the basins grid you created with EVACUATION TIME MAP & BASINS toolset of this toolbox. 2) Set the evacuation time map. 3) Choose the statistics type you want to perform. MAXIMUM is set by default because it’s exactly the value we want to extract at the moment. 4) Set name and location of the raster dataset in which each cell is given the highest value you would find in its own basin. 5) Set name and location of a temporary raster grid the toolset utilize for next calculation. It is of no use for the analysis so it can be deleted at the end. 6) Set name and location of a temporary feature class. It can be deleted at the end of the process. 7) Set name and location of the shape file containing area and maximum value for each of the basins. 8) Click OK. EVACUATION ROUTES VISUALIZATION: HYDROLOGY MODELING INTERACTIVE PROPERTIES 69 Looking at the attribute table of your output you will find maximum evacuation time values in the attribute field called GRIDCODE (all the values are expressed as integer numbers) and area values in the field called F_AREA. 70 EVACUATION ROUTES TOOLS Example Box: 1. Browse to the EXAMPLE_BOX folder and select basins_map raster dataset. 2. Set time_map raster dataset from the same folder. 3. Leave the default statistics type MAXIMUM. 4. Set name and location of the raster grid containing for each basin the maximum value extracted from time map. 5. Set name and location of a temporary raster dataset you will delete at the end of the process. 6. Set name and location of a temporary feature class layer. 7. Set name and location of the polygon shape file of basins containing area and maximum evacuation time values. 8. Click OK and compare your output and the related attribute table with the basins_max_area.shp polygon shapefile you can find into your EXAMPLE_BOX folder. EVACUATION ROUTES VISUALIZATION: HYDROLOGY MODELING INTERACTIVE PROPERTIES 71 Basins_max_area polygo shapefile. The field GRIDCODE (Maximum evacuation time) is displayed 72 EVACUATION ROUTES TOOLS 10. EVACUATION ROUTES VISUALIZATION: HYDROLOGY MODELING INTERACTIVE PROPERTIES Following the similarity between CWD Surface and topography surface described in chapter 2, we can use Hydrologic tool. To do this ESRI extension for ArcGIS® 9.0 named Hydrologic Modeling must be installed. 10.1 Installation of Hydrologic Modeling extension The procedure required to install Hydrologic Modeling tool is the same commonly used for any other ArcGIS 9.0 extension. Follow instructions below if you feel you might need help during the process: EVACUATION ROUTES VISUALIZATION: HYDROLOGY MODELING INTERACTIVE PROPERTIES 73 1 2 74 EVACUATION ROUTES TOOLS 1) From the main menu of your ArcMap project click Tools. 2) Point Customize. 3) In the Customize dialogue box click Add from file. 4) Browse your computer through these folders: EVACUATION ROUTES DEFINITION Hydrologic Modeling Visual_Basic 5) Select the esrihydrology_v2.dll file and click open. 6) Check Hydrology Modelling on the new toolbars list. 7) Click Close and the Hydrology Modelling toolbar will appear on your project EVACUATION ROUTES VISUALIZATION: HYDROLOGY MODELING INTERACTIVE PROPERTIES 75 3 76 EVACUATION ROUTES TOOLS 4 5 EVACUATION ROUTES VISUALIZATION: HYDROLOGY MODELING INTERACTIVE PROPERTIES 77 6 7 78 EVACUATION ROUTES TOOLS 10.2 Interactive properties settings and Evacuation routes visualization Once you have correctly installed the Hydrologic Modelling extension you can start using it from the toolbar on your project. First step is to set the parameters for the interactive properties tool: 1 2 EVACUATION ROUTES VISUALIZATION: HYDROLOGY MODELING INTERACTIVE PROPERTIES 79 1) Click the Hydrology drop - down arrow. 2) Point Interactive Properties… on bottom. 3) On the Properties dialogue box set the flow direction dataset you created with the EVACUATION TIME MAP & BASINS toolset. 4) Choose the flow accumulation grid calculated at the same time. 3 4 5 5) Click Ok. 80 EVACUATION ROUTES TOOLS Now the tool is ready to be used. Click on the Rain Drop interactive tool and start visualizing evacuation routes by clicking wherever you want inside your study area. The polyline graphic elements you obtain show you the costless (and so fastest) path to reach the best shelter starting from that point. If you are interested in transforming these graphic elements into shapefiles you can use the ConvertGraphicsToFeatures tool you find into the EVACUATION ROUTES DEFINITION folder provided in attachment to this manual. EVACUATION ROUTES VISUALIZATION: HYDROLOGY MODELING INTERACTIVE PROPERTIES 81 Following the instructions described into the ConvertGraphicsToFeatures_readme.txt file you will install the tool button on your toolbar and you will be able to save the graphic objects representing evacuation routes into a polyline shapefile. Example Box: 1. Set the interactive properties dialogue box by choosing flowdir (for Flow direction) and flowacc (for Flow accumulation) raster datasets from the EXAMPLE_BOX folder. 2. Click the Rain Drop interactive tool and start choosing point of the study area. Below you will find an example of evacuation routes visualization 82 EVACUATION ROUTES TOOLS EVACUATION ROUTES VISUALIZATION: HYDROLOGY MODELING INTERACTIVE PROPERTIES 83 84 EVACUATION ROUTES TOOLS REFERENCES 1. McCoy J., Johnston K, Kopp S. et al., “Using ArcGIS® Spatial Analyst™”, ESRI©, pp. 232 (2002). 2. Bratt S., Booth B., “Using ArcGIS® 3D Analyst™”, ESRI© , pp. 374 (2004). 3. McCoy J., “Geoprocessing in ArcGIS®”, ESRI© , 101 – 219, 241 – 333 (2004). Internet references: 1. http://www.esri.com 2. http://www.edn.esri.com 3. http://edn.esri.com/index.cfm?fa=codeExch.sampleDetail&pg=/arcobjects/9.1/Samples/SpatialAn alyst/HydrologicModeling/HydrologicModeling.htm (Hydrologic Modeling extension) 4. http://arcscripts.esri.com/details.asp?dbid=12830 (Convert Graphics to Features tool). REFERENCES 85 86 EVACUATION ROUTES TOOLS APPENDIX Files used Compulsory Input Text Reference Example Box Reference Land Use shapefile Chapter 4 step1 LandUse (Shapefile) Elevation contour lines Chapter 5.1 step 1 Topography (Shapefile) Shelter points Chapter 8 step 1 REF_SHELTER (Shapefile) Study Area borders Chapter 5.1 step 3 AREA_PROVA (Shapefile) Coast Line Chapter 5.1 step 3 Coastline (Shapefile) Raster Mask Chapter 8 step 4 lakeswet_mask (Raster Dataset) Land Use raster grid Chapter 4 step 3 luserastergrid (Raster Dataset) TIN – 3d model of terrain Chapter 5.1 step 4 tin (TIN Dataset) Slope raster surface Chapter 5.2 step 4 slope (Raster Dataset) Land Use reclassified grid Chapter 6.1 step 4 luse_recl (Raster Dataset) Optional Input Output REFERENCES 87 Slope reclassified grid Chapter 6.2 step 5 slope_recl (Raster Dataset) Inverse of evacuation speed grid Chapter 7 step 4 inv_speed (Raster Dataset) Evacuation Time map corrected Chapter 8 step 5 time_map (Raster Dataset) Flow Direction surface Chapter 8 step 6 flowdir (Raster Dataset) Flow accumulation surface Chapter 8 step 7 flowacc (Raster Dataset) Basins grid Chapter 8 step 8 basins_map (Raster Dataset) Basins shapefile Chapter 9 step 7 basins_max_area (Shapefile) Evacuation Time map before mask correction Chapter 8 step 3 Raster grid of maximum values of basins Chapter 9 step 4 Temporary Raster Dataset Chapter 9 step 5 Temporary Feature Class Chapter 9 step 6 Temporary files to delete 88 EVACUATION ROUTES TOOLS