1
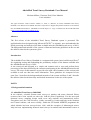
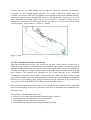
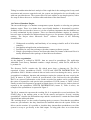
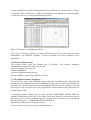
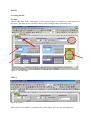
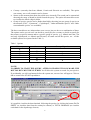
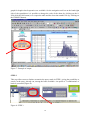
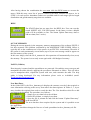
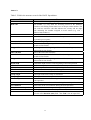
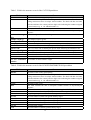
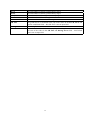
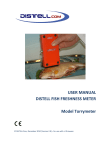
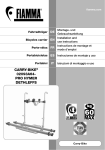
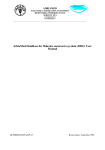
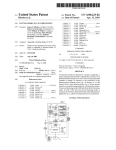
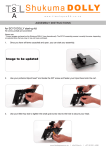
SCIENTIFIC COOPERATION TO SUPPORT
RESPONSIBLE FISHERIES IN THE ADRIATIC SEA
Food and
Agriculture
Organization
of the
United Nations
MiPAF
Italian Ministry
of Agriculture
and
Forestry
Policies
AdriaMed
GCP/RER/010/ITA
AdriaMed Trawl Survey Databank: User Manual
AdriaMed Occasional Papers No.12
GCP/RER/010/ITA/OP-12
Termoli (Italy), November 2003
AdriaMed Trawl Survey Databank: User Manual
Nicoletta Milone, Vincenzo Zeuli, Piero Mannini
FAO-AdriaMed
This paper should be cited as follows: Milone, N., Zeuli, V., Mannini, P. (2003) AdriaMed Trawl Survey
Databank: User Manual. FAO-MiPAF Scientific Cooperation to Support Responsible Fisheries in the Adriatic
Sea. GCP/RER/010/ITA/OP-12. AdriaMed Occasional Papers, 12: 18 pp. Available from the World Wide Web
at http://www.faoadriamed.org/pdf/OP-12.zip
Abstract
The first release of the AdriaMed Trawl Survey Databank system is presented. The
application has been designed using Microsoft EXCEL© to organize, store and undertake the
initial processing and analysis of the data available after the AdriaMed trawl survey of 2001.
The background and rationale of the system is illustrated and some guidelines on the use and
the utilities related to the system are given.
Introduction
The AdriaMed Trawl Survey Databank is a computerized system, based on Microsoft Excel©
for organizing storing and undertaking the preliminary analysis of the dataset available after
the AdriaMed trawl survey of 2001.
It was conceived and designed as a simple and common tool to store and perform basic
processing of the data collected by the countries participating in the AdriaMed demersal trawl
survey. The scope of this manual is to provide users with a brief summary of the various tools
available to turn raw data into useful information. These guidelines are composed of two
parts: Part 1 describes the background and rationale of the system and Parts 2 and 3 describe
the utilities related to the data entry and include instructions on the use of the system.
PART 1
1. Background information
1.1 AdriaMed Trawl Survey 2001/2002
In the Adriatic, scientific bottom trawl surveys to monitor and assess demersal fishery
resources have been carried out since the 1948-49 (Hvar Expedition). For the most part
demersal survey sampling design could cover only national and international waters.
Exceptions were the 1982-84 survey, jointly executed by Croatia and Italy in the Northern
and Central Adriatic, and more recently, within the EU-funded MEDITS programme the
whole Adriatic has been surveyed since 1996, with the exception of Montenegrin waters.
Italy has been implementing demersal trawl surveys in national and international waters to
1
the territorial waters of the other coastal countries since 1985. A common approach is needed
at regional level when the key demersal resources are straddling stocks across the boundaries
between territorial seas and international waters where open access conditions apply. The
consideration that the most important commercial stocks of the Adriatic are shared by the
national fishing fleets makes it necessary their monitoring and assessment to be carried out
over the whole Adriatic Sea.
During the 2nd Coordination Committee Meeting held in Slovenia (Portorož, 22-23 November
2000, AdriaMed 2001, GCP/RER/010/ITA/TD-04 refers) the “AdriaMed Trawl Survey”, one
of the proposed research activities, was regarded as being of prime interest; its aim was an
eastward extension of the Italian demersal trawl survey to include Albanian, Croatian and
Slovenian waters. The major intentions were to collect, compile and process data following a
common protocol prepared and agreed upon by all researchers involved; to carry out joint
data elaboration and analysis and finally to make an appraisal of the status of demersal
resources using stock assessment tools.
The programme was adopted with the participation of the scientists from four countries:
Albania, Croatia, Slovenia and Italy. The programme has several objectives and among the
principal aims are:
1) to describe the zoogeographic distribution and pattern occurrence of target species
encountered and where possible the relationship of such patterns to observed
environmental features (sea depth, sediments, temperature);
2) to estimate relative abundance indices for target species in time and space and finally,
where possible to perform stock assessment.
1.2 Trawl Data
The AdriaMed Trawl Survey was performed in Autumn 2001 and Winter 2002 within
territorial waters of Albania, Croatia and Slovenia. For the execution of the programme two
vessels were used: chartered F/V “Pasquale e Cristina” in the national waters of Albania and
R/V vessel “Andrea” in the national waters of Croatia and Slovenia.
The stations surveyed were 18 for Albania, 22 planned in Croatia but only 17 surveyed, 2 for
Slovenia (Annex A). A list of 13 target species was identified taking into consideration the
list of priority species whose stocks are shared in the Adriatic Sea as identified by the
AdriaMed Working Group on Demersal Resources, and reported in Annex B, Table 5 of the
Working Group report (GCP/RER/010/ITA/TD-02 refers, AdriaMed 2000; Group A).
The sampling procedures used are similar and coherent with those of the Mediterranean
International Trawl Survey (MEDITS) Programme (Bertrand et al., 1996). Catch in weight
and number of target and non-target species was recorded and catch rates obtained. For target
species biological data such as sex, gonad maturity and length-size composition were
recorded. Sampling and sub-sampling procedures utilised “raising factors” in assessment of
total numbers individuals caught per species. Data were entered into specially created sheets
included as Annex C.
The haul logbook held the following information: haul start and end positions and time, total
catch weight, bottom depth at haul start and at haul end as well as length of trawl wire
2
released into the sea. Haul timing was 60 minutes, except for Slovenia (39 minutes),
irrespective of the trawling depth (stratum). The Italian commercial bottom trawl net
(“tartana”) used in the GRU.N.D. programme was constantly utilised with standard auxiliary
spare parts (bottom ropes, floating balls, knotless cod-end stretched mesh size was of 20
mm). Horizontal net opening, before surveys, was measured by “Scanmar”-Norway wireless
transducers, in stratum of 50-100 meters. In this case the net was 24,2 meters and vertical
opening around 1 meter (Annex A, Tables 2, 3 and 4).
Figure 1. Map of the stations in AdriaMed 2001/2002 trawl survey program.
1.3. The AdriaMed Trawl Survey Databank
Since the AdriaMed trawl survey was carried out, the need to have easily available and to
utilize the large amount of collected data was identified. The creation of a regional logical
databank holding all the data collected by country and for the whole region was undertaken.
The idea was to design a simple system to store the available data and which would facilitate
basic analysis. The proposal was illustrated at the Fourth Meeting of the AdriaMed
Coordination Committee held in Split, Croatia, December 2002. On that occasion it was
agreed that it would be necessary and appropriate to finalize the logical databank proposed by
the Project so as to hold the whole data set obtained from the execution of the bottom trawl
survey in 2001/02 (GCP/RER/010/ITA/TD-09 refers, AdriaMed 2003).
One of the main objectives was to create a basic and useful tool, common for the AdriaMed
countries participating in the survey and that would allow to facilitate and to standardize the
data entry work.
The creation of the data bank allowed for:
• Effective survey data sharing among the participating countries;
• Implementation of common data collection protocol;
• Standardization of the data entry procedures;
• Standardization of primary data compilation and reporting.
3
Taking in consideration that basic analysis of the rough data is the starting point for any stock
assessment and resources appraisal work, the system was designed to be user-friendly even
with non specialized users. The system offers few basic utilities to run simple queries; with a
few steps it allows the user to visualize tables and charts of the data filtered.
1.4 Choice of Database Engine
The successful design of a database management system depends on selecting an optimum
database engine. There is no doubt that a user-friendly database is determined by positive
feedback on the user interface, however it is also of primary importance that the database can
be easily maintained by the operators. There are numerous database engines in existence,
however most are intended for dedicated network servers or for operators with highly specific
training. The Project chose Microsoft Excel© software because of the following
characteristics:
Widespread accessibility and familiarity of use among scientific staff of all Adriatic
countries;
Straightforward application and maintenance;
Possibility for easy data exchange with other common software systems;
Simple export/import of data to and from other data file formats as Microsoft Excel is
usually distributed with a package of other Microsoft software.
1.5 Database organization
As the database is realised in EXCEL, data are stored in spreadsheets. The application
AdriaMed Trawl Survey Databank contains a single directory, called DATA, and the file
b_stratum.xls.
The directory DATA contains the file which stores data: a_dataentry.xls. The file is
organized in three spreadsheets: HAUL, CATCH and LENGTH DISTRIBUTION. The
spreadsheet HAUL includes technical data on hauls carried out during the survey (such as
geographical coordinates, duration and parameters required to estimate the area swept by the
gear). In Annex A, Table 2 details on specifications of the field used in the spreadsheet
HAUL are reported. Information on the catches recorded (in number and in weight) during
the cruises is reported for each species in the spreadsheet CATCH (Annex A, Table 3 refers).
Finally records with frequencies grouped in length classes, for each species, and sex data are
reported in the spreadsheet LENGTH DISTRIBUTION (Annex A, Table 4 refers). An
example of the spreadsheets is reported in Figure 2.
The file b_stratum.xls represents the working file. It is organized in several worksheets. The
START page is the starting point to run all the macros and queries. Several “working
spreadsheets” visualize the intermediate steps and the “results sheets” contain the filtered data
organized into tables and charts.
The “working sheets” are the results of running queries or macros. Note that the spreadsheet
names are just indicative but they should not be modified otherwise the system will be not
able to run the routines. It is possible to visualize these intermediate spreadsheets even if the
system is set up to go directly to the final output. To help guide users as to what sheets
4
contain, AdriaMed uses different background colours: white for the ”working sheets” (Figure
2) and blue for the “result sheets”. With several navigation tool options on the right hand side
of each sheet, the user is easily guided among the sheets.
Figure 2. Example of a working spreadsheet.
In the next version the possibility to export data directly into a new Excel file have been
implemented. An EXPORT procedure is being developed and will be included in the
application.
1.6 Hardware Requirements
The package comes with User Manual and a CD-ROM. The following minimum
configuration is required for the system to work:
Microsoft Windows 95 /98/00 XP
At least 64MB RAM
A 800x 600 high resolution monitor
At least 10MB free space in the Windows directory.
1.7 The application and its installation
To receive a free copy of the CD-ROM, please contact the AdriaMed Project. The CD-Rom
includes the full AdriaMed Trawl Survey Databank package, plus a copy of this Manual and
the HELP file. The application has been thoroughly tested but users are invited to report to
the Project if “bugs” are discovered. Any suggestions fro improvement of the application will
be highly appreciated.
To install the system, simply copy the whole directory ADRIAMED TRAWL SURVEY
from the CD-ROM directly in your C drive disk. Please note that the system does not work if
the directory is not correctly installed: on your computer at the end of the process you should
have the directory as C:// ADRIAMED TRAWL SURVEY.
READ the file HELP before using the software.
For more enquiries, please write to the AdriaMed Project:
5
FAO-AdriaMed
Corso Umberto I, 30
86039 Termoli (CB)
ITALY
Tel: +39 0875 708240/708252
Fax: +39 0875 720065
Email: [email protected]
1.8 Testing and Improvement
The application has been distributed in a β version to the National Focal Points and to the
research institutes participating in the AdriaMed demersal survey programme. Currently,
many valuable suggestions and comments received from experts collaborating with
AdriaMed are being taken into account for the improvement of the AdriaMed Trawl Survey
Databank, and will be included in the next release. The next planned logical steps for the
development of the AdriaMed Trawl Survey Databank is the release of the utilities and a new
version realized with the commercial software Microsoft ACCESS©, better suited to hold the
large data set expected to be available in the near future. Nevertheless, it is believed that the
AdriaMed Trawl Databank at the moment represents a usable prototype of a regional
database, a necessary step to design the ultimate survey database system.
Acknowledgments
Many thanks are due to Nedo Vrgoć, Nicola Ungaro and Bojan Marčeta for their comments,
suggestions, and information necessary to improve this application.
6
PART 2
2. Getting started
2.1 Start
The START sheet is the “homepage” of the system (Figure 3). Each query must start from
this sheet. The data can be sorted by various criteria using the three following steps:
Figure 3. The start page.
STEP 1
Figure 4. STEP 1.
Three boxes are available to customise the search (Figure 4). Users can investigate by:
7
•
•
•
Country: (currently data from Albania, Croatia and Slovenia are available). The option
one country, two or all countries can be chosen.
Strata: (at the moment data from 0m to 800 m are inserted). The search can be customised
choosing the range of depth in which focused the query. The option all strata allow users
to visualize the whole range 0-800m.
Group of species: queries can be further detailed by choosing just one group of species (at
the moment “Fish”, “Crustacean”, “Cephalopod”, “Other marketable species” and “Other
not marketable species” are available).
The three search boxes are independent: users can use just one box or a combination of them.
The options can be several: user can decide to search just for a country or decide to search for
that country a specific stratum and/or a specific group of species. (e.g. Albania and 36m-75m
and only cephalopods; or Albania and Slovenia, all strata and all the species, etc….all the
available options are reported in the Table 1)
Table 1. Options
Country
X
X
X
X
Strata
Group of Species
X
X
X
X
X
X
X
NOTE!
IN ORDER TO START THE QUERY, AFTER YOUR SELECTION IS MADE, THE
BUTTON RUN MUST BE CLICKED. It will allow the system to search for your queries.
If accidentally you click on buttons before the system run, an error box will appear. Click on
OK to return to the START spreadsheet.
It is possible visualize the data obtained, following the queries, by clicking the button DATA
SHEET (to visualize data from the country/ies chosen) or TOTAL BIOMASS (to visualize
catch data for the depth range chosen).
8
STEP 2
Figure 5. STEP 2.
After having run STEP 1, a list of species and target species related to the choice made is
available. For all the species abundance indices (expressed as Kg/Km2 or Ind/Km2) are
available (Figure 5).
Just click on the two buttons INDEXES OF ABUNDANCE (chosen stratum or all strata) and
the table for the species/group of species chosen will be displayed (Figure 6). To visualize
sheet data enquired click on the DATA SHEET button.
Figure 6. Abundance indexes (Kg/Km2 or Ind/Km2).
For the target species records with frequencies grouped in length classes and gonad maturity
stage data are available. By clicking on L/F DISTRIBUTION button and SEX AND GONAD
MATURITY STAGE button user can visualize tables and charts of the species selected. In
Figure 7 an example of output is reported. The table of data for the chosen species and the
9
graph for length class frequencies are available. On the navigation tool bar on the hand right
side of the spreadsheet it is possible to change the scale of the chart (by clicking on the 020/0-40/0-60/0-80 button) or to export the table and the chart into another file (by clicking on
the EXPORT button).
Figure 7. Example of output.
STEP 3
This step allows users to further customize the query made in STEP 1 giving the possibility to
search, in the query already run, among the hauls available. An option of 5 combinations of
hauls is presented (Figure 8).
Figure 8. STEP 3.
10
After having chosen the combination the user must click the RUN button to execute the
macro. With this step a new list of species related to the hauls selected will appear. As in
STEP 2, for each species abundance indexes are available and for each target species length
distribution and gonad maturity stage data are available.
HELP
The START sheet has one more box: the HELP box. User can reset the
search (RESET ALL VALUES button). In the future version a helpful
guide will be available on line. The button Update Data-entry aims to
add new data (Part 3 refers).
OUT OF MEMORY
During the test an anomaly in the temporary memory management of the software EXCEL©
has been reported. This problem (confirmed by the MICROSOFT HELP DESK Office) is
typically due to the continuous use of the queries in an EXCEL© environment. Therefore if
the system is used continuously several times (up to 30) an error message could be appear on
the low memory of the system.
In this case simply close the file b_stratum.xls: this operation will automatically clear (reset)
the memory. The system is now ready to run again with a full budget of memory.
PART 3 (Utilities)
Data integrity is assured and the spreadsheets are protected. Nevertheless users can open and
manipulate the tables directly applying the procedures illustrated as follow. This will allow
user to manipulate table, expand the system with ease, and customize the table. The help
guide is being developed. For any information please write to AdriaMed (email:
[email protected]).
New Data Entry
In the folder DATA, the file a_dataentry.xls displays the structure record of data required to
enter information referring to the survey from where the data originate. In Tables 2, 3, 4 you
may visualize the original form used to record the data. The User should use this file to add
new data to the databank. The procedure is as follows:
1. Simply type new data below the old data.
2. Delete the old data, or simply leave them
3. Open the file b_stratum.xls and click the button “Update Data-entry”
in the box HELP.
The new data have been acquired by the system and it is possible to run
the application.
Note: Users should not change the first row of each spreadsheet in the a_dataentry.xls file.
11
--The structure of the new data must be the same as the old data (the Species code must be a
4-3 code, the date should be dd/mm/yyyy etc…).
--Users should add information just using the three spreadsheets (Length distribution, Catch
and Haul).
--The spreadsheet name should not be changed.
--No spreadsheet must be added (the system is not authorised to read a new spreadsheet).
Exporting and Saving Records
The utilities for exporting and saving data are being implemented. At present to export data
simply copy and paste (Go to Paste special: Values) the data into a new EXCEL file.
Close
To close the procedure you can click on the X button top-right (shortcut to close all the files)
or choose File and afterwards close or exit. The file will close immediately, because the
request to save the working session has been disabled so as not to make the file heavy. If you
want to save the working session click on the menu File and choose the item save as. .
remembering not to overwrite the file.
If by accident you click on the item save the query results will be memorized on the file. At
this point, before running a new working session, you have to overwrite the file b_stratum.xls
with the original copy that you have on the CD and remember to uncheck the Read-only
switch accessible in the properties section.
References
AdriaMed. 2000. Priority Topics Related to Shared Demersal Fishery Resources of the
Adriatic Sea. Report of the First Meeting of the AdriaMed Working Group on Shared
Demersal Resources. FAO-MiPAF Scientific Cooperation to Support Responsible
Fisheries in the Adriatic Sea. GCP/RER/010/ITA/TD-02: 21 pp.
AdriaMed. 2001. Report of the Second Meeting of the AdriaMed Coordination Committee.
FAO-MiPAF Scientific Cooperation to Support Responsible Fisheries in the Adriatic
Sea. GCP/RER/010/ITA/TD-04. AdriaMed Technical Documents, 4: 41 pp.
AdriaMed. 2003. Report of the Fourth Meeting of the AdriaMed Coordination Committee.
FAO-MiPAF Scientific Cooperation to Support Responsible Fisheries in the Adriatic
Sea. GCP/RER/010/ITA/TD-09. AdriaMed Technical Documents, 9: 39 pp.
AdriaMed. International Bottom Trawl Survey in the eastern Adriatic. Report of the
AdriaMed. International Bottom Trawl Survey 2001-2002 FAO-MiPAF Scientific
Cooperation to Support Responsible Fisheries in the Adriatic Sea.
GCP/RER/010/ITA/TD. AdriaMed Technical Documents (in preparation).
Bertrand J., L. Gil de Sola, C. Papaconstantinou, G. Relini et A. Souplet, (Coordonnateurs).
1996. Campagne internationale de chalutage démersal en Méditerranée (Medits).
Campagne 1995. Rapport final, manuel des protocoles et base de données. Rapport
de contrat CEE-IFREMER-IEO-SIBM-NCMR (MED/93/020, 018, 006, 004), 172 p.,
27 p. + annexes.
12
Annex A
Table 2. Field in the structure record of the HAUL Spreadsheet.
Field
Partner
Haul code
Vessel
Date
Time (00:00)B
LatitudeB
LongitudeB
Time (00:00)E
LatitudeE
Longitude E
Depth (m)B
Depth (m)E
Speed (knots)
Route
Duration (min)
Sweep length
Warp length
Bottom shape
Weather conditions
Sea conditions
wind direction and speed
hr
T/60
Note
The name of the country participating
This number is a key field for accessing record in the database.
Therefore each fishing station must have its unique station number. The
haul code has one-letter code that indicates the country and two digit
code indicating the number assigned to trawl station (e.g. A01 =
Albania, haul number 1)
The name of the vessel
This field contains the date in European standard format in
day/month/year sequence
Time at the beginning of the trawl haul
The Latitude at the beginning of the trawl haul, as degrees, minutes, and
seconds in time format
The Longitude at the beginning of the trawl haul, as degrees, minutes,
and seconds in time format
Time at the end of the trawl haul
The Latitude at the end of the trawl haul, as degrees, minutes, and
seconds in time format
The Longitude at the beginning of the trawl haul, as degrees, minutes,
and seconds in time format
The bottom depth in metres at the beginning of the haul operation
The bottom depth in metres at the end of the haul operation
The mean speed of the vessel during trawling in knots
The direction of the trawl operation in degrees
This is the duration of the trawl haul in minutes.
The length of the trawl sweep in centimetres
The length of the trawl warp in centimetres
This is a three letter code indicating the bottom characteristics during the
trawl operation
Some notes on the weather conditions during the trawl operation
Some notes on the sea conditions during the trawl operation
The wind direction and the speed during trawling
The length in centimetres of headrope
This is the duration of the trawl haul up to one hour. It is calculated on
the basis of the Duration (min) field – thus T/60 is not an input field
13
Table 3. Field in the structure record of the CATCH Spreadsheet.
Field
Note
Partner
Haul
The name of the country participating
This number is a key field for accessing record in the database. Therefore each
fishing station must have its unique station number. The haul code has one-letter
code that indicates the country and two digit code indicating the number assigned
to trawl station (e.g. A 1 as Albania number 1)
Vessel
The name of the vessel
Date
This field contains the date in European standard format in day/month/year
sequence
total catch weight The total weight of the catch in kilogram
(Kg)
Sample weight (g)
The sample weight in grams
Raising factor
The raising factor used
Group Species
This is a one/digit code indicating the taxonomic position of each species
Genus code
This is a 4 letter code to identify the genus following the MEDITS rules
Species code
This is a 3 letter code to identify the species name following the MEDITS rules
Total weight (Kg)
The weight of the total catch of the species in kg (not the sample weight)
Total number
The total number of the specimens caught (not the number in the sample)
Male number
The total number of males caught
Female number
The total number of females caught
Sex not established The number of indiscriminate caught
number
Table 4. Field in the structure record of the LENGTH DISTRIBUTION Spreadsheet
Field
Partner
Haul
Vessel
Date
Genus Code
Species Code
Cm
I2-3 M
II2-3 M
III2-3 M
IV 2 M
Tot. M
I2F
Note
The name of the country participating
This number is a key field for accessing record in the database. Therefore each
fishing station must have its unique station number. The haul code has one-letter
code that indicates the country and two digit code indicating the number assigned
to trawl station (e.g. A 1 as Albania number 1)
The name of the vessel
This field contains the date in European standard format in day/month/year
sequence
This is a 4 letter code to identify the genus following the MEDITS rules
This is a 3 letter code to identify the species name following the MEDITS rules
Length frequency classes. The scale is set up at 0.5 cm
The total number of male with gonad maturity stage 1
The total number of male gonad maturity stage 2
The total number of male gonad maturity stage 3 f
The total number of male gonad maturity stage 4
The total males caught
The total number of female gonad maturity stage 1
14
II 2 F
III 2 F
IV 2 F
Tot. F
Sex not established
GR TOT
Raising factor
Raised total
The total number of female gonad maturity stage 2
The total number of female gonad maturity stage 3
The total number of female gonad maturity stage 4
The total number of females caught
The total number of indiscriminate caught
The grand total. It is calculated as the sum of the values in the Tot. M; Tot. F and
Sex not established fields – thus GR TOT is not an input field
The raising factor used
The total number of individual corrected by the raising factor. It is calculated on
the basis of the values in the GR TOT and Raising factor fields – thus Raised
total is not an input field.
15
Annex B
Table 5. List of the Species code. In bold are reported the Target Species.
Code
Species
Code
Species
ALLO MED
Alloteuthis media
HELI DAC
Helicolenus dactylopterus
ALLO SUB
Alloteuthis subulata
HOPL MED
Hoplosteus mediterraneus
ANTO MEG
Antonogadus megalokinodon
HYME ITA
Hymenocephalus italicus
ARGE SPY
Argentina sphyraena
ILLE COI
Illex coindetii
ARIO BAL
Ariosoma Balearicum
LAMA CRO
Lampanyctus crocodilus
ARIS FOL
Aristaeomorpha foliacea
LEPO LEP
Lepidion lepidion
ARNO LAT
Arnoglossus laterna
LEPI CAU
Lepidopus caudatus
ARNO RUP
Arnoglossus rueppelli
LEPM BOS
Lepidorhombus boscii
ARNO THO
Arnoglossus thori
LEPM WHS
Lepidorhombus whiffiagonis
ASPI CUC
Aspitrigla cuculus
LEPT CAV
Lepidotrigla cavillone
BLEN OCE
Blennius ocellaris
LOLI VUL
Loligo vulgaris
BOOP BOO
Boops boops
LOPH BUD
Lophius budegassa
BUGL LUT
Buglossidium luteum
MACO SCO
Macroramphosus scolopax
CALL MAC
Callionymus maculatus
MAJA SQU
Maja squinado
CAPO APE
Capros aper
MERL MER
Merluccius merluccius
CEPO MAC
Cepola macrophthalma
MICM POU
Micromesistius poutassou
CITH MAC
Ciharus linguatula
MOLV DYP
Molva dypterigia
COEL COE
Coelorinchus coelorincus
MONO HIS
Monochirus hispidus
CONG CON
Conger conger
MULL BAR
Mullus barbatus
DASY PAS
Dasiatis pastinaca
MULL SUR
Mullus surmuletus
DENT GIB
Dentex gibbosus
MUST MUS
Mustelus mustelus
DENT SPP
Dentalium spp
MYCO PUN
Myctophum puntatum
DICE LAB
Dicentrarchus labrax
NEPR NOR
Nephrops norvegicus
DIPL ANN
Diplodus annularis
NETT MEL
Nettastoma melanurum
ELED CIR
Eledone cirrhosa
NEZU SCL
Nezumia sclerorhynchus
ELED MOS
Eledone moschata
OCTO SAL
Octopus salutii
ENGR ENC
Engraulis encrasicolus
OCTO VUL
Octopus vulgaris
EUTR GUR
Eutrigla gurnardus
OCTO TET
Pteroctopus tetracirrhus
GADI ARG
Gadiculus argenteus
PAGE ACA
Pagellus acarne
GADU MER
Merlangius merlangus
PAGE BOG
Pagellus bogaraveo
GOBI FRI
Lesuerigobius friesi
PAGE ERY
Pagellus erythrinus
GOBI NIG
Gobius niger
PAPE LON
Parapenaeus longirostris
16
GOBI QUA
Deltentosteus quadrimaculatus PASI SIV
Pasiphaea sivado
PENA KER
Penaeus keathurus
PECT JAC
Pecten jacobaeus
PERI CAT
Peristedion cataphractum
STOM BOA
Stomias boa
PHYI BLE
Phycis blennoides
SYNG ACU
Syngnathus acus
PLAT FLE
Platichys flesus
TODI EBL
Todaropsis eblanae
PLES MAR
Plesionika martia
TRAC MED
Trachurus mediterraneus
RAJA CLA
Raja clavata
TRAC TRA
Trachurus trachurus
RAJA MIR
Raja miraletus
TRAH DRA
Trachinus draco
RAJA OXY
Raja oxyrhyncus
TRIP LAS
Trigloporus lastoviza
SARI AUR
Sardinella aurita
TRIG LUC
Trigla lucerna
SARD PIL
Sardina pilchardus
TRIG LYR
Trigla lyra
SCAE UNI
Scaeurgus unicirrhus
TRIS CAP
Trisopterus minutus capelanus
SCOM PNE
Scomber japonicus
URAN SCA
Uranoscopus scaber
SCOM SCO
Scomber scombrus
ZEUS FAB
Zeus faber
SCOR NOT
Scorpaena notata
SCOR POR
Scorpaena porcus
SCOR SCO
Scorpaena scrofa
SCYO CAN
Scyliorhinus canicula
SCYO STE
Scyliorhinus stellaris
SEPI ELE
Sepia elegans
SEPI OFF
Sepia officinalis
SEPI ORB
Sepia orbignyana
SEPO SPP
Sepiola spp
SERA CAB
Serranus cabrilla
SERA HEP
Serranus hepatus
SYMP NIG
Symphurus nigrescens
SOLE KLE
Solea kleini
SOLE VUL
Solea vulgaris
SPHY SPY
Sphyraena sphyraena
SPIC FLE
Spicara flexuosa
SPIC SMA
Spicara smaris
SPRA SPR
Sprattus sprattus
SQUA ACA
Squalus acanthias
SQUI MAN
Squilla mantis
TORP MAR
Torpedo marmorata
TORP TOR
Torpedo torpedo
17
Annex C: Example of a sampling form used during the AdriaMed Trawl Survey
AdriaMed Trawl Survey
Haul form
PARTNER:
ALB
VESSEL:
PACRI
DAY:
07
MONTH:
11
COORDINATES AT BEGINNING
TIME (00:00):
LATITUDE (00°00'00)
06.25
41 13 69
SPEED
(knots):
2.8
DURATION
(min.):
60
HAUL code:
3
LONGITUDE (00°00'00):
19 22 98
TIME (00:00):
LATITUDE (00°00'00):
07 25
41 11 05
COORDINATES AT THE END
ROUTE:
180
YEAR:
2001
DEPTH (m):
35
LONGITUDE (00°00'00):
19 22 73
SWEEP
LENGTH:
225
WARP
LENGTH:
400
DEPTH (m):
36
BOTTOM SHAPE:
R
WEATHER CONDITIONS:
PARTIAL CLOUDY
NOTES:
SEA CONDITIONS: WIND DIRECTION AND SPEED:
4
S.4
1/4
Type of bottom (mud, sand, ……)
Biocenosis ¼ TOT + S.REGALIS 1.3 Kg
Waste (composition and quantity)
ENVIRONMENTAL PARAMETERS:
Temperature (by MINILOG probe)
Depth (by MINILOG probe)
SCIENTIFIC STAFF ON BOARD:
Stored file code (.bin):
Stored file code (ASCII):
0.25
ASH3
QUARANTA
CERIOLA
18
DECOLLI
BALLGJINI