1
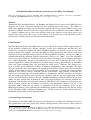
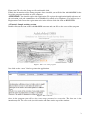
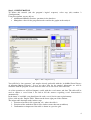
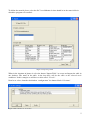
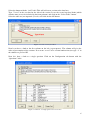
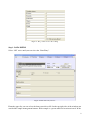
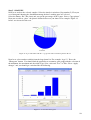
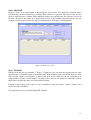
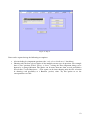
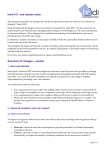
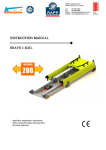
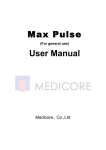
ADRIAMED
SCIENTIFIC COOPERATION TO SUPPORT
RESPONSIBLE FISHERIES IN THE
ADRIATIC SEA
GCP/RER/010/ITA
GCP/RER/021/EC
AdriaMed DataBase for fisheries social surveys data (DBS): User
Manual
GCP/RER/010/ITA/OP-25
Rome (Italy), September 2007
AdriaMed DataBase for fisheries social surveys data (DBS): User Manual
This paper should be cited as follows: AdriaMed. 2007. AdriaMed DataBase for fisheries social surveys data (DBS):
User Manual. GCP/RER/010/ITA/OP-25. AdriaMed Occasional Papers, 25: 12 pp
Abstract
Through the FAO AdriaMed Project, the DataBase for fisheries Social surveys data (DBS) has been
designed and created to hold and manage the data available from social surveys. The DBS is a
stand-alone application designed and produced to organize the storage and preliminary analysis of
the dataset available after the social survey of the fisheries sector in Albania (carried out in 2003). It
is a simple, common tool to store data collected during any fisheries sector social survey and
perform basic processing. The scope of this manual is to provide users with guidelines on the
various tools available to turn raw data into useful information.
1. Introduction
The FAO Regional Project AdriaMed focuses on the Adriatic Sea region with the participation of
all the countries bordering the Adriatic (Albania, Croatia, Italy, Montenegro and Slovenia); the
Project has developed an application titled AdriaMed Database on fisheries social surveys data,
which is designed to organize, store and undertake the initial processing and analysis of the data
available after the AdriaMed Social Survey of Albanian Marine Fisheries, executed in 2003 in
collaboration with the Albanian Fisheries Directorate (Forleo et al., 2005)1. Since the AdriaMed
social survey was carried out, the Project has been asked to investigate and to propose a prototype
for a single application, designed and implemented to store and standardize the data. A first
software application to hold and manage the resultant dataset, called “Questionnaire on AdriaMed
Survey on Socio-economic Data” was developed on a MS Access© platform. The database was
made available to the Albanian scientific institutions collaborating with AdriaMed. The data
emerging from the direct investigation of the Albanian maritime districts were entered into the
archive, divided into the three socio-economic areas investigated: personal data, crew working
conditions and fishing strategy, maritime district characteristics and relations. Following the
requests received from other research institutions to distribute the database, the Project redesigned
and redeveloped the archive, thus creating the continuity with the previous application on MS
Access© but including new features. The new AdriaMed DataBase for fisheries Social surveys data
(DBS) was then created at the beginning of 2007. Since then the Project was asked to distribute the
application. The database was presented during the GFCM SAC Sub Committee on Economic and
Social Sciences and the Sub Committee on Statistics and Information (Kavala, Greece, 17-20
September 2007). Moreover the Project is supporting a social and economic survey of the
Montenegrin fisheries sector, following the methodology applied in Albania and the data are stored
in the AdriaMed DBS. Additional potential users of the system are South African Research
Institutions and the FAO Central Asia sub-region.
2. System design and structure
The structure of AdriaMed DBS was conceived and designed as a simple and common tool to store
and perform basic processing of the data collected during fisheries social surveys. Data collected
1
Forleo, M., Flloko, A., Kristo, R., Mannini, P., Massa, F. (eds). 2005. The Albanian marine capture fisheries: a social
survey and economic aspects of the sector FAO-MiPAF Scientific Cooperation to Support Responsible Fisheries in the
Adriatic Sea. GCP/RER/010/ITA/TD-19. AdriaMed Technical Documents, 19: 156 pp.
1
are included according to the structure of the questionnaires used during the survey (personal data,
maritime district characteristics, and crew working conditions and fishing strategies). Moreover
DBS has a section including features to upload data directly from the national fleet register; efforts
have also been made to export data directly for the GFCM task 1. The information system takes the
form of an easy-to-use database, which each country may adapt according to its own needs.
Country-specific survey questionnaires, data entry systems, and information analyses are easily
created through this system, which is freely available to any potential users and supported by a user
manual.
The archive is organized by AdriaMedDBS in seven steps:
Step
1
2
3
4
5
6
7
Comments
General introduction to the software
Configuration and general setting (which questions in the questionnaire?)
Data entry (manual or by importation of external data sets in excel)
Selection of a subset of your original data to be managed in the following steps
Analysis carried out with histograms and pie-charts
Browse the selected data with different sorting possibilities / Reporting
Export of the selected data in Excel, form and report printouts
The data are organized as samples (the persons being interviewed) answering one or more sets of
questions. The sets of questions are called “Sections”. A questionnaire is organized as one or more
sections (forms to be filled) containing questions the single interviewee will be asked to answer.
Sample
1
2
…
Section 1
Question #1
Question#2
Section 2
Question#3
Question#4
AdriaMedDBS will not only allow you to add new samples but also to add new questions or entire
sections. In other contexts/applications the questions are named “field” or variable. The term
“questions” is here used as more familiar to people working with social surveys and questionnaires.
An answer to a given question can be expressed in any one of the following ways:
• Numerical: a numerical value (like age, number of people in the crew).
• Date: a date
• Fixed: the answer can only be selected from among the possibilities listed (for example the
port in which the interviewee works)
• Multiple: choices as applicable taken from a list of possibilities (for example “things to
know”)
• Text: a text entered response (for example a name)
Some questions are more important and they will be labeled as “Indicators”.
3. SET UP and Installation of the software
Remember that to install a program on your computer you must be a user with the “privilege” to
install new applications. The Administrator will have such capability.
2
From your CD select the Setup.exe file and double click.
Follow the instruction of the Setup program. Once installed you will find the AdriaMedDBS in the
list of the programs installed on your computer.
ATTENTION: You should register this application. To register the application kindly take note of
the activation code and communicate it to AdriaMed (by email or by telephone). You will receive a
Registration Code: Insert the registration code in the relative field and click on REGISTER.
4. Tutorial. Sample working session.
Double click on the icon of the AdriaMedDBS program and you fill see the cover of the program
Figure 1: The cover of the program
Just click on the “enter” label to get into the application.
Figure 2: Part of the intro
Once in the program you will see the seven steps presented as seven tabs. The first one is the
introductory tab. To select a tab just click on the tab name on the top of the window.
3
Step 2. CONFIGURATION
To follow this tutorial (and the program’s logical sequence) select step (tab) number 2
(Configuration).
Using this window you are able to:
• Add/Remove/Modify Sections, questions in the data base
• Manipulate colors for the program interface and for the graphs in the analysis
Figure 3: The configuration step
You will find a “data structure” and samples already preloaded with the “AdriaMed Social Survey
of Albanian Marine Fisheries”. Let us use these data for the tutorial. Afterwards we will be
confident with the program we will delete the data sets to start a new data collection.
As a first operation we will load (import) a table with the vessel names and data. The table will be
used to choose a vessel from a list and to fill the answers regarding vessel characteristics
automatically.
In the future, if available, you should provide such a vessel list for your region/country.
Select (click on) the “Import Table” button on the lower right part of the window.
The import table function works in three steps
1. Selection of an Excel file (extension .xls) where the table is
2. Selection of the worksheet (Excel files can have more than one worksheet)
3. Confirmation to import once the table is shown in a preview grid.
4
To follow the tutorial please select the file VesselAlbania.xls that should be in the same folder in
which the program was installed.
Figure 4: Importing a table
When in the situation of picture 4 select the button “Import Table” to accept and import the table in
our database. The name of the table, in the data base, will be the same as the selected excel
worksheet. In this example we will have a table called “Vessels”.
Now let us select, from the tab/window “configuration” the button labeled “Sections”.
Figure 5: The selection of one section
5
Select the button with the “Add” label. This will add a new section to the data base.
Type “Vessel” in the text box for the title of the section. Leave the second text box blank (which
contains more text to be included in the form printout) and click on the “Select Table” button.
Select the table we just imported (Vessels) and click on the OK button.
Figure 6: A new section just added
Now let us have a look to the first column on the left (seq=sequence). The column will give the
order of presentation of the sections. If we want “vessel” to be section number four just type “4” in
the column seq. Select OK.
Now let’s have a look at a single question. Click on the Configuration tab button with the
“Questions” label.
Figure 7: Selection of a single question from a section
6
Select “Personal Data” as the section and then “working port” from the question list.
See how the first column (“Seq”) gives the sequence of the questions in the given section.
Select the “modify” button for “Working Port”.
Figure 8: Editing a question
Please insert the possible type of question on the right of the “set question” window.
The small text box on the top of the windows is for entering the question title. The other bigger
textbox with the vertical scroll bar is for entering other text, useful explanations or other tuning of
the printed form. In picture 10 both the title and the text are set as “Working port”.
Now, just as an example, let us change the possible port “Valona” to “Tirana” (we know Tirana is
not a port”).
The data already entered as “Valona” will be automatically set as “Tirana”.
You can also add new possible answers (other “working ports”). Let’s change “Other” to “Rome”
and let us add “Other” as the last possibility. The windows should be as follow:
7
Figure 9: The possible choices after editing
Step 3. DATA ENTRY
Select “OK” twice until you can select the “Data Entry”.
Figure 10: The data entry window
From the upper list you can select the form you wish to fill. On the top right side of the window you
can find the sample management buttons. Each sample is a person who has been interviewed. In the
8
example we included 187 samples after the AdriaMed Social Survey of Albanian Marine Fisheries
(2003).
At each sample we attach an identification code. The code can be a number or a combination of
letters and numbers. In the example we named our samples as AL031, AL032... (AL03=Albania
2003).
To move along samples click on the arrows. To jump immediately to a given sample, type the
sample code in the text box on the right of “Find” and click the button.
You will find the Tirana and Rome ports we just added as possibilities as the first question in the
form.
For the moment come back to the Configuration windows and try to set back the “Working port” as
it was at the beginning of our experimenting (Valona not Tirana, Other not Rome).
Step 4. SELECTION
Let’s do a selection of our set of samples. Select step number 4 (Selection).
Suppose we only want the Durazzo, Saranda or S.Giovanni samples and only the interviewees
under 50 years old. We could select the variable from the drop-down list (the first variable is
selected by default).
Select the ports we want and click on the “And” button.
A second group of buttons will be shown with a second drop-down list. Select the question
“Age 12”. This question will ask for a numeric answer (type of question=Numeric).
A minimum and maximum number of text boxes will be given when a numeric/date question is
selected. You do not need to fill in both the boxes. For our example just selected 49 as the
maximum accepted age for the sample. Then click the “End” button. 86 samples are thus selected.
Figure 11: The selection windows
9
Step 5. ANALYSIS
Now let us analyze the selected samples. Select the Analysis windows (Step number 5). First you
see a histogram showing the distribution among the three working ports we selected.
Select the button “Pie” (Pie chart) and you get the percentage of the 3 ports. Select “Copy picture”.
Now you are able to “paste” the picture obtained wherever you choose. For example, Figure 12,
below, was inserted in this way.
Figure 12: A pie chart taken with the “copy picture” button and then pasted in Word.
Now let us select another variable from the drop-down list. For example “Age 12”. Press the
“Histogram” button. You should find the possibility to customize your graph with the selection of
the minimum, the maximum and the width. Type 10 as a tick and “Test” as Title. Select “Apply
changes” and you should get a window like the following.
Figure 13: A customized histogram
10
Step 6. BROWSE
Now let’s move on to step number 6: Browsing our selected data. You will find a window with a
grid showing your data. Each row is a sample. Each column is a question. The cells are the answers
given to a question by a sample. When multiple answers are possible only the first one is given in
the grid. To sort by the value of a single answer click on the column (question) header. So, for
example, to sort by age click on the Age 12 column header (with the grey background).
Figure 14: The Browse option
Step 7. EXPORT
Finally select the last step (number 7 “Export”). From here you can print the empty forms for your
questionnaire, a summary report or the filled forms. Both summary report and filled forms are from
your selected samples (step number 4). Please note how the first time you ask for a printout of an
empty form it can take several minutes. As long as the section is not edited the other times will be
much faster because the same saved form will be shown.
Footnotes and header of the pages can be customized using the report1, report2, report3 word
models used by AdriaMed.
To export data to excel select the Export XLS button.
11
Figure 15: Export
Data can be exported using the following two options:
•
•
Also including less important questions (the “only selected indicators” check box).
Showing only the first selected choice in the multiple answer type of questions. For example
there is one question (Titled “Things to know”) asking the more important things to be
known by a young fisherman. The choice can be more than one from several possibilities
(Fiscal rules, Credit, Bioscience...). The export can be done showing only the first selection
or showing each possibility as a Boolean (yes/no) value. Try this option to see the
correspondent excel file.
12