1
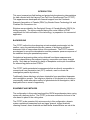
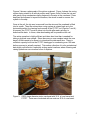
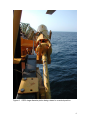
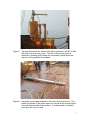
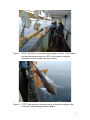
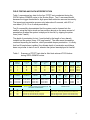
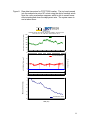
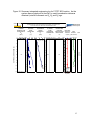
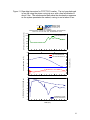
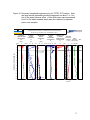
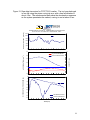
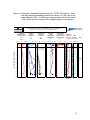
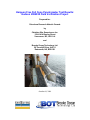
Harpoon Free Fall Cone Penetrometer Test Results:
Hudson 2004030 Field Verification Project
Prepared for:
Petroleum Research Atlantic Canada
by
Christian Situ Geosciences Inc.
1204-1414 Barclay Street
Vancouver, BC, V6G 1J4
and
Brooke Ocean Technology Ltd.
50 Thornhill Drive, Unit 11
Dartmouth, NS, B3B 1S1
October 06, 2004
INTRODUCTION
This report summarizes field testing and geotechnical engineering interpretations
for data collected with the Harpoon Free Fall Cone Penetrometer Test (FFCPT).
This apparatus was developed with financial support from the Petroleum
Research Association of Canada (PRAC) by Brooke Ocean Technology Ltd. and
Christian Situ Geoscience Inc.
Shiptime was provided by the Geological Survey of Canada Atlantic (GSCA) for
testing purposes. The tests conducted during this cruise fulfilled a PRAC
requirement for field verification of the technology, in preparation for commercial
application.
BACKGROUND
The FFCPT method involves dropping an instrumented penetrometer into the
seafloor, using its gravitational mass as a means of developing sufficient
downward force to cause shear failure of the sediments. The FFCPT sensors
are designed to record the decceleration and the porewater pressure response of
the sediment during the penetration process.
Geotechnical engineering data can be obtained from these measurements,
useful in characterizing the sediment layering, composition and shear strength
profile. Such data are required for design of deepwater suction pile foundations
for tethered leg platforms and FPSO’s.
The FFCPT yields geotechnical measurements that are directly comparable to
conventional cone penetration test (CPT) methods, used in current site
investigation practice by industry.
Traditionally, these data have only been obtainable from specialized deepwater
site investigation vessels. The long term objective of this project is to develop a
commercially viable alternative method of geotechnical site investigation, that is
deployable from a vessel of opportunity.
EQUIPMENT AND METHODS
The configuration in this project employed the GSCA large-diameter piston coring
system as a delivery device. The FFCPT probe was mounted on the end of the
core barrel in place of the cutting shoe.
The FFCPT probe operates fully autonomously in this configuration, wherein
system operational parameters such as trigger channel, trigger threshold,
rearming channel, rearm threshold and data buffer characteristics are set at the
1
time of probe activation. The penetrometer is mounted on the end of the piston
core barrel after the internal computer has been given a set of preset trigger
thresholds and test parameters. Figure 1 shows two photographs of the
instrument (a) on the bench being configured for testing and (b) being mounted
on the core barrel, which is held horizontally at the ship’s rail.
Figure 1a. Setting up the FFCPT on the bench in the forward lab onboard CCG
Hudson during the July 2004 GSCA cruise to the Scotian Slope.
Figure 1b. Mounting the FFCPT on the end of the GSCA large diameter piston
corer at the rail, in preparation for deployment.
2
The probe houses electronics and hydraulic systems for sensing water pressure
around the tip during penetration (dynamic porewater pressure), hydrostatic
pressure at the top of the instrument (open to the water column), optical
backscatter at a location just behind the conical point (mudline detector), as well
as acceleration over 3 ranges (+/- 2g, +/- 5g, +/- 50g).
Data is captured into two files after each trigger event. The system is activated
to capture data initially into a low speed (25 Hz) buffer file. This file is later used
to check calibration constants for the Tail Pressure gage. Once the system
senses that the preset trigger condition has been met, it also begins logging data
into a high speed (2 kHz) buffer. After the buffer is full (maximum duration of
20.925 sec) the system switches back to low speed and checks to see if it should
rearm itself for another high speed data capture. Once the rearm condition is
met, it will go into a standby mode, awaiting another trigger event.
Triggering can be done off any of the channels, at any signal level. Similarly,
rearming can be done from any channel, at any signal level. Ideally the system
should be set so that it always remains armed for data capture following any
trigger events.
The data interpretation is done within custom FFCPT View software. Signal
conditioning is done at this time. Each trigger event creates a set of datafiles,
stored in Flash memory within the FFCPT probe. Upon recovery, the datafiles
are offloaded using Windows HyperTerminal software to the host computer for
processing, interpretation and hardcopy output.
Two methods of deployment were used. For the first two stations (001 and 005)
the system was lowered into the seabed on the winch, at maximum payout
speed. However the data indicated that the dynamic strength profile of the
sediment was not high enough to substantially decelerate the corer, especially
near the mudline. The penetration ended when the corehead impacted the
mudline, indicating that more core barrels should have been mounted. The last
two tests (stations 013 and 015) were carried out by tripping the corer from a free
fall height of between 2.4 and 4.0 m, using the pilot gravity corer as a trip weight.
The resulting test data were of much higher quality and can be put through the
full FFCPT analysis.
A settling period of 45 seconds was allowed after impact, to ensure that the
datafiles had been written to the Flash card and the probe was rearmed. Two
pullout events were recorded (stations 0005 and 013), giving useful data on the
sediment suction behaviour. Capturing pullout events is not an objective of the
test however. Figures 2a and 2b show photographs of the FFCPT readied for
deployment.
3
Figure 2a. FFCPT Mounted on the end of the GSCA large diameter piston corer
at the rail, in preparation for lowering.
Figure 2b. FFCPT on core barrel, ready for lowering.
4
Figures 3 shows a photograph of the piston corehead. Figure 4 shows the coring
system being rotated to a vertical position and Figures 5 and 6 show the trip arm
and gravity corer mechanisms being fastened to the wire at the corehead. Once
deployed and allowed to impact the seafloor, the winch is used to recover the
system to the ship.
Once at the rail, the trip arm is removed from the wire and the corehead is lifted
into its cradle. Then the entire piston coring system is rotated back up to the
horizontal position for cleaning and removal of the FFCPT tool (Figures 7 and 8 ).
At present, the FFCPT must be taken into the lab after each recovery to
download the data. In future, data downloading will be possible at the rail.
The entire operation is highly efficient and takes less time than is needed for
taking a physical core sample. Since there are no core samples inside the core
barrel, all that needs to be done is to download the data each time. There is
sufficient capacity built into the FFCPT datalogger for conducting over 100 tests
before recovery is actually required. This makes collection of in situ geotechnical
data highly cost effective, especially at deep water locations, where lowering and
raising operations can consume hours of shiptime.
Figure 3. GSCA large diameter piston corehead with 30 ft. of core barrel and
FFCPT. Tests were conducted with as much as 50 ft of core barrel.
5
Figure 4. GSCA large diameter piston being rotated to a vertical position.
6
Figure 5. Trip arm attached to the wire and the piston corehead, with 8 ft of free
fall (note loop in recovery wire). The end of the recovery wire is
attached to a sliding piston inside the core barrel, which allows the
system to fully penetrate the seabed.
Figure 6. 3m gravity corer being attached to the end of the trip arm wire. This
allows for release of the piston corer into free fall at the correct height
(free fall distance) above the seafloor. A small sample is collected
each time this corer is used.
7
Figure 7. FFCPT and 50 ft. of core barrel being raised to the rail. CCG Hudson
can accommodate as much as 100 ft. of core barrel, using the
dedicated monorail system (see top of photo).
Figure 8. FFCPT after recovery, showing mud up to the split coupling on the
core barrel, before being pressure-washed.
8
FIELD TESTING AND DATA INTERPRETATION
Table 1 summarizes key data for the four FFCPT tests conducted during the
GSCA Hudson 2004030 cruise to the Scotian Slope. Test 1 was unsuccessful
because the trigger thresholds for high speed data collection were set incorrectly.
The impact and penetration process only takes about 3 seconds, with 50 ft of
core barrel (12 to 13 m of actual penetration).
Test 2 successfully demonstrated that the system can be lowered into the
seafloor using the ship’s winch and can achieve almost as the same amount of
penetration as when the system is deployed in free fall, by tripping the piston
corer (tests 3 and 4).
The depth of penetration for test 1 was limited by the length of core barrels
installed on the system (three 10 ft long barrels). The data record showed the
corehead impacting the seafloor, which prevented deeper penetration. It is likely
that had 5 barrels been installed, the ultimate depth of penetration would have
been very similar to tests 3 and 4, wherein the system was deployed in free fall.
Table 1. Summary of FFCPT test data for field trials onboard CCG Hudson
during GSCA 2004030 cruise.
SYSTEM CONFIGURATION
STA
NO. OF
NO.
BARRELS
RIGGED
001
005
013
015
3
3
5
5
DEPLOYMENT DETAILS
STA
LATITUDE
NO.
AT IMPACT
001
005
013
015
44 41.8696N
42 50.0880N
42 33.0707N
42 44.2752N
TEST RESULT SUMMARY
STA
APPARENT
NO.
PENETRATION
(m)
001
10.4
005
10.4
013
13.2
015
12.0
PINGER
TO CORER
(m)
CORER
LENGTH
(m)
PINGER HT OFF
BOT. @ IMPACT
(m)
TRIGGER
CHANNEL
TRIGGER
LEVEL
REARM
DELAY
(sec)
REARM
CHANNEL
REARM
LEVEL
30
30
NA
NA
11.9
11.9
18.0
18.0
42
42
NA
NA
Mudline
Diff Pr.
Diff Pr.
Diff Pr.
1,600 mV
3m
5m
5m
10
5
5
5
MUDLINE
TAIL PR.
TAIL PR.
TAIL PR.
1,300
mV
2,000 m
3,000 m
3,000 m
LONGITUDE
AT IMPACT
GEOGRAPHIC
REGION
LOCATION
NAME
JULIAN
DAY
PEN
TIME
54 27.2130W
62 03.1020W
62 28.6169W
62 05.0831W
Grand Banks
Scotian Slope
Scotian Slope
Scotian Slope
St. Pierre Slope
Mohican Channel
Torbrook Block
Torbrook Block
193
196
198
199
1006
2009
1907
1955
WATER
DEPTH
(m)
1,013
894
1,581
1,200
WINCH
SPEED
(m/min)
97
97
TRIPPED
TRIPPED
FREE
FALL
(m)
NA
NA
2.4
4.0
VISUAL SEDIMENT DESCRIPTION FROM MUD ON
OUTSIDE OF CORE BARRELS
Very soft to soft silty clay, olive green
Very soft to soft silty clay, olive green
Firm over very soft to soft silty clay, olive green
Firm over very soft to soft silty clay, olive green
OBSERVATIONS
OBS Rearm level set too low, probe triggered at rail, didn’t rearm
Heave on ACC, DPT during penetration, try free falling corer
Some false trigger events, good test, not at terminal velocity
Some false trigger events, good test. not at terminal velocity
9
Data Interpretation
After the datafiles were transferred to the host computer, they were processed
and displayed within FFCPT View software (Version 3.1). This custom interface
was written for analyzing FFCPT data collected with previous FFCPT models and
is of limited usefulness in reviewing and displaying data collected with the piston
coring FFCPT equipment due to system configuration variances. However, flat
ascii files were created after signal conditioning was completed, then the
geotechnical analysis and sediment behaviour interpretation was completed
using spreadsheet methods.
The interpretation of FFCPT data involves determining the descent velocity
immediately prior to impact, then selecting the portion of the dataset containing
the FFCPT penetration into the sediment, thereafter one of the acceleration
channels is chosen and for forward integration against time, which yields the
time-velocity curve (after impact). The integration process typically results in a
non-zero residual velocity value, which is then used to adjust the impact velocity
so that the at-rest velocity (integration residual) is reduced to zero. The velocitytime curve is then itself integrated, yielding the distance versus time curve.
The depth at impact, as determined from the ship’s echosounder, defines the
zero baseline for the Tail Pressure channel. The tip differential pressure is
already compensated for hydrostatic pressure since its back side is open to the
water column (inside the core barrel), so it is a direct high resolution
measurement of the excess dynamic porewater pressure response to FFCPT
penetration. Typically in very soft to soft clay, the dynamic porewater pressure
response is in excess of hydrostatic, due to the low permeability of sediment
surrounding the probe.
The undrained shear strength is calculated from the dynamic penetration
resistance, which is obtained from Newton’s Law (F=mA). A second, fully
independent estimate of undrained shear strength is calculated from the dynamic
porewater pressure. Both of these strength calculations utilize published
empirical relationships developed from numerous analyses of static cone
penetration test data.
One long term objective is to develop greater understanding of the relationship
between the CPT cone and pore pressure factors used in evaluating undrained
shear strength, as it applies to tests conducted at high rates of penetration, as is
the case with the FFCPT. To date, there seems to be very close agreement
between the various cone penetrometers, especially with respect to the
porewater pressure prediction of undrained shear strength.
It is also possible to calculate a continuous profile of sediment type, by plotting
FFCPT analysis parameters (excess pore pressure ratio and normalized dynamic
penetration resistance) on a CPT classification chart, commonly known as a Bq –
10
Qn chart. Data from each test are plotted and each data point is assigned a
numeric code, according to which region, or Sediment Behaviour Type, it falls
into. This chart has been developed based on thousands of CPT soundings and
sampled boreholes for which the soil classification was available.
More experience is needed with FFCPT data before it can be concluded that the
chart is also valid at high penetration rates. To date, there appears to be close
agreement between FFCPT SBT predictions and actual sediment type based on
grain size testing.
Dynamic Penetration Resistance
The FFCPT probe was mounted on the end of the piston corer and allowed to
free fall into the seabed, to test the acceleration-based data interpretation
method. Normally the FFCPT falls a considerable distance through the water
column before impacting the seafloor and thereby achieves a constant terminal
velocity, at which time by definition vertical accelerations are zero. This zero
acceleration is equivalent to a free fall condition.
However, with the Harpoon FFCPT configuration, there are large hydrodynamic
drag forces that act on the piston coring head, which is not very streamlined. In
fact, it appears that at the time of impact, the gravitational forces transmitted into
the sediment were about half what they would have been had there been no
hydrodynamic drag on the system. This is illustrated in the raw data times series
depicted in Figures X and X, wherein the acceleration at the time of impact was
about 50% less than 10 m/s2 (or 1g). This indicates that the downward
gravitational forces are severely limited by hydrodynamic form drag on the
corehead. A quick calculation indicates that the drag coefficient for the corehead
is at best, 0.5 at the time of impact.
Taking into account an acceleration baseline at impact that is less than 1g, a
slight modification to the data analysis was required. The algorithm for
integrating the area beneath the acceleration-time curve used a straight-line
varying baseline, drawn between the measured acceleration at impact and that
when the system had come to rest (by definition 1g). This adjustment in the
analysis consistently yielded an accurate calculation of the total depth of
penetration, which was compared to measured mud marks on the outside of the
piston core barrel.
The calculation of dynamic penetration resistance was likewise modified to shift
the starting acceleration to be equal to 1g, as otherwise negative forces result
from the data processing. An equivalent interpretation would also work, wherein
all acceleration data are referenced to 0g instead of 1g. For the purpose of this
testing, the former adjustment was made.
11
Dynamic Porewater Pressure Response
The dynamic tip pressure response measured just behind the probe tip shows a
deceleration effect in tests at locations FFCPT-013 and FFCPT-015, somewhat
masking the sediment-induced excess porewater pressure response. This effect
is due to water hammer surging on the negative side of the differential tip
pressure transducer diaphragm, which occurs during free fall penetration.
The dynamic pressure response is much more linear when the system is lowered
into the sediment on the winch, rather than allowing it to free fall into the
sediment. This is more typical of cone penetration test results, wherein
soundings have consistently shown a gradual increase in shear strength with
depth. The dynamic porewater pressure response is directly related to the
undrained shear strength in clays, according to extensive testing over 25 years of
CPT testing practice.
It may be possible to significantly reduce the water hammer effect during free fall
penetration, by installing a water surge chamber on the negative side of the
differential tip pressure transducer. This would hopefully result in datasets that
more accurately reflect the in situ shear strength profile. Replacement of the
differential gage with an absolute gage would not be feasible, as the reduction in
sensor sensitivity would have a degrading effect on the pressure measurement
data.
Figures 9 through 16 show interpreted results for the FFCPT tests summarized in
Table 1, in graphical format. The raw data time series are shown, along with
interpreted geotechnical engineering logs and sediment classification charts.
Figures 9 and 10 correspond to a test where the coring system was winched
(lowered) into the sediment column. The subsequent figures 11 through 16 show
results from the following two tests which were done by free falling the coring
system into the seafloor.
The system operated well and had no electronic or mechanical problems. It was
concluded that the best trigger method was to use the tip differential pore
pressure channel, set to a trigger threshold of +5 m in head. Rearming was best
done using the Tail Pressure (water depth) channel, set to a value much greater
than the maximum water depth, which ensured that the system rearmed itself
after all trigger events. The maximum operating range of the equipment is 3,400
m however the maximum water depth encountered was only 1,581 m.
In general the sites tested comprised soft normally consolidated silty clays to
clays, in some cases there was a stiff layer present at the seafloor, extending to
several metres in thickness. The differential porewater pressure measurements
were used to evaluate the undrained shear strength profile. The dynamic
penetration resistance profile was calculated from the vertical acceleration data
12
and was also used to predict the undrained strength profile. Sediment Behaviour
Type (SBT) was predicted from CPT classification charts, based on the
combined dynamic penetration resistance and dynamic pore pressure response.
13
Raw data time series for FFCPT-005 location. The tool was lowered
into the seabed at a rate of 97 m/min using the ship’s foredeck winch.
Note the cyclic acceleration response, which is due to vessel heave
effects transmitted down the deployment wire. The system came to
rest at about 8 sec.
Chris ian Situ
OPTICAL OUTPUT (counts)
GSC ATLANTIC
HUDSON 2004030, STATION 005, MOHICAN CHANNEL, SCOTIAN SLOPE
FFCPT-005 DAY 196 TIME: 2009 WATER DEPTH: 894 m
1200
MUDLINE DETECTOR
1000
800
600
400
200
0
0
1
2
3
4
5
6
7
8
20
-15
15
-10
10
-5
5
0
0
VELOCITY (m/s)
2
ACCELERATION (m/s )
2g ACCELEROMETER
5
0
1
2
3
4
5
6
7
8
0
PRESSURE HEAD (m)
Figure 9
5
10
15
20
25
DIFFERENTIAL GAGE
30
0
1
2
3
4
5
6
7
8
TIME (sec)
14
Figure 10. Summary interpreted engineering log for FFCPT-005 location. As the
system was not deployed in free fall, no useful acceleration data was
obtained (note NA comments on Qd, Bq and Qn logs.
Chris ian Situ
GSC ATLANTIC
HUDSON 2004030, STATION 005, MOHICAN CHANNEL, SCOTIAN SLOPE
FFCPT-005 DAY 196 TIME: 2009 WATER DEPTH: 894 m
DYNAMIC
PENETRATION
RESISTANCE
Qd
(kPa)
0
0
100
200
300 0
DYNAMIC
PORE
PRESSURE
Ud
(m)
10
20
UNDRAINED
SHEAR
STRENGTH
Su
(kPa)
30 0
10
20
DYNAMIC
PORE
PRESSURE
PARAMETER
Bq
NORMALIZED
DYNAMIC
PENETRATION
RESISTANCE
Qn
30-1.6 -0.8 0.0 0.8 1.6 0
200
DESCENT
VELOCITY
OBS
& ACCEL. OUTPUT
SBT
V (m/s) (A/D counts)
400 0
-5
-10 0
500 1000
ρs = 17 kN/m3
1
Su / P' = 0.3
DEPTH BELOW SEABED (m)
2
3
4
5
6
NA
NA
VERY SOFT
TO SOFT
SILTY CLAY
TO
CLAYEY SILT
NA
7
8
9
10
Uo
11
12
MAXIMUM DEPTH: 10.4 m
N.C.
Line
COREHEAD
ARRESTED
PENETRATION
PAST THIS
DEPTH
0
10
2
A (m/s )
20
15
Figure 11. Raw data time series for FFCPT-013 location. The tool was deployed
in free fall using the piston coring trip arm, with a free fall distance of
about 2.4m. The accelerometer data show the deceleration response
as the system penetrates the seabed, coming to rest at about 3 sec.
Chris ian Situ
1200
MUDLINE DETECTOR
1000
800
600
400
200
0
0
1
2
3
50
-10
50g ACCELEROMETER
CALCULATED VELOCITY
ACCELERATION (m/s2)
40
30
-5
20
10
0
VELOCITY (m/s)
OPTICAL OUTPUT (counts)
GSC ATLANTIC
HUDSON 2004030, STATION 013, TORBROOK BLOCK, SCOTIAN SLOPE
FFCPT-013 DAY 198 TIME: 1907 WATER DEPTH: 1581 m
0
-10
5
0
1
2
3
DIFFERENTIAL PRESSURE (m)
0
5
10
15
20
25
30
DIFFERENTIAL GAGE
CALCULATED DEPTH
35
40
0
1
2
3
TIME (sec)
16
Figure 12. Summary interpreted engineering log for FFCPT-013 location. Note
the large excess porewater pressure response from about 7 to 11m,
due to the water hammer effect. A thin stiffer layer was encountered
from 0 to 2m below seabed, which was also observed in adjacent
piston core samples.
Chris ian Situ
GSC ATLANTIC
HUDSON 2004030, STATION 013, TORBROOK BLOCK, SCOTIAN SLOPE
FFCPT-013 DAY 198 TIME: 1907 WATER DEPTH: 1581 m
DYNAMIC
PENETRATION
RESISTANCE
Qd
(kPa)
-1000
0
0
1000 0
DYNAMIC
PORE
PRESSURE
Ud
(m)
10
20
UNDRAINED
SHEAR
STRENGTH
Su
(kPa)
30 0
20
40
DYNAMIC
PORE
PRESSURE
PARAMETER
Bq
NORMALIZED
DYNAMIC
PENETRATION
RESISTANCE
Qn
60-1.6 -0.8 0.0 0.8 1.6 0
50
DESCENT
VELOCITY
OBS
& ACCEL. OUTPUT
SBT
V (m/s) (A/D counts)
100 0
-5
-10 0
500 1000
CEMENTED
FIRM
SILTY CLAY
1
2
ρs = 17 kN/m3
DEPTH BELOW SEABED (m)
3
Su / P' = 0.3
4
Ud, corr
5
VERY SOFT
TO SOFT
SILTY CLAY
TO
CLAYEY SILT
6
7
8
9
10
11
12
13
Uo
MAXIMUM DEPTH: 12.3 m
Ud
N.C. Line
-10 0
10 20
2
A (m/s )
17
Figure 13. Raw data time series for FFCPT-015 location. The tool was deployed
in free fall using the piston coring trip arm, with a free fall distance of
about 4.0m. The accelerometer data show the deceleration response
as the system penetrates the seabed, coming to rest at about 3 sec.
Chris ian Situ
OPTICAL OUTPUT (counts)
GSC ATLANTIC
HUDSON 2004030, STATION 015, TORBROOK BLOCK, SCOTIAN SLOPE
FFCPT-015 DAY 199 TIME: 1955 WATER DEPTH: 1200 m
1200
MUDLINE DETECTOR
1000
800
600
400
200
0
0
1
2
3
50
-10
50 g ACCELEROMETER
CALCULATED VELOCITY
30
-5
20
10
0
VELOCITY (m/s)
2
ACCELERATION (m/s )
40
0
-10
5
0
1
2
3
DIFFERENTIAL PRESSURE (m)
0
5
10
15
20
25
30
DIFFERENTIAL GAGE
CALCULATED DEPTH
35
40
0
1
2
3
TIME (sec)
18
Figure 14. Summary interpreted engineering log for FFCPT-015 location. Note
the large excess porewater pressure from about 5 to 10m, due to the
water hammer effect. A stiffer layer was encountered from 0 to about
1.5m, which was also observed in an adjacent piston core sample.
Chris ian Situ
GSC ATLANTIC
HUDSON 2004030, STATION 015, TORBROOK BLOCK, SCOTIAN SLOPE
FFCPT-015 DAY 199 TIME: 1955 WATER DEPTH: 1200 m
DYNAMIC
PENETRATION
RESISTANCE
Qd
(kPa)
-1000
0
0
1000 0
DYNAMIC
PORE
PRESSURE
Ud
(m)
10
20
UNDRAINED
SHEAR
STRENGTH
Su
(kPa)
30 0
20
40
DYNAMIC
PORE
PRESSURE
PARAMETER
Bq
NORMALIZED
DYNAMIC
PENETRATION
RESISTANCE
Qn
60-1.6 -0.8 0.0 0.8 1.6 0
50
DESCENT
VELOCITY
OBS
& ACCEL. OUTPUT
SBT
V (m/s) (A/D counts)
100 0
-5
-10 0
500 1000
CEMENTED
FIRM
SILTY CLAY
1
ρs = 17 kN/m3
2
Su / P' = 0.3
DEPTH BELOW SEABED (m)
3
4
5
VERY SOFT
TO SOFT
SILTY CLAY
TO
CLAYEY SILT
6
7
8
Ud,corr
9
10
11
12
13
Uo
MAXIMUM DEPTH: 11.75 m
Ud
N.C. Line
-10 0
10 20
2
A (m/s )
19
DISCUSSION
The key findings of the field testing are summarized below in Table 2. Overall,
the equipment functioned as designed, was easily deployed and recovered and
produced useful geotechnical datasets. Some further work is required to improve
the quality of the data and to compare it to shear strength test results measured
in high quality core samples (still in progress).
Table 2. Summary of key testing objectives and findings, along with suggested
actions to remedy perceived problems, either with the mechanical and
electronic equipment, or with the method of data interpretation.
Mechanical Issues
System handling
Corer rigging
Split FFCPT coupler
Split coupler fasteners
Saturating hydraulic lines
Saturating filter ring
User manual
Probe diameter
Electronics Issues
Battery pack
Mounting split coupler
on core barrel very
difficult in rough seas;
significant pinch
hazard to fingers
To obtain free fall, it
was necessary to
attach recovery to top
half of split piston
inside core barrel
Robust
Difficult to clean mud
out of cap screws
Enerpac hand pump
gage needle seems
prone to jamming
Potential for oil to
drain out of filter
during deployment
Good but needs
improvement
Large enough to
prevent mud from
contacting core
barrel; friction on core
barrel is minimized
Install centering ring on top
end cap, to guide FFCPT
onto core barrel; fabricate
custom web sling for chain
falls to support FFCPT at rail
Fabricate custom opencentre piston for FFCPT
work, which allows more
water flow and fits core
barrel with no core liner
Need external safety wire
attached to FFCPT housing
in case core barrel breaks
Portable high pressure
washer for cleaning off mud
Drill out pressure port on dial
gage, viscous mineral oil not
allowing pressure to release
Use viscous silicone oil
instead of mineral oil
Update as required; develop
Job Safety Awareness
procedures for all activities
No action required
Duration of battery
Bench test to check battery
life not known, battery life
20
Sleep feature
Assembly - disassembly
Data transfer
pack easily changed
Serial sleep cable
cannot be used inside
core barrel if piston is
in use; probe has to
be activated on
bench, assembled
and deployed before
battery life dies
Serial connection
inside top end cap
easily pulled apart
during reassembly
No communication
cable inside core
barrel when piston in
use
Data Interpretation Issues
Mudline detector
High frequency noise
on Mudline Detector
signal
Accelerometers
Movement of piston
inside core barrel
produces highfrequency noise on
accelerometers
Terminal velocity
Not achievable with 4
m of free fall due to
hydrodynamic drag
effect
Differential pressure
Dominated by water
hammer when
system deployed in
free fall
FFCPT Interpretation
Not properly
Software
configured for
Harpoon system
Install a manual switch on
FFCPT probe to activate and
put electronics to sleep
Solder wires to end cap
connector pins
Carry probe into lab for data
transfer; fabricate longer
deck cable for connecting to
probe at rail
Evaluate electronics on
bench; hardware
modification as required
Apply high-frequency filter to
acceleration data
Increase free fall to 10m;
streamline corehead
Install air surge chamber on
negative side of differential
pressure gage
Modified FFCPT View
software to produce special
Harpoon View version
REFERENCES
Robertson, P.K. 1990. Soil classification using the cone penetration test,
Canadian Geotechnical Journal, 27(1), pp. 151-158.
21
APPENDIX A
HUDSON 2004030 FFCPT SUMMARY LOG
STATION FFCPT-001
Datafile: HUD0100.b01 / Day: 193 / Time: 1006 GMT / Site: St. Pierre Slope
The FFCPT was configured to trigger on the Mudline Detector at a level of 1,600
mV and rearm on the Mudline Detector at a level of 1,300 mV. The equipment
was winched into the bottom at a speed of 97 m/s and penetrated to the
corehead (10.4 m). There was no damage.
The datalogger recorded one datafile (HUD0100.b01), which was created with
the system still at the rail. The OBS signal levels in the datafile never fell below
1,343 mV, so the probe did not rearm after being triggered at the rail. In future
the rearm level should be set as high as possible, so that it will always rearm.
Testing on the bench showed that the response of the Mudline sensor is
dependent on the reflectivity of the material near the OBS port. White paper and
orange plastic were found to induce triggering (ie. signals exceeded the trigger
threshold) however dark green rubber did not. The signal response of the
detector has a peak in a certain wavelength of light, as indicated by previous
datasets sometimes showing signals falling off to the baseline with penetration
into darker-coloured sediment.
It was concluded that the Mudline Detector could not be relied upon to trigger the
probe, as the seafloor sediment colour is often quite dark. Bench testing in the
shop should be done to determine the range of sensitivity of the mudline detector
in various colours of sediment.
The system penetrated soft clay and came to rest with the corehead at the
mudline, so the penetration process was incomplete.
STATION FFCPT-005
Datafile: HUD0504.b01 / Day: 196 / Time: 1935 GMT / Site: Mohican Channel
The FFCPT was configured to trigger on the Tip Differential Pressure at a level of
3 m and rearm on the Tail Pressure at a level of 2,000 m. The equipment was
winched into the bottom at a speed of 97 m/s and penetrated to the corehead
(10.4 m). There was no damage.
22
The datalogger recorded 24 datafiles, some of which were created by false
trigger events during lowering and raising through the water column. Several
data records were obtained recording the impact event (HUD0504.b01), the
system at rest in the seabed (HUD0505.b01 and HUD0506.b01) and the pullout
event (HUD0507.b01). The rearming worked well and ensured the probe
recovered into a ready state after each false trigger event. In future, the trigger
level could be increased to 5 m to prevent false triggering. The data buffer split of
50 / 50 % was also too biased toward the pre-trigger data, in future deployments
using the winch-in method a 20 / 80 split should be used, especially if more core
barrels are mounted.
The pore pressure response was very good however there was some surging
due to vessel heave that was transmitted down the wire. This surging was also
observed on the accelerometer signals, which did not vary much from 1 g until
the corehead impacted the mudline. The weight of the system was carried on the
wire up until that time, indicating that longer penetration was possible had more
core barrels been in place. The system penetrated soft clay and came to rest due
to friction buildup on the core barrels.
The accelerometer signal will likely not be very useful in determining the depth of
penetration, when the system is lowered on the winch in this manner. It may be
advantageous to free fall the system with a longer core barrel, to generate higher
decelerations for integration. However the tip pore pressure data are acceptable.
STATION FFCPT-013
Datafile: HUD01332.b01 / Day: 198 / Time: 1907 GMT / Site: Torbrook Block
The FFCPT was configured to trigger on the Tip Differential Pressure at a level of
3 m and rearm on the Tail Pressure at a level of 3,000 m. The equipment was
rigged like a piston corer using the upper half of the split piston. A free fall
distance of 2.4 m was used. The safety wire was removed. No water hose was
used inside the core barrel. The system penetrated to 13.2 m. There was no
damage.
The datalogger recorded 41 datafiles, most of which were created by false trigger
events during lowering and raising through the water column. Several data
records were obtained recording the impact event (HUD01332.b01), the system
at rest in the seabed (HUD01333.b01, HUD01334.b01) and the pullout event
(HUD01335.b01, HUD01336.b01, HUD01337.b01). The system was triggered at
5 m on the differential gage and rearmed at 3000 m on Tail Pressure. A 50 / 50
% pre-trigger / post-trigger data buffer split exactly the impact event.
The pore pressure response was very good with no vessel heave effect during
penetration into the seabed. There was excessive hydrodynamic drag created by
23
the bullnose shape of the corehead, which prevented it from reaching terminal
velocity before impact. Accelerations were slowly increasing toward 0.5g during
the free fall period. The entire penetration through the sediment lasted about 3
sec. The system came to rest in soft clay largely due to friction buildup on the
core barrels. A stiff layer several metres in thickness was noted at the mudline.
STATION FFCPT-015
Datafile: HUD01503.b01 / Day: 199 / Time: 1955 GMT / Site: Torbrook Block
The FFCPT was configured to trigger on the Tip Differential Pressure at a level of
3 m and rearm on the Tail Pressure at a level of 3,000 m. The equipment was
rigged like a piston corer using the upper half of the split piston. A free fall
distance of 2.4 m was used. The safety wire was not used. No water hose was
used inside the core barrel. The system penetrated to 12.0 m. There was no
damage.
The datalogger recorded 14 datafiles, some of which were created by false
trigger events during lowering and raising through the water column. Several
data records were obtained recording the impact event (HUD01503.b01) and
while the system was at rest in the seabed (HUD01504.b01) but none during
pullout. The system was triggered at 5 m on the differential gage and rearmed at
3000 m on Tail Pressure. A 50 / 50 % pre-trigger / post-trigger data buffer split
exactly the impact event.
The pore pressure response was very good with no vessel heave effect during
penetration into the seabed. Excessive hydrodynamic drag created by the
bullnose shape of the corehead again prevented the system from reaching
terminal velocity before impact. Accelerations were slowly increasing toward 0.5g
during the free fall period. The entire penetration through the sediment lasted
about 3 sec. The system came to rest in soft clay largely due to friction buildup
on the core barrels. A stiff layer several metres in thickness was noted at the
mudline.
24