1
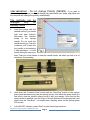
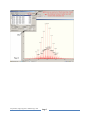
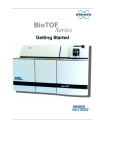
BioToF –USERMANUAL ver. 1 (Feb 2010)
Electro Spray Ionization- Mass Spectrometry (ESI-MS)
Practice Training by Angel Ugrinov
The BioToF machine can be used only by users who have already passed the training and
have their own account to log in.
Call (701 231-5256) or e-mail Angel ([email protected]) to schedule a practice
training.
This short, step by step, illustrated user manual is made to help the new users to perform their
experiment without additional help, but only after they have passed the training.
More detailed user manual provided by Bruker Daltonics is located/placed on the desk next to
the computer in Dunbar 160 (do not remove it from their)
Sample Preparation:
Polar solvents with high volatility are preferable. The best solvents are CH3OH (HPLC),
CH3CN (HPLC), and Water (HPLC). ESI-MS is a very sensitive method and the best
concentration of the solution for small molecules is ~ 4ppm (~ 10 ppm for proteins)
(Appendix A).
Collecting a spectrum:
1.
Log in with your username (the first 3
letters of your first name and the first 3
letters of your last name) and password
and then click the blue “run” button to get
to the main navigation screen.
Optional: Type the name of the project/sample in
Sample ID/note book #. Click the grey “BioTOF”
button to maximize the BioTOF application.
2.
Check the status of the Instrument:
“Standby” or “Operation”. Make sure
that the instrument is set to “Standby”
(Fig.1).
3.
ONLY in Standby, load the desired
method for your experiment (Method/Load Method). Please, use only the methods
which are started with the word “user”. For most of your samples the most
appropriate method will be user-1pass_pos.tofpar (Fig 2).
Prepared by Angel Ugrinov, NDSU Fargo ND
Page 1
VERY IMPORTANT – Do not change Polarity (NEVER). If you want to
observe negative species you should change the method with user-1pass_neg.tofpar and
the computer will change the polarity automatically.
The methods can be
changed
only
on
standby mode
4.
Load the syringe with the
desired solution (you better
start with pure solvent).
Reconnect the injection
tubing to the syringe
needle. Do not touch the
needle as doing it. Push the
connector until it feels like
the needle is encountering
a little resistance - it is the
needle hitting the connector
seat. Push just a little harder to seat the needle inside, but when you feel a lot of
resistance, stop pushing.
5.
Hold down the “Forward Arrow” button and the “Run/Stop” button on the syringe
pump panel simultaneously (see the picture above); this makes the pump inject at a
fast rate to clear the injection tubing and fill it with your sample. Once you see the
spray current to stabilize, you can let go off the two buttons of the syringe pump, and
press once the “Run/Stop”. You should see a flashing arrow on the syringe pump
LCD screen.
6.
In the BioTOF software, press “Start” to start acquiring a spectrum.
Prepared by Angel Ugrinov, NDSU Fargo ND
Page 2
7.
Once you have collected at least 500 scans of your solvent (this is your background),
click “Save” to save the background to disk.
8.
Make sure that the data Path is set to “C:\XMASS”. In the Sample Name field, you
may enter your name, the name of the sample or any name which is convenient for
you. The Experiment No. field will automatically increment to create a unique ID for
every spectrum you save with a particular Sample Name. You should always insert
the characters “.d” into the Experiment ID field to make it easier to open the files in
the DataAnalysis Software. Finally, the Comment fields allow you to enter detailed
information about the spectrum you are saving.
9.
Repeat steps 4-8 with the sample and the sample mixed with internal standard.
Optional: You can run a spectrum of the standard. It can be used as an external standard. The internal standard
is better than external, but some samples are very reactive and cannot be mixed with standards.
The Bruker BioTOF is capable of extremely high mass accuracy (< 5 ppm mass error), but
peak positions must be calibrated against a set of known mass standards in order to
achieve this resolution. In this experiment, you will use PEG or PPG.
PEG stays for: polyethylene glycol, H-(O-CH2-CH2)n-OH
PPG stays for: polypropylene
glycol, H-(O-CHMe-CH2)n-OH
The
PEG/PPG
samples
contain polymer molecules with
a range of well-defined
molecular masses, and set of
multiple peaks is observed.
One example of PEG600 is
shown on Fig.3. Based on your
needs you will use glycols with
different masses, such as
PEG200, PEG400, PEG600,
PPG 725, PPG1000 etc.
PEG 600 in MeOH
Fig. 3
10. After collecting all necessary spectra, minimize BioTof application and click the gray
“DataAnalysis” button to maximize this application. Choose File:Open to navigate to
your folder within the C:\XMASS. Select the file you want to open and click the Open
button.
11. Once the file is open, you can see the labeled peaks and the mass list. For the
sample by itself you can simply print the spectrum and make note of the masses
observed.
12. For the spectra where you mixed your sample with PEG/PPG, you will need
to calibrate (See Appendix B) each one to obtain the accurate mass of your sample.
Prepared by Angel Ugrinov, NDSU Fargo ND
Page 3
Unknown sample:
Make a note of the exact mass of your sample peak. Open Tools/Generate Molecular
Formula and use the exact mass measured to calculate a list of possible molecular
formulas that match the measured mass to within 10 ppm. Remember to use all possible
tools to narrow the list of the possibilities.
Known sample (If you know (have assumption for) the molecular formula of your
sample):
Open Tools/Simulate Pattern and type your formula to simulate the theoretical pattern (do
not forgot to add H+ or Na+ if you have ran neutral molecule which were ionized). Use the
exact mass of your sample peak and its theoretical pattern, and calculate the mass error*.
Mass error < 5 ppm is publishable and confirms that your assumption for molecular
formula is accurate.
*
How to Calculate the mass error?
Mass error =
|Exp. Mass − Theor. Mass|
Exp. Mass
Exp. Mass – experimental mass which you observed after internal calibration (external
only if internal is impossible)
Theor. Mass – the mass from the simulated pattern calculations
Prepared by Angel Ugrinov, NDSU Fargo ND
Page 4
Appendix A: Parts per million (ppm) works as percent by mass, but is more convenient
when there is only a small amount of solute present. PPM is defined as the mass of the
component in solution divided by the total mass of the solution multiplied by 106 (one
million): A solution with a concentration of 1 ppm has 1 gram of substance for every million
grams of solution. Because the density of water is 1 g per mL and we are adding such a
tiny amount of solute, the density of a solution at such a low concentration is
approximately 1 g per mL. Therefore, in general, one ppm implies one milligram of solute
per liter of solution. Finally, recognize that one percent = 10,000 ppm. Therefore,
something that has a concentration of 300ppm could also be said to have a concentration
of (300 ppm)/ (10,000 ppm/percent) = 0.03% percent by mass.
Density of CH3OH: 0.791 g/mL at 25oC
Density of CH3CN: 0.786 g/mL at 25oC
Prepared by Angel Ugrinov, NDSU Fargo ND
Page 5
Appendix B: Internal and External Calibration
Internal calibration means that you run your sample and one standard together. The
internal calibration is impossible if your compound reacts with all possible standards. The
external calibration is necessary only if the internal is impossible. The internal calibration
is much more accurate than the external.
To make internal calibration:
1.
In analysis list window click on the
sample, which you want to calibrate, to
select it.
2.
Click Calibrate/Internal … (see Fig.5 )
3.
Click “Select list …” button to select your
Calibration list. (The default list is for
positive spectra of any PEG standard,
therefore if you are using PEG you
should skip step 3 - 5).
4.
On the new window click the drop menu
called “Calibration List:” (see Fig. 6 and
7) and select the desired standard for
example PPG with Na (all our standards
are with Na).
5.
After clicking OK (Fig. 6) you will return in
to the main Calibration window
6.
Click “Auto Search” button. The software
is now searching for observed picks of
the standard in the spectrum which you
ran. The picks are listed in the window
together with the observed errors (see
Fig. 8). All picks with error less than 5
ppm are good to use. If one or more picks
have error bigger than 5 select the one
with the biggest error and remove it. After
that check the errors again. Remove as
many picks as necessary to make the
rest of the picks with errors less than 5
ppm. At the end you should have a
minimum of 3 picks (more is better) with
errors less than 5 ppm (see Fig. 8).
7.
Click “Recalibrate”
calibration is done.
button.
Prepared by Angel Ugrinov, NDSU Fargo ND
Internal
Fig. 7
Page 6
Prepared by Angel Ugrinov, NDSU Fargo ND
Page 7