1
®
Intel UEFI
Development Kit
Debugger Tool
Configuration and Setup Guide
Version 1.10
January 6, 2014
ii
INFORMATION IN THIS DOCUMENT IS PROVIDED IN CONNECTION WITH INTEL® PRODUCTS. NO LICENSE,
EXPRESS OR IMPLIED, BY ESTOPPEL OR OTHERWISE, TO ANY INTELLECTUAL PROPERTY RIGHTS IS GRANTED
BY THIS DOCUMENT. EXCEPT AS PROVIDED IN INTEL’S TERMS AND CONDITIONS OF SALE FOR SUCH PRODUCTS, INTEL ASSUMES NO LIABILITY WHATSOEVER, AND INTEL
DISCLAIMS ANY EXPRESS OR IMPLIED WARRANTY RELATING TO SALE AND/OR USE OF INTEL PRODUCTS INCLUDING LIABILITY OR WARRANTIES RELATING TO
FITNESS FOR A PARTICULAR PURPOSE, MERCHANTABILITY, OR INFRINGEMENT OF ANY PATENT, COPYRIGHT
OR OTHER INTELLECTUAL PROPERTY RIGHT. Intel products are not intended for use in medical, life saving,
or life sustaining applications.
Intel may make changes to specifications and product descriptions at any time, without notice.
Designers must not rely on the absence or characteristics of any features or instructions marked “reserved”
or “undefined.” Intel reserves these for future definition and shall have no responsibility whatsoever for conflicts
or incompatibilities arising from future changes to them.
The Intel® UEFI Development Kit Debugger Tool may contain design defects or errors known as errata which may cause the product to deviate from published
specifications. Current characterized errata are available on request.
Contact your local Intel sales office or your distributor to obtain the latest specifications and before placing your product order.
Intel®, Intel® UEFI Development Kit Debugger Tool, Intel® UDK Debugger Tool, and the Intel® logo are trademarks
or registered trademarks of Intel® Corporation or its subsidiaries in the United States and other countries.
Other names and brands may be claimed as the property of others.
Copyright© 2012 - 2014, Intel Corporation. All rights reserved.
iii
Contents
1
Configuration Overview ............................................................................................ 1
1.1
1.1.1
Configuration and Build ................................................................. 1
1.1.2
Windows .............................................................................................. 1
1.1.3
Linux ..................................................................................................... 1
1.1.4
Debugging Tips and Appendix .................................................... 1
1.2
Tool Introduction ............................................................................................. 2
1.3
Configuration ..................................................................................................... 2
1.4
2
Document Purpose and Organization ...................................................... 1
1.3.1
Supported platforms ....................................................................... 2
1.3.2
Host and target configurations ................................................... 3
1.3.3
Target configuration........................................................................ 4
1.3.4
Connection between host and target machines ................... 6
OVMF platform and the debug process ................................................... 6
Build the Firmware Image ........................................................................................ 7
2.1
2.2
iv
Introduction ....................................................................................................... 7
2.1.1
Linux Platforms ................................................................................. 7
2.1.2
Windows Platforms .......................................................................... 7
Modify the configuration files for the firmware used by the target
machine ............................................................................................................... 7
2.2.1
Select the appropriate libraries .................................................. 8
2.2.2
Turn debugging on or off ............................................................ 10
2.2.3
Configure a serial port for debug usage ............................... 11
2.2.4
Configure the USB debug port .................................................. 13
2.2.5
Additional configuration requirements................................... 15
3
4
2.2.6
Update the CPU driver on ECP-based platforms ................ 17
2.2.7
Build the image and update flash memory before debugging
source-level code ........................................................................... 19
Setup the Windows Debug Environment .......................................................... 21
3.1
Introduction ..................................................................................................... 21
3.2
Install the Windows Debugger on HOST .............................................. 22
3.3
Install the Intel Debugger Tool on HOST ............................................. 22
3.4
Connect HOST and TARGET....................................................................... 22
Use the Debug Solution on a Windows Platform .......................................... 25
4.1
Introduction ..................................................................................................... 25
4.2
Supported features ....................................................................................... 25
4.3
General debug flow ....................................................................................... 25
4.4
4.3.1
Start a WinDbg debug session.................................................. 26
4.3.2
Start a WinDbg session using late attach ............................ 28
4.3.3
End the WinDbg session .............................................................. 29
Basic WinDbg debugging operations...................................................... 30
4.4.1
5
Known Limitations & Issues for Windows platforms ................................... 35
5.1
6
7
WinDbg extension commands ................................................... 31
Known limitations .......................................................................................... 35
Setup the Linux Debug Environment.................................................................. 37
6.1
Introduction ..................................................................................................... 37
6.2
Rebuild GDB on HOST.................................................................................. 38
6.3
Install the Intel Debugger Tool on HOST ............................................. 38
6.4
Connect HOST and TARGET....................................................................... 39
Use the Debug Solution on a Linux Platform ................................................. 41
7.1
Introduction ..................................................................................................... 41
7.2
Supported features for Linux platforms ................................................ 41
7.2.1
Unresolved breakpoint setting in Linux ................................. 42
7.3
General debug flow ....................................................................................... 43
7.4
Using the Linux/GDB debug solution ..................................................... 44
7.4.1
Start a GDB debug session ........................................................ 44
v
7.5
7.4.2
Start a GDB debug session using late attach ..................... 45
7.4.3
End the GDB debug session ....................................................... 46
Basic GDB debugging operations ............................................................ 47
7.5.1
8
Known Limitations & Issues for Linux platforms .......................................... 53
8.1
9
GDB extension commands ......................................................... 47
Known limitations .......................................................................................... 53
Debug Tips & Techniques ...................................................................................... 55
9.1
Introduction ..................................................................................................... 55
9.2
Terminal redirection ..................................................................................... 55
9.3
Trace ................................................................................................................... 57
9.4
CPU exception information......................................................................... 57
9.5
Disabling optimization ................................................................................. 58
9.6
Improving debugger productivity ............................................................ 58
9.7
Debugging SEC and PEI code ................................................................... 58
9.8
Debugging DXE code .................................................................................... 59
9.9
Debugging SMM code................................................................................... 59
9.10 Debugging Boot Script code on S3 path .............................................. 59
9.11 Debugging a standalone module loaded in a UEFI shell ............... 60
9.12 Intelligent symbol path searching........................................................... 62
9.13 Source code not available .......................................................................... 63
9.14 Restart the debug session.......................................................................... 64
9.14.1 Shifting to a different architecture mode (32-bit vs. 64-bit)
.............................................................................................................. 64
Appendix A Additional Information.............................................................................................. 65
A.1
TERMS ................................................................................................................ 65
A.2
Conventions used in this document ....................................................... 68
A.3
vi
A.2.1
Nomenclature of CPU architectures ........................................ 68
A.2.2
Pseudo-code conventions ........................................................... 69
A.2.3
Typographic conventions ............................................................ 69
A.2.4
Other conventions ......................................................................... 70
For more information ................................................................................... 70
vii
Tables
Table 1
Library instances by module type ....................................................................... 8
Table 2
Library instances by module type ....................................................................... 9
Table 3
Library instances by module type ....................................................................... 9
Table 4
Library instances by cable connection................................................................ 9
Table 5
Bit layout for an example PCD .......................................................................... 13
Figures
Figure 1 Cable connection between the target and host machine .................................. 3
Figure 2 Current Tool to outdated TARGET connection advisory .................................... 5
Figure 3 Current TARGET to outdated Tool connection advisory .................................... 5
Figure 4 Example macro using a null modem cable ....................................................... 10
Figure 5 Example macro using a USB 2.0 debug cable ................................................... 11
Figure 6 Remove the IsaSerialDxe module from the FDF ............................................... 12
Figure 7 Don’t produce IsaAcpi protocol for debug port ............................................... 13
Figure 8 Ajays USB 2.0 debug cable................................................................................ 15
Figure 9 Include more debug information in the compiler’s output.............................. 16
Figure 10 PEIM original .................................................................................................... 17
Figure 11 Revised rule change for PEIM ......................................................................... 17
Figure 12 Updated CPU Driver example ........................................................................... 19
Figure 13 Active components of a debug session on a Microsoft Windows XP* platform22
Figure 14 Building a firmware image with the source-level debug package................... 26
Figure 15 A WinDbg launch window................................................................................ 27
Figure 16 Target stopped at the late SEC phase .............................................................. 28
viii
Figure 17 Target stopped due to late attach ................................................................... 29
Figure 18 Active components of a debug session on a Linux platform ........................... 38
Figure 19 Output when sourcing udk-script if GDB includes Expat XML parsing library 42
Figure 20 Output when sourcing udk-script if GDB doesn’t include Expat XML parsing library
42
Figure 21 Add the unresolved breakpoint in GDB ........................................................... 43
Figure 22 Compiling a firmware image with the source-level debug package................ 44
Figure 23 Detach in GDB .................................................................................................. 46
Figure 24 Add IO watch point in GDB .............................................................................. 52
Figure 25 List IO watch point in GDB ............................................................................... 52
Figure 26 Delete IO watch point in GDB .......................................................................... 52
Figure 27 Using PuTTY to connect to the terminal redirection port ............................... 55
Figure 28 Error displayed when the terminal redirection port cannot be opened ........ 56
Figure 29 Sample configuration for using 30000 as the terminal redirection port ......... 56
Figure 30 Data flow between TARGET and HOST ............................................................ 57
Figure 31 Output in GDB when a CPU exception happens in firmware .......................... 58
ix
1
1.1
Configuration
Overview
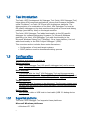
Document Purpose and Organization
This guide explains how to configure a host and target system and perform
basic debugging operations from Windows platform and Linux platform
host systems using the Intel® UEFI Development Kit Debugger Tool (Intel®
UDK Debugger Tool). It also includes debugging tips and techniques as
well as known issues, and it is intended for developers with a solid
understanding of the Intel® UEFI Development Kit 2010 (Intel® UDK2010),
and its predecessors and related subjects.
1.1.1
Configuration and Build
Chapters 1 and 2 provide an overview of the configuration and building of
the firmware image.
1.1.2
Windows
Windows users should continue with Chapters 3, 4, 5.These chapters detail
setting up the environment, usage, and known limitations of the Intel®
UDK Debugger Tool for Windows platforms.
1.1.3
Linux
After Chapter 2, Linux users should skip to chapters 6-8. These chapters
detail setting up the environment, usage, and known limitations of the
Intel® UDK Debugger Tool for Linux platforms.
1.1.4
Debugging Tips and Appendix
Chapter 9 provides general debugging tips, and the Appendix provides
additional information, such as a glossary and document conventions.
1
1.2
Tool Introduction
The Intel® UEFI Development Kit Debugger Tool (Intel® UDK Debugger Tool)
helps debug UDK-compliant applications, drivers and firmware (hereafter
called “firmware”) on Intel® IA-32 and x64 Architecture platforms. The
debug solution is a combination of the Intel® UDK Debugger Tool and an
OS-specific debugger on the host machine along with a source-level debug
package (provided by Intel) on the target machine.
The Intel® UDK Debugger Tool adds functionality to the OS-specific
debugger for software debugging firmware. For Microsoft Windows
platforms, the Intel® UDK Debugger Tool adds functionality to the
Microsoft Windows Debug Tool* (WinDbg). On a Linux platform, the tool
adds functionality to the GNU Project Debugger* (GDB).
This overview section includes these main discussions:
Configuration of host and target systems
OVMF platform used to demonstrate debug process
1.3
Configuration
The debug environment consists of:
Debug solution:
Intel® UDK Debugger Tool, OS-specific debugger tool, and a sourcelevel debugger package.
Host machine:
Configured with the Intel® UDK Debugger Tool and the appropriate
OS-specific debugger: WinDbg or GDB. The Intel® UDK Debugger Tool
includes extension commands for OS-specific debuggers.
Target machine:
Includes the UDK firmware to be debugged. The firmware image must
be built with the source-level debug package (SourceLevelDebugPkg)
provided by Intel.
Debug cable:
Null modem cable or USB host-to-host cable (USB 2.0 debug device
cable).
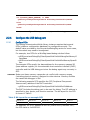
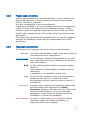
1.3.1
Supported platforms
The Intel® UDK Debugger Tool supports these platforms:
Microsoft Windows platforms:
Windows XP* IA32
2
Windows 7* x64
Linux platforms:
Fedora* 15 (IA32 and x64 client)
SUSE SLES* 11 SP1 (Enterprise Server) and SP2 Beta (beta 3 or
later) x64
Ubuntu* 32 Ubuntu* 10.x (or later) IA32 client
Ubuntu* 64 11.10 x64 client, Ubuntu* 10.x (or later) x64 client; LTS
server x64
The Intel® UDK Debugger Tool may work on additional Linux platforms.
However, the Intel® UDK Debugger Tool has not yet been fully validated
for additional Linux platforms.
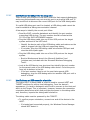
1.3.2
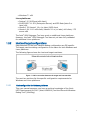
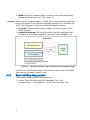
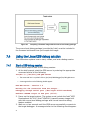
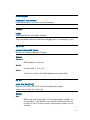
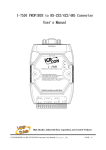
Host and target configurations
Requirements for the host machine debug configuration are OS-specific.
The target machine debug configuration is the same for both Windows and
Linux platforms.
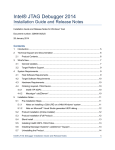
The following figure shows the host and target machines.
Figure 1 Cable connection between the target and host machine
The next two sections list the specific configuration requirements for
Windows and Linux platforms.
1.3.2.1
Host configuration for Windows platforms
This user manual assumes you have a working knowledge of the Intel®
UEFI Development Kit 2010 (Intel® UDK2010) and the Microsoft Windows
Debug Tool* (WinDbg).
3
Using the Intel® UDK Debugger Tool on a Windows platform requires a
host machine configured with:
Microsoft Windows XP*, 32-bit platform with Service Pack 3 (SP3) or
the Microsoft Win7* 64-bit platform
Microsoft Windows Debug Tool* (WinDbg) 6.11.0001.404 X86.
WinDbg is available for download at:
http://msdl.microsoft.com/download/symbols/debuggers/dbg_x86_6.11.1.404.msi
Intel® UDK Debugger Tool, which adds functionality to WinDbg, is
available for download at: www.intel.com/udk.
1.3.2.2
Host configuration for Linux platforms
This user manual assumes you have a working knowledge of the Intel®
UEFI Development Kit 2010 (Intel® UDK2010) and the GNU Project
Debugger* (GDB) for Linux platforms.
Using the Intel® UDK Debugger Tool on a Linux platform requires a host
machine configured with:
A supported Linux operating system:
Fedora* 15 (IA32 and x64 client)
SUSE SLES* 11 SP1 (Enterprise Server) and SP2 Beta (beta 3 or
later) x64
Ubuntu* 32 Ubuntu* 10.x (or later) IA32 client
Ubuntu* 64 11.10 x64 client, Ubuntu* 10.x (or later) x64 client;
LTS server x64
GNU Project Debugger* (GDB)
Intel® UDK Debugger Tool, which adds functionality to GDB. It is
available at www.intel.com/udk.
1.3.3
Target configuration
The target machine must have a firmware build that includes the sourcelevel debug package SourceLevelDebugPkg—a part of the Intel® UEFI
Development Kit 2010 (Intel® UDK2010), located at www.tianocore.org
(http://tianocore.souorceforge.net).
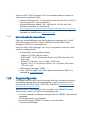
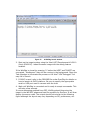
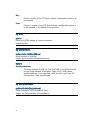
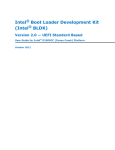
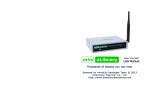
When the Intel® UDK Debugger Tool connects to the TARGET firmware
with an older version of SourceLevelDebugPkg code:
An error message is displayed advising that the TARGET code must be
upgraded.
The debug session is terminated.
You should update TARGET firmware to use the latest
SourceLevelDebugPkg.
4
Figure 2 Current Tool to outdated TARGET connection advisory
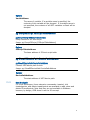
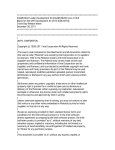
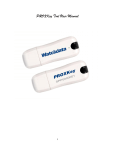
Similarly, when an older version of the Intel® UDK Debugger Tool connects
to firmware with a current version of TARGET, an upgrade advisory is
issued.
Figure 3 Current TARGET to outdated Tool connection advisory
5
The Intel® UDK Debugger Tool for Windows version 1.2 hides the above
debug console window resulting in the above upgrade advisory cannot be
seen when that version of tool connects to a newer TARGET. To show the
debug console, modify the configuration file with the following code
snippet:
[Debug]
Debug=1
1.3.4
Connection between host and target machines
The Intel® UDK Debugger Tool supports the following interconnects for the
debug cable:
Null modem cable
USB host-to-host cable (USB 2.0 debug device cable)
1.4
OVMF platform and the debug process
The OVMF (Open-source Virtual Machine Firmware) platform
implementation is used to demonstrate the debug process in some of the
examples. The OVMF platform works on a virtual machine and can also be
chosen as a configuration option in order to use virtual COM-to-COM
connections.
The OVMF platform implementation is available from the EDK II project
directory at www.tianocore.org (http://tianocore.sourceforge.net).
For general instructions on building and booting an OVMF image, including
setting up COM connections, refer to the OVMF wiki page at
http://sourceforge.net/apps/mediawiki/tianocore/index.php?title=OVMF_FAQ.
6
2
2.1
Build the Firmware Image
Introduction
The firmware image, including the source-level debug package provided by
Intel, must be built before using the Intel® UDK Debugger Tool. To do this,
complete the appropriate build instructions for your Intel® UDK2010
platform, taking into consideration the modifications described in this
section. The firmware build process and most of the considerations for
building the image are the same for both Windows and Linux platforms.
Differences are noted where appropriate.
2.1.1
Linux Platforms
For Linux platforms, x64 code can only be debugged when using GDB on
x64 Linux platforms. Make sure the firmware image is built on an x64
Linux machine so that the debug symbols are accessible to the GDB.
2.1.2
Windows Platforms
For Windows platforms, there are two special considerations to keep in
mind: aggressive zeroing and using the PE image format instead of TE.
These considerations are discussed in section 2.2.5.
2.2
Modify the configuration files for
the firmware used by the target machine
For best results, configure the firmware in the TARGET machine to support
debugging.
The firmware in the target machine must include the Intel provided
source-level debug package because it supports debugging with the
Intel® UDK Debugger Tool.
Update the platform’s DSC/FDF (firmware device file) files to ensure
the appropriate library instances are selected. DSC files contain
information used during the FDF build process.
7
The serial port or USB debug port may need to be configured for
debugging.
When making changes to DSC/FDF files, define a macro that allows
for conditional turn-on of the debug feature. An example is shown
later in this section.
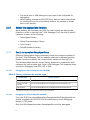
2.2.1
Select the appropriate libraries
When building the firmware, the DSC file must include the appropriate
libraries in order to use the Intel® UDK Debugger Tool. Be sure to specify
instances of each of the following:
Debug Agent library
Debug Communication library
Timer library
PeCoffExtraAction library
2.2.1.1
Specify the appropriate Debug Agent library
Different Debug Agent library instances provide the functions needed by
the Intel® UDK Debugger Tool for modules executed in different booting
phases. Be sure to specify the correct library instance in the DSC file.
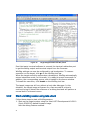
The following table lists the correct library instances to replace the NULL
instances for each module type. Intel® UDK Debugger Tool supports three
scenarios: debugging from SEC, PEI or DXE.
2.2.1.1.1
Debugging from SEC (including PEI, DXE and SMM)
Table 1 Library instances by module type
Module type*
Library instance
SEC or PEI modules
SourceLevelDebugPkg/Library/DebugAgent/SecPeiDebugAgentLib.inf
DxeCore and DXE
modules
SourceLevelDebugPkg/Library/DebugAgent/DxeDebugAgentLib.inf
SMM modules
SourceLevelDebugPkg/Library/DebugAgent/SmmDebugAgentLib.inf
* For definitions of acronyms, refer to Appendix A at the end of this user manual.
2.2.1.1.2
Debugging from PEI (including DXE and SMM)
First, the PEIM SourceLevelDebugPkg/DebugAgentPei/DebugAgentPei.inf
should be added into DSC/FDF files to enable source level debugging
feature in PEI phase.
Only the PEIM dispatched after DebugAgentPei could be debugged.
8
Table 2 Library instances by module type
Module type
2.2.1.1.3
Library instance
SEC
MdeModulePkg/Library/DebugAgentLibNull/DebugAgentLibNull.inf
PEI modules
SourceLevelDebugPkg/Library/DebugAgent/SecPeiDebugAgentLib.inf
DxeCore and DXE
modules
SourceLevelDebugPkg/Library/DebugAgent/DxeDebugAgentLib.inf
SMM modules
SourceLevelDebugPkg/Library/DebugAgent/SmmDebugAgentLib.inf
Debugging from DXE(including SMM)
Table 3 Library instances by module type
Module type
2.2.1.2
Library instance
SEC or PEI modules
MdeModulePkg/Library/DebugAgentLibNull/DebugAgentLibNull.inf
DxeCore and DXE
modules
SourceLevelDebugPkg/Library/DebugAgent/DxeDebugAgentLib.inf
SMM modules
SourceLevelDebugPkg/Library/DebugAgent/SmmDebugAgentLib.inf
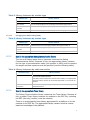
Specify the appropriate Debug Communication library
The non-null Debug Agent library instances consume the Debug
Communication library. Because of this, the appropriate library instance
for the type of communication cable (null modem or USB) used to connect
the target and host systems must be specified (see the following table).
Table 4 Library instances by cable connection
Connection type
Serial connection
Library instance
SourceLevelDebugPkg/Library/DebugCommunicationLibSerialPort/Debug
CommunicationLibSerialPort.inf
This library instance depends on the Serial Port Library so an appropriate
Serial Port Library instance for all modules dependent on it must also be
specified.
USB 2.0 debug cable
connection
2.2.1.3
SourceLevelDebugPkg/Library/DebugCommunicationLibUsb/DebugComm
unicationLibUsb.inf
Specify the appropriate Timer library
The Debug Communication library consumes the Timer library. Because of
this, a proper Timer library instance for modules in the DSC file, including
the SEC (security) module, must be selected.
There is no single specific timer library appropriate for a platform or for the
modules in the DSC file. The appropriate library instance must be chosen
based on knowledge of the platform.
9
2.2.1.4
Specify the appropriate PeCoffExtraAction library
The PeCoffExtraAction library instance is invoked each time a module is
loaded or unloaded. This library instance is responsible for informing the
host that the target has loaded or unloaded a module. In the DSC file,
the following PeCoffExtraAction library instance must be specified for
any module that depends on the PeCoffExtraAction library class.
SourceLevelDebugPkg/Library/PeCoffExtraActionLibDebug/PeCoffExtra
ActionLibDebug.inf
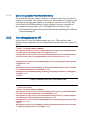
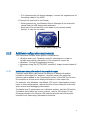
2.2.2
Turn debugging on or off
Use a macro to turn the debug feature on or off. The next two code
samples show fragments in the LibraryClasses section that use a macro to
do so.
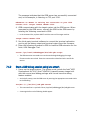
[LibraryClasses]
!ifdef $(SOURCE_DEBUG_ENABLE)
PeCoffExtraActionLib|SourceLevelDebugPkg/Library/PeCoffExtraAc
tionLibDebug/PeCoffExtraActionLibDebug.inf
DebugCommunicationLib|SourceLevelDebugPkg/Library/DebugCommuni
cationLibSerialPort/DebugCommunicationLibSerialPort.inf
DebugAgentLib|SourceLevelDebugPkg/Library/DebugAgent/SecPeiDeb
ugAgentLib.inf
!else
PeCoffExtraActionLib|MdePkg/Library/BasePeCoffExtraActionLibNu
ll/BasePeCoffExtraActionLibNull.inf
DebugAgentLib|MdeModulePkg/Library/DebugAgentLibNull/DebugAgen
tLibNull.inf
!endif
Figure 4 Example macro using a null modem cable
[LibraryClasses]
!ifdef $(SOURCE_DEBUG_ENABLE)
PeCoffExtraActionLib|SourceLevelDebugPkg/Library/PeCoffExtraAc
tionLibDebug/PeCoffExtraActionLibDebug.inf
DebugCommunicationLib|SourceLevelDebugPkg/Library/DebugCommuni
cationLibUsb/DebugCommunicationLibUsb.inf
DebugAgentLib|SourceLevelDebugPkg/Library/DebugAgent/SecPeiDeb
ugAgentLib.inf
!else
PeCoffExtraActionLib|MdePkg/Library/BasePeCoffExtraActionLibNu
ll/BasePeCoffExtraActionLibNull.inf
10
DebugAgentLib|MdeModulePkg/Library/DebugAgentLibNull/DebugAgen
tLibNull.inf
!endif
Figure 5 Example macro using a USB 2.0 debug cable
2.2.3
Configure a serial port for debug usage
The DebugCommunicationLibSerialPort library instance consumes the
Serial Port Library.
In addition to choosing an appropriate Serial Port Library for the target
platform, the serial port parameters on the target machine must be
configured to match the settings on the host.
2.2.3.1
Baud rate
In most cases, it is preferable to set the baud rate to 115200.The baud
rate should be the same on both the host and target machines.
If flow control is disabled and the serial connection is not stable, specify a
lower baud rate.
2.2.3.2
Hardware flow control
On both Windows and Linux platforms, flow control is on by default. In
most cases, make sure to not disable flow control.
If the platform-specific Serial Port Library does not support hardware flow
control, flow control on the host machine should be turned off as well.
The flow control setting should be the same on both the host and target
machines.
2.2.3.3
Configure the hardware buffer for FIFO
In order for the debug solution to work properly, the hardware buffer must
be configured for first-in–first-out (FIFO). However, some platform-specific
Serial Port Library instances may not enable receive and transmit for the
FIFO hardware buffer.
The specific process for configuring the hardware buffer is hardwaredependent. Refer to your hardware’s data sheet for information about the
hardware buffer. The SerialPortLib instance provided by Intel in
MdeModulePkg/Library/BaseSerialPortLib16550 library is also an example
of implementing a FIFO hardware buffer.
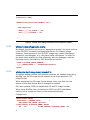
2.2.3.4
Deactivate the terminal support
Because the IsaSerialDxe driver tries to manage the serial port, a conflict
with the debug agent is created. One way to prevent the conflict is to
11
remove the IsaSerialDxe module from the platform firmware device file
(FDF). For example:
[FV.DXEFV]
...
!ifndef $(SOURCE_DEBUG_ENABLE)
INF
IntelFrameworkModulePkg/Bus/Isa/IsaSerialDxe/IsaSerialDxe.inf
!endif
...
Figure 6 Remove the IsaSerialDxe module from the FDF
The console device created by debug agent isn’t added to the console
input/output device list by default. There are two ways to add it to the list:
change the setting through the Intel® UEFI Development Kit 2010
(Intel® UDK2010) front page UI
change the platform boot manager library implementation.
The first method doesn’t require rewriting code, but the setting needs to
be manually changed every time the firmware is burned.
The console device path begins with a vendor defined device path node
followed by a UART device path node and a vendor defined messaging
device path node. An example follows:
VenHw(865A5A9B-B85D-474C-845565D1BE844BE2)/Uart(115200,8,N,1)/VenPcAnsi()
Refer to the global variable, mSerialIoDevicePath, in the
SourceLevelDebugPkg/Library/DebugAgent/DxeDebugAgent/SerialIo.c file
for console device path details.
If the platform has multiple serial ports and those ports, other than the
debug port, are needed as console devices as well, do not remove the
IsaSerialDxe module from the FDF because the IsaSerialDxe module
manages those other serial ports.
Instead, modify the module that produces the IsaAcpi protocol to not
produce the IsaAcpi protocol for the debug port.
For the OVMF platform, modify the PCD in the DSC file instead of the
IsaAcpiDxe module.
12
!if $(SOURCE_DEBUG_ENABLE) == TRUE
gPcAtChipsetPkgTokenSpaceGuid.PcdIsaAcpiCom1Enable|FALSE
!else
gPcAtChipsetPkgTokenSpaceGuid.PcdIsaAcpiCom1Enable|TRUE
!endif
Figure 7 Don’t produce IsaAcpi protocol for debug port
2.2.4
Configure the USB debug port
2.2.4.1
Configure PCDs
The DebugCommunicationLibUsb library instance requires that several
PCDs (platform configuration database) be configured correctly. The
default value provided by the SourceLevelDebugPkg works for most cases,
but the values may need to be adjusted.
For example, two PCDs for a WinDbg-based debug solution follow:
gEfiSourceLevelDebugPkgTokenSpaceGuid.PcdUsbDebugPortMemoryS
paceBase
gEfiSourceLevelDebugPkgTokenSpaceGuid.PcdUsbEhciMemorySpaceB
ase
The example PCDs specify the base address for the memory-mapped IO
(base address register) for the extensible host controller interface (EHCI)
controller and the USB debug port since the debug agent may run early in
SEC.
CAUTION:
Make sure these memory ranges do not conflict with memory ranges
(including physical memory) assigned to other devices. Memory conflicts
can cause the debugger to fail.
The following example PCD specifies the PCI (Peripheral Component
Interconnect) address of the EHCI controller.
gEfiSourceLevelDebugPkgTokenSpaceGuid.PcdUsbEhciPciAddress
The EHCI includes the debug port to be used for debug. The PCI address is
specified by bus, device, and function number. The bit layout for the PCD
is shown in Table 5.
Table 5 Bit layout for an example PCD
Bits 28~31
Bits 20~27
Bits 15~19
Bits 12~14
Bits 00~11
0
Bus number
Device number
Function number
0
For example, for a PCI address at bus 0x0, device 0x1D, function 0x07,
the PCD value is 0x000EF000.
13
2.2.4.2
Identify the correct USB port for the debug cable
There is only one USB port in one EHCI controller that supports debugging
and some motherboards may not wire this port to a physical USB port. It
may be difficult to discover the correct USB port for the USB debug cable.
If a valid USB debug port can’t be located, a USB debug cable cannot be
used to establish a debug communication channel.
A few ways to identify the correct port follow.
Read the EHCI controller datasheet and identify the port number
supporting USB de-bug. The port number should be listed at bits
20~23 of the EHCI HCSPARAMS register.
Plug the USB debug cable into one of the USB ports on the target
system and boot to the UEFI shell.
Identify the device path of the USB debug cable and make sure the
cable is plugged into the USB port supporting debug.
If not seen, plug the USB debug cable into another USB port and
view the device path again.
Plug the USB debug cable into one of the USB ports on the target
system.
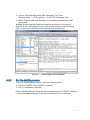
Boot to Windows and launch the Microsoft UsbView* tool
(usbview.exe) included with the Microsoft Windows Debugging
Tools*.
Look at the USB device tree structure then identify the port number
for the parent node of the USB debug cable device. Count the ports
from top to bottom in the list.
If the port number listed is not the one that supports USB
debugging, plug the USB debug cable into another USB port until a
match is found.
2.2.4.3
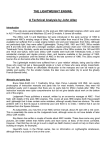
Identify the correct USB connection orientation
The Ajays USB 2.0 debug cable is a device used to connect HOST and
TARGET machines for source-level debugging. From the device’s
appearance, it’s hard to distinguish which end to connect to the Host and
which to the Target. This is important, however, because the connection
orientation determines which end provides the power to the debug cable
and, therefore, impacts the debug cable’s behavior.
The debug cable must be powered by the TARGET.
To confirm proper orientation, connect one end of the device to the
HOST.
If oriented and connected properly, the Windows Device Manager
should NOT detect it.
14
If it is detected by the device manager, connect the opposite end of
the debug cable to the HOST.
Connect the open end to the Target.
When powered-on, the Windows Device Manager at the Host side
should find the USB debug cable attached.
Note that if the connection is not made in this recommended
fashion, it may be not stable.
Figure 8 Ajays USB 2.0 debug cable
2.2.5
Additional configuration requirements
This discussion includes three special considerations:
Windows and Linux: Disabling compiler optimization in order to
include more debug information in the compiler’s output file
Windows: Turning off aggressive zeroing
Windows: Using the PE (PE/COFF execution) image format instead of
TE
2.2.5.1
Include more debug information in the compiler’s output
Compiler optimization can reduce the amount of debug information
included in the output file. However, compiler options for particular
modules can be added in the Components section of the DSC file to force
the compiler to include more debug information in the output file.
For example, with Windows, the default /O2 (level 2 optimization) switch
turns on some optimization, reduces the size of the output file and omits
some source level debugging information.
To disable level 2 optimization on a Windows system, use the /Od switch.
To disable optimization on a Linux system, use the /O0 switch. In the
following example, the /Od and /O0 switches prevent each OS-specific
compiler from performing optimization functions.
15
[Components.IA32]
...
MdeModulePkg/Core/Dxe/DxeMain.inf {
...
<BuildOptions>
MSFT:*_*_*_CC_FLAGS = /Od
GCC:*_*_*_CC_FLAGS = /O0
...
}
Figure 9 Include more debug information in the compiler’s output
2.2.5.2
WinDbg: Turning off aggressive zeroing
By default, the GenFw tool turns on “aggressive zeroing” for some sections
in the PE/COFF (Portable ExeCutable and Object File Format) image.
However, these sections in the PE/COFF image may contain information
needed for the debugger, e.g., the stack frame information. In order for
the stack frame analysis to work effectively with the debugger, add the
following lines to the platform DSC Build Options section:
!ifdef $(SOURCE_DEBUG_ENABLE)
*_*_*_GENFW_FLAGS = --keepexceptiontable
!endif
2.2.5.3
WinDbg: Use the PE image format instead of TE
If frequent debug function calls between modules are needed when using
WinDbg, use the PE image format instead of the terse execution (TE)
image format.
When specifying the PE image format during build, note that the rule
section of the code should also be changed as needed.
On Linux systems, GDB can handle both PE and TE image formats.
When using WinDbg, the rule section for PEIM (pre-EFI initialization
module) must change as shown in the following examples.
Change from:
[Rule.Common.PEIM]
FILE PEIM = $(NAMED_GUID)
{
PEI_DEPEX PEI_DEPEX Optional
$(INF_OUTPUT)/$(MODULE_NAME).depex
TE
TE
$(INF_OUTPUT)/$(MODULE_NAME).efi
16
UI
STRING="$(MODULE_NAME)" Optional
VERSION STRING="$(INF_VERSION)" Optional
BUILD_NUM=$(BUILD_NUMBER)
}
Figure 10
PEIM original
To:
[Rule.Common.PEIM]
FILE PEIM = $(NAMED_GUID) {
PEI_DEPEX PEI_DEPEX Optional
PE32
UI
PE32 Align = 32
|.depex
|.efi
STRING="$(MODULE_NAME)" Optional
VERSION STRING="$(INF_VERSION)" Optional
BUILD_NUM=$(BUILD_NUMBER)
}
Figure 11
Revised rule change for PEIM
Apply similar changes to the rule sections for SEC and PEI_CORE. The
corresponding rule section names may vary on different platforms but
could look like Rule.Common.SEC or Rule.Common.PEI_CORE.
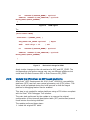
2.2.6
Update the CPU driver on ECP-based platforms
Most Intel® UEFI Development Kit 2010 (Intel® UDK2010) compatibility
platforms (ECP) use their own central processing unit (CPU) driver. This
driver must be updated during the build process so that the target
platform’s debugging feature can be enabled.
This step is not needed for native platforms using a CPU driver compliant
with the Intel® UDK Debugger Tool solution.
The main task performed by the update is to reserve the original
configuration of the interrupt description table (IDT) entries and prevent
those entries from being modified.
The update performs these steps:
1. Loads the original IDT table.
17
2. Calculates the IDT table’s entries count.
3. Copies the original IDT table entries to the new IDT table.
4. Updates the code segment (CS) field for the IDT table entries, as the
DXE (driver execution) phase is using a different segment descriptor.
5. Fills the rest of IDT entries needed by CPU driver.
If the CPU module is not linked with BaseLib, refer to
MdePkg/Library/BaseLib for the implementation of AsmReadIdtr(),
AsmWriteIdtr(), and AsmReadCs().
The updated code should follow the same pattern as the following:
18
STATIC
VOID
InitInterruptDescriptorTable (
VOID
)
{
... ...
//
// Get original IDT address and size.
//
AsmReadIdtr ((IA32_DESCRIPTOR *) &Idtr);
//
// Copy original IDT entry.
//
CopyMem (&gIdtTable[0], (VOID *) Idtr.Base, Idtr.Limit + 1);
//
// Update all IDT entries to use current CS value
//
for (Index = 0; Index < INTERRUPT_VECTOR_NUMBER; Index ++,
CurrentHandler += 0x08) {
gIdtTable[Index].Bits.Selector = AsmReadCs();
}
... ...
AsmWriteIdtr (IdtPtr);
... ...
}
Figure 12
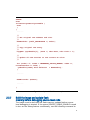
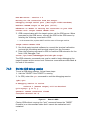
2.2.7
Updated CPU Driver example
Build the image and update flash
memory before debugging source-level code
The image must be built and the flash memory updated before sourcelevel debugging is started. If the macro SOURCE_DEBUG_ENABLE is used
to turn on the debug feature conditionally, use the following command to
19
build the image. The following assumes the Conf/target.txt file is
configured to identify the build target.
build -D SOURCE_DEBUG_ENABLE
2.2.7.1
For Linux platforms
For Linux platforms, debug x64 code only when using GDB on x64 Linux
platforms. When debugging x64 Linux platforms, make sure the firmware
image is built on an x64 Linux machine so that the debug symbols are
accessible to the GDB.
20
3
3.1
Setup
the Windows
Debug Environment
Introduction
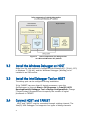
Setting up the Windows debug environment consists of four general steps:
1. Build the firmware image and burn it to TARGET (described earlier in
Chapter 2).
2. Install the Windows Debugger (WinDbg) on HOST.
3. Install the Intel® UDK Debugger Tool on HOST.
4. Connect HOST and TARGET.
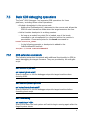
Figure 13 shows how the debug components interact on a Windows host
during a debug session.
21
Figure 13
Active components of a debug session
on a Microsoft Windows XP* platform
3.2
Install the Windows Debugger on HOST
Make sure the host machine is configured with Windows XP* (32-bit), SP3,
or Windows 7* (64-bit), and the Windows Debugger (WinDbg) to be
installed is an X86 version.
3.3
Install the Intel Debugger Tool on HOST
The debug port can be configured during installation.
If the TARGET has more than 16 logical processors, open the
SoftDebugger.ini through Start-> All Programs -> Intel(R) UEFI
Development Kit Debugger Tool->Change Configurations. Change
[Target System]/ProcessorCount to specify the number of logical
processors in TARGET.
3.4
Connect HOST and TARGET
HOST and TARGET must be connected through a debug channel. The
Intel(R) UDK Debugger Tool supports four types of debug channels:
22
* Serial by a null modem cable
[Debug Port]
Channel = Serial
Port = COM1
BaudRate = 115200
FlowControl = 1
* USB by a USB debug cable
[Debug Port]
Channel = USB
NOTE: The correct USB port on the target machine must be used. Always
connect the USB debug cable to HOST before connecting to TARGET.
* TCP
[Debug Port]
Channel = TCP
Server = 192.168.1.4
Port = 1234
* Pipe
[Debug Port]
Channel = PIPE
Port = PipeName
NOTE: UDK Debugger will open \\.\pipe\PipeName for input and output.
Once both HOST and TARGET have been configured and connected, a
debug session can be started.
23
24
4
Use the Debug Solution
on a Windows Platform
4.1 Introduction
This section introduces the Intel® UDK Debugger Tool for the Windows
platform, and includes these main discussions:
General debug flow
Using the WinDbg debug solution: Start and stop a debug session
Basic debugging operations, including WinDbg extension commands
4.2 Supported features
The Intel® UDK Debugger Tool for Windows platforms helps in the use of
WinDbg to debug Intel® UEFI Development Kit 2010 (Intel® UDK2010)
based firmware running on an IA-32 processor. The Intel® UDK Debugger
Tool provides the host side software in binary form to support WinDbg
remote debugging across a null modem cable or USB debug cable.
With the Intel® UDK Debugger Tool, it is possible to:
Debug source-level code using WinDbg with a host running a Windows
OS.
Debug could begin as early as late SEC, after temporary RAM set up,
for the normal boot path.
Start debugging SMM (system management mode) code by stopping
the target at the next SMI (system management interrupt).
Setting unresolved breakpoints (also known as pending breakpoints)
Debugging code running on AP (application processors)
Late attach
Using a null modem cable or a USB 2.0 debug cable (also known as a
USB host-to-host cable or USB 2.0 debug device)
4.3
General debug flow
There are three general steps in a typical debug process:
25
1. Build—Build the firmware image, including the source-level debug
package (provided by Intel). See Figure 14.
CAUTION:
Each time the firmware image is rebuilt, the SourceLevelDebug package
must be included. If the SourceLevelDebug package is not included, the
Intel® UDK Debugger Tool cannot debug the target firmware.
2. Program—Program the firmware image into flash memory on the
target system.
3. Launch and debug—On the host system, launch a debugger that
includes the functionality added by the Intel® UDK Debugger Tool.
Figure 14
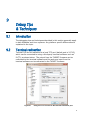
4.3.1
Building a firmware image with the source-level debug package.
The source-level debug package in the firmware build must be included
each time the firmware image is built.
Start a WinDbg debug session
Follow these steps to start a WinDbg session:
1. Launch “Start WinDbg using UDK Debugger Tool” from
Windows Start -> All Programs -> Intel® UDK Debugger Tool.
26
Figure 15
A WinDbg launch window
2. Start up the target system using the Intel® UEFI Development Kit 2010
(Intel® UDK2010) -based firmware image with the debug feature
enabled.
If the WinDbg is closed by pressing ‘X’ before the HOST and TARGET are
connected, “windbg.exe” may still be running in the background. Open the
Task Manager to terminate the process or the Intel® UDK Debugger Tool
may fail to launch.
3. If OVMF is used, refer to the README file under OvmfPkg for details on
how to launch an OVFM platform. Be sure to specify the appropriate
serial or USB port used to connect with the host.
4. Wait until WinDbg is connected and is ready to accept commands. This
will take a few seconds.
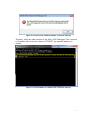
If source debugging enabled from SEC, WinDbg should then stop the
target in the late SEC phase and load the symbols for SecCore. It will then
display the source code. The output should look similar to the following
figure although the layout may vary depending on OS, preferences, etc.
27
Figure 16
Target stopped at the late SEC phase
Run third-party terminal software to connect the terminal redirection port
to get the debug output and terminal output from the firmware.
WinDbg settings can now be configured to set breakpoints. To resume
execution on the target, click go in the WinDbg tool bar.
When the target execution encounters a breakpoint, WinDbg automatically
enters interactive mode. In this mode, it is ready to accept commands. In
addition, the corresponding source code is loaded to the source window.
To break the execution, click break on the WinDbg tool bar.
The target image can still run without a host-side debugger. In this
situation, the target image will pause for a few seconds at a time to
continue trying to detect the existence of a debug host and will perform a
normal boot if a timeout occurs.
4.3.2
Start a WinDbg session using late attach
Follow these steps to start a WinDbg session:
1. Start up the target system using the Intel® UEFI Development Kit 2010
(Intel® UDK2010)-based firmware image
with the debug feature enabled.
28
2. Launch “Start WinDbg using UDK Debugger Tool” from
Windows Start -> All Programs -> Intel® UDK Debugger Tool.
3. Wait a few seconds until WinDbg is connected and ready to accept
commands.
WinDbg should stop the target and load the symbols for the current
module. It will then display source code looking similar to the following
figure, allowing for different machines and user preferences.
Figure 17
4.3.3
Target stopped due to late attach
End the WinDbg session
To end a WinDbg debug session, use the following steps:
1. Halt the TARGET if the TARGET is running
2. Run ‘q’ command in WinDbg
Closing WinDbg without using the above steps leaves the TARGET platform
in an intermediate state and it cannot be reattached until rebooted.
29
4.4
Basic WinDbg debugging operations
When the target reaches a breakpoint or stops after a break command is
issued, the debugger loads the source of the current module as well as all
other modules that have executed (if possible or applicable).
This list briefly describes basic debugging operations available through
WinDbg:
Open source code and set/clear breakpoints.
Open a disassembly window to see instructions around the current
instruction pointer (IP).
Open a memory window to read or write memory.
In order to prevent a system hang on some platforms, accessing 0128M memory before physical memory is ready will not cause a similar
memory access on the target system. Instead, dummy data is
displayed. The filtering capability is disabled during the transition from
pre-memory to post-memory PEI. For example, the memory in OVMF
is functional from reset and displays actual memory contents.
4.4.1
Basic procedures
1. Open a local variable window to read (or to write) local variables and
function parameters.
— The /Od compiler option disables some optimization and makes sure all local variables
are displayed in the output code. At optimization levels above /Od, local variables
optimized into registers are not visible.
— Local variables stored on the stack may still been seen. The same conditions apply to
parameters passed into a function.
2. Open a register window to read/write general purpose registers.
3. Open a call stack window to see the call stack and/or parameter names
and/or values.
4. Issue step into, step over, or go commands to tell the target to
execute.
— When using WinDbg on systems with multiple processors, step into and step over
will cause only one processor to execute and leave other processors at the stopped
state. The go command causes all processors to start execution.
— Only one processor at a time can be debugged when using DBG.
5. Issue the break command while the target is running to break in.
On multiple processor systems (WinDbg only), all active processors will be stopped.
30
6. Open a Processes and Threads window to view and specify the current
processor to emulate.
— On multiple processor systems (WinDbg only), each logical processor is emulated as a
separate thread.
7. Use the Watch window to look at global variables (i.e. gBS, gST, gRT,
gDS).
4.4.2
WinDbg extension commands
The following extension commands add additional functionalities to
WinDbg to assist debugging target firmware. They are provided by the
UdkExtension.dll.
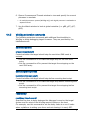
smmentrybreak
smmentrybreak [on|off]
Controls whether the target should stop the next time SMM mode is
entered.
Set the command to on to make the target stop on the next SMM
entry.
Set the command to off to prevent the target from stopping on the
next SMM entry.
bootscriptentrybreak
bootscriptentrybreak [on|off]
Controls whether the target should stop before executing boot script.
Set the command to on to make the target stop before executing boot
script.
Set the command to off to prevent the target from stopping before
executing boot script.
resetdelay
resetdelay <time in second>
Specifies the time to delay between the debugger’s reset on the target
system and the start of the WinDbg session’s setup on the host.
For example, use this command to set the delay value to a non-0 value
when a platform is setting up a timer and not clearing it in early SEC.
31
Without a delay, the hardware reset could interfere with the debug
session. Setting the delay to a value larger than the timer timeout value
may resolve this problem.
Typically, a delay of 10 seconds is enough. This can help avoid the need to
delay each reboot by clearing the timer early in the SEC phase.
cpuid
cpuid [Index] [SubIndex]
Retrieves CPUID information.
Options:
Index
Value of EAX priori to executing CPUID instruction (defaults to 1,
32-bit max, base 16)
SubIndex
Value of ECX priori to executing CPUID instruction (defaults to 0,
32-bit max, base 16)
The commands below are executed with !py prefix, for example, !py pci.
!py mmio
!py mmio Address Width [Value]
Access the memory mapped IO space.
Options:
Address
MMIO address to access.
Width
Access width 1, 2, 4 or 8.
Value
Content to write to the MMIO address when specified.
32
!py pci
!py pci [Bus [Dev [Func]]]
Display PCI device list or PCI function configuration space.
Options:
Bus
When only Bus is specified, it is the starting bus number
for enumeration; 0 by default if not specified. Otherwise the
bus number of the PCI device whose configuration space is
to be dumped.
Dev
Device number of the PCI device whose configuration space is
to be dumped.
Func
Function number of the PCI device whose configuration space
is to be dumped; 0 by default if not specified.
!py mtrr
!py mtrr
Dump the MTRR setting of current processor.
!py DumpHobs
!py DumpHobs [HobStartAddress]
Dump content of HOB list.
Options:
HobStartAddress
The start address of HOB list. The first HOB in the HOB list must
be the Phase Handoff Information Table (PHIT) HOB. When
HobStartAddress is not specified, HOB list will be got from EFI
Configuration Table and dumped.
33
!py DumpVariable
!py DumpVariable [VariableName]
Dump content of UEFI variable on flash.
Options:
VariableName
The name of variable. If a variable name is specified, the
contents of this variable will be dumped. If a variable name is
not specified, the contents of all UEFI variables on flash will be
dumped.
!py DumpS3Script S3ScriptTableAddress
!py DumpS3Script S3ScriptTableAddress
Dump content of S3 boot script.
Options:
S3ScriptTableAddress
The base address of S3 boot script table.
!py ShowEfiDevicePath DevicePathAddress
!py ShowEfiDevicePath DevicePathAddress
Convert a UEFI device path to text.
Options:
DevicePathAddress
The start address of a UEFI device path.
34
5
5.1
Known Limitations &
Issues for Windows platforms
Known limitations
The debug solution has the following known limitations on a Windows
platform:
Firmware output (through the debug channel) should not contain nonASCII characters.
Do not use more than three user-specified breakpoints in the SEC/PEI
phase since hardware breakpoints are used for code executing from
read-only memory.
Code occurring before the source-level debug package is initialized
cannot be debugged.
— This includes early SEC code, early SMM code, and other code.
The TE image header is emulated as a PE header for WinDbg. As a
result, the contents of the TE header are not visible to WinDbg.
During the SEC, PEI phases, only one processor (the BSP, or boot
strap processor) can be debugged.
— This also applies to the DXE phase before the Multiple Processor (MP) Services Protocol
is installed., Switching to other active processors (AP, or Additional Processors) is
possible while in the DXE phase but after the MP Services Protocol has been installed.
Debugging is not supported if the CPU is executing in 16-bit real
mode.
If the CPU is executing with interrupts disabled, breaks from the host
to the target are not supported.
When using the USB debug cable as the debug communication
channel, USB devices cannot be detected on any other USB ports
associated with the same EHCI controller.
— USB ports associated with other EHCI controllers are not impacted.
Only AP code invoked by the Platform Initialization Multiprocessor
Services Protocol can be debugged.
35
— For example, on EdkCompatibilityPkg-based platforms, AP code invoked through the
Framework Multiprocessor Services Protocol cannot be debugged.
36
6
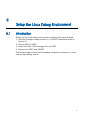
6.1
Setup the Linux Debug Environment
Introduction
Setting up the Linux debug environment consists of four general steps:
1. Build the firmware image and burn it to TARGET (described earlier in
Section 3).
2. Rebuild GDB on HOST.
3. Install the Intel® UDK Debugger Tool on HOST.
4. Connect the HOST and TARGET.
The following figure shows how the debug components interact on a Linux
host during a debug session.
37
Figure 18
6.2
Active components of a debug session on a Linux platform
Rebuild GDB on HOST
For Linux platforms, x64 code can only be debugged when using GDB on
x64 Linux platforms. When debugging x64 platforms, make sure to build
the firmware image on an x64 Linux machine so that the debug symbols
are accessible to the GDB.
GDB supports the unresolved breakpoint setting by design, but it needs to
be rebuilt to support this feature because the GDB pre-installed doesn’t
include the Expat XML parsing library. Using the GDB pre-installed doesn’t
block the other features.
Use “--target=x86_64-w64-mingw32 --with-expat” as the parameter to
configure the GDB before make so GDB can use the Expat XML parsing
library. This library may be included in the end user’s Linux distribution. If
not, it can be downloaded from http://expat.sourceforge.net.
6.3
Install the Intel Debugger Tool on HOST
The debug port can be configured during installation.
If the TARGET has more than 16 logical processors, open the
SoftDebugger.ini through Start-> All Programs -> Intel(R) UEFI
38
Development Kit Debugger Tool->Change Configurations. Change
[Target System]/ProcessorCount to specify the number of logical
processors in TARGET.
6.4
Connect HOST and TARGET
HOST and TARGET must be connected through a debug channel. The
Intel(R) UDK Debugger Tool supports four types of debug channels:
* Serial by a null modem cable
[Debug Port]
Channel = Serial
Port = COM1
BaudRate = 115200
FlowControl = 1
* USB by a USB debug cable
[Debug Port]
Channel = USB
NOTE: USB debug cable support is provided by Linux kernel starting from
2.6.20. The correct USB port on the target machine must be used. Always
connect the USB debug cable to HOST before connecting to TARGET.
* TCP
[Debug Port]
Channel = TCP
Server = 192.168.1.4
Port = 1234
* Pipe
[Debug Port]
Channel = PIPE
Port = PipePath
NOTE: UDK Debugger will open PipePath.in for output and PipePath.out
for input.
39
Once both HOST and TARGET have been configured and connected, a
debug session can be started.
40
7
7.1
Use the Debug Solution
on a Linux Platform
Introduction
This section explains how to perform basic debug operations. It includes
these key discussions:
Supported features for Linux platforms as well as features not yet
implemented
Using the Linux/GDB debug solution to Start, reset, and stop a debug
session
Basic debugging operations including GDB extension commands
7.2
Supported features for Linux platforms
The Intel® UDK Debugger Tool for Linux platforms helps in the use of GDB
to debug Intel® UEFI Development Kit 2010 (Intel® UDK2010) based
firmware running on an IA-32 processor. The Intel® UDK Debugger Tool
provides the host side software in binary form to support GDB remote
debugging across a null modem cable.
With the Intel® UDK Debugger Tool, it is possible to:
Debug source-level code using GDB with a host running a Linux OS.
Debug could begin as early as late SEC, after temporary RAM set up,
for the normal boot path.
Start debugging SMM (system management mode) code by stopping
the target at the next SMI (system management interrupt).
Use a null modem cable as a debug cable.
Set unresolved breakpoints (also known as pending breakpoints)
Debug code running on AP (additional processors)
Late attach
The following features are not yet supported for Linux platforms:
Use of a USB 2.0 debug cable (also known as a USB host-to-host
cable or USB 2.0 debug device)
41
7.2.1
Unresolved breakpoint setting in Linux
By design, GDB supports the unresolved breakpoint setting. However, the
end-user needs to recompile the GDB to include the Expat XML parsing
library since a pre-installed GDB does not include it. Using the GDB as preinstalled doesn’t block the other features.
Use “--target=x86_64-w64-mingw32 --with-expat” as the parameter to
configure the GDB before Make so it can use the Expat XML parsing
library. The library may be included in the end user’s Linux distribution or
downloaded from http://expat.sourceforge.net/
(gdb) source work/Debugger/Src/NewHost/GdbScript/edk2_gdb_script
##############################################################
# This gdb configuration file contains settings and scripts
# for debugging UDK firmware.
# Setting pending breakpoints is supported.
##############################################################
Figure 19
Output when sourcing udk-script
if GDB includes Expat XML parsing library
(gdb) source /opt/intel/udkdebugger/script/udk-gdb-script
##############################################################
# This gdb configuration file contains settings and scripts
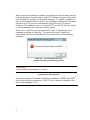
# for debugging UDK firmware.
# WARNING: Setting pending breakpoints is NOT supported!
# Load additional command!
##############################################################
Figure 20
42
Output when sourcing udk-script if GDB doesn’t include Expat XML
parsing library
(gdb) b PeiDispatcher
Function "PeiDispatcher" not defined.
Make breakpoint pending on future shared library load? (y or [n]) y
Breakpoint 1 (PeiDispatcher) pending.
(gdb) c
Continuing.
Breakpoint 1, PeiDispatcher (SecCoreData=0x7ffac, Private=0x7f548)
at
/home/ray/work/AllPackagesDev/MdeModulePkg/Core/Pei/Dispatcher/Dispatcher.c:623
623
{
Figure 21
7.3
Add the unresolved breakpoint in GDB
General debug flow
There are three general steps in the typical debug process:
1. Build the firmware image, including the source-level debug package
(provided by Intel). See Figure 22
CAUTION:
Each time the firmware image is rebuilt, the source-level debug package
must be included. If the debug package is not included, the Intel® UDK
Debugger Tool cannot be used to debug the target firmware. The files to
edit for the source-level debug package are included in the build image.
Those files ensure that the firmware build has debug capability until
debug-related changes are explicitly removed from the files.
2. Program the firmware image into flash memory on the target system.
3. Launch and debug on the host system with a debugger that includes
the functionality added by the Intel® UDK Debugger Tool.
43
Figure 22
Compiling a firmware image with the source-level debug package
The source-level debug package (provided by Intel) must be included in
the firmware build each time you compile the image.
7.4
Using the Linux/GDB debug solution
This discussion explains how to start, restart, and end a debug session.
7.4.1
Start a GDB debug session
Follow these steps to start a GDB debug session:
1. At the shell prompt, start the GDB server by entering the appropriate
command similar to the following:
foo@foo:~$ [/usr/bin/]udk-gdb-server
— The command line is a symbolic link to /opt/intel/udkdebugger/bin/udk-gdb-server.
— A message similar to the following should appear:
UDK GDB Server - Version 1.2
Waiting for the connection from the Target...
Debugging through serial port (/dev/ttyS0:115200:Hardware)
Redirect TARGET output to TCP port (20715).
2. Power up the target system. The system must include the Intel® UEFI
Development Kit 2010 (Intel® UDK2010)-based firmware image built
with the source-level debug package and it must have the debug
feature enabled.
3. Wait one or two seconds until the GDB server successfully connects to
the target debugger. A message similar to the following should appear.
44
The message indicates that the GDB server has successfully connected
and, in this example, is listening on TCP port 1234.
GdbServer on <HOST> is waiting for connection on port 1234
Connect with 'target remote <HOST>:1234'
4. GDB communicates with the target system via the GDB server. When
prompted by the GDB server, connect the GDB to the GDB server by
entering the following command in GDB:
— In the command line, replace <HOST> with the name of the target machine.
target remote <HOST>:1234
5. Run third-party terminal software to connect the terminal redirection
port to get the debug output and terminal output from the firmware.
6. Enter the following command in GDB to load the GDB extension for the
Intel® UDK Debugger Tool:
source /opt/intel/udkdebugger/bin/udk-gdb-script
— The GDB extension commands can now be used to begin debugging the target
firmware at the source level. Extension commands are described at the end of this
section.
7.4.2
Start a GDB debug session using late attach
1. Power up the target system. The system must include the Intel® UEFI
Development Kit 2010 (Intel® UDK2010)-based firmware image built
with the source-level debug package and it must have the debug
feature enabled.
— At the shell prompt, start the GDB server by entering the appropriate command similar
to the following:
foo@foo:~$ [/usr/bin/]udk-gdb-server
— This command line is a symbolic link to /opt/intel/udkdebugger/bin/udk-gdb-server.
— A message similar to the following should appear:
45
UDK GDB Server - Version 1.2
Waiting for the connection from the Target...
Debugging through serial port (/dev/ttyS0:115200:Hardware)
Redirect TARGET output to TCP port (20715).
GdbServer on <HOST> is waiting for connection on port 1234
Connect with 'target remote <HOST>:1234'
2. GDB communicates with the target system via the GDB server. When
prompted by the GDB server, connect the GDB to the GDB server by
entering the following command in GDB.
— In the command line, replace <HOST> with the name of the target machine.
target remote <HOST>:1234
3. Run third-party terminal software to connect the terminal redirection
port and get the debug and terminal output from the firmware.
4. Enter the following command in GDB to load the GDB extension for the
Intel® UDK Debugger Tool:
source /opt/intel/udkdebugger/bin/udk-gdb-script
The GDB extension commands can now be used to begin debugging the
target firmware at the source level. Extension commands are described at
the end of this section.
7.4.3
End the GDB debug session
To end a GDB debug session, follow these steps:
1. Halt the TARGET if the TARGET is running
2. In GDB, enter the quit command to end the debugging session.
(gdb) quit
A debugging session is active.
Inferior 1 [Remote target] will be detached.
Quit anyway? (y or n) y
qTStatus: Remote connection closed
user@user-Ubuntu11-64:~$
Figure 23
Detach in GDB
Closing GDB without running the “quit” command leaves the TARGET
firmware in an intermediate state and it cannot be reattached until
restarted.
46
7.5
Basic GDB debugging operations
The Intel® UDK Debugger Tool supports GDB operations for Linux
platforms, including these critical operations:
Embed a breakpoint in the source code.
Adding the CpuBreakpoint() statement to the source code allows the
GDB to enter interactive mode when the target executes the line.
Add a function breakpoint in a debug session.
As long as a module’s symbol file is loaded, use of the break
command to set a breakpoint for a function within the module is
permissible. Command syntax for the break command is:
break <function_name>
In the following example, a breakpoint is added to the
IoBitFieldRead16 function:
foo@foo:~$ break IoBitFieldRead16
7.5.1
GDB extension commands
The following extension commands add additional functionality to GDB to
assist debugging the target firmware. They are provided by the udk-gdbscript.
set smmentrybreak
set smmentrybreak on|off
Specify whether or not the debugger stops the target machine when
entering SMM.
set bootscriptentrybreak
set bootscriptentrybreak on|off
Specify whether or not the debugger stops the target machine before
executing boot script.
set resetdelay
set resetdelay <1~20>
Specify the delay the host system will wait to begin running again after the
target system resets.
47
cpuid
cpuid [Index] [SubIndex]
Retrieves CPUID information.
Options:
Index
Value of EAX priori to executing CPUID instruction (defaults to 1,
32-bit max, base 16)
SubIndex
Value of ECX priori to executing CPUID instruction (defaults to 0,
32-bit max, base 16)
resettarget
resettarget
Resets the target system.
refresharch
refresharch
Queries the target processor for the processor mode: i386 (IA32) or
i386x86-64 (x64).
The following four commands are only provided when GDB doesn’t support
setting an unresolved breakpoint.
info modules
info modules [ModuleName [ModuleName [...] ] ]
Lists information about the loaded modules or the specified module(s).
loadthis
loadthis
Loads the symbol file for the current IP (Internet protocol) address.
48
loadimageat
loadimageat <hex-address>
Loads the symbol file for the specified address.
loadall
loadall
Loads symbols for all loaded modules.
The commands below are executed with py prefix, for example, py pci.
py mmio
py mmio Adress Width [Value]
Access the memory mapped IO space.
Options:
Address
MMIO address to access.
Width
Access width 1, 2, 4 or 8.
Value
Content to write to the MMIO address when specified.
py pci
py pci [Bus [Dev [Func]]]
Display PCI device list or PCI function configuration space.
Usage: py pci [Bus [Dev [Func]]]
Options:
Bus
When only Bus is specified, it is the starting bus number for
enumeration; 0 by default if not specified. Otherwise the bus
number of the PCI device whose configuration space is to be
dumped.
49
Dev
Device number of the PCI device whose configuration space is to
be dumped.
Func
Function number of the PCI device whose configuration space is
to be dumped; 0 by default if not specified.
py mtrr
py mtrr
Dump the MTRR setting of current processor.
Usage: py mtrr
py DumpHobs
py DumpHobs [HobStartAddress]
Dump content of HOB list.
Usage: py DumpHobs [HobStartAddress]
Options:
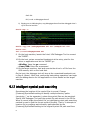
HobStartAddress
The start address of HOB list. The first HOB in the HOB list must
be the Phase Handoff Information Table (PHIT) HOB. When
HobStartAddress is not specified, HOB list will be got from EFI
Configuration Table and dumped.
py DumpVariable
py DumpVariable [VariableName]
Dump content of UEFI variable on flash.
Usage: py DumpVariable [VariableName]
50
Options:
VariableName
The name of variable. If a variable name is specified, the
contents of this variable will be dumped. If a variable name is
not specified, the contents of all UEFI variables on flash will be
dumped.
py DumpS3Script S3ScriptTableAddress
py DumpS3Script S3ScriptTableAddress
Dump content of S3 boot script.
Usage: py DumpS3Script [S3ScriptTableAddress]
Options:
S3ScriptTableAddress
The base address of S3 boot script table.
py ShowEfiDevicePath DevicePathAddress
py ShowEfiDevicePath DevicePathAddress
Convert UEFI device path to text.
Usage: py ShowEfiDevicePath DevicePathAddress
Options:
DevicePathAddress
The start address of UEFI device path.
7.5.1.1
Data Breakpoint
For Linux developers, three extension commands—iowatch, info
iowatchpoints, and delete iowatchpoints are available to add, show and
delete IO breakpoints. Note that they are not available in Windows
because, by design, GDB doesn’t use the IO concept.
51
(gdb) help iowatch
Set a watchpoint for an IO address.
Usage: iowatch/SIZE PORT
A watchpoint stops execution of your program whenever the
IO address is either read or written.
PORT is an expression for the IO address to Access.
SIZE letters are b(byte), h(halfword), w(word).
VALUE is an expression to write to the PORT.
(gdb) iowatch/b 0x80
IO Watchpoint 1: 80(1)
Figure 24
Add IO watch point in GDB
(gdb) help info iowatchpoints
Status of specified IO watchpoint (all watchpoints if no
argument).
(gdb) info iowatchpoints
Num
Port
Size
1
0x80
1
Figure 25
List IO watch point in GDB
(gdb) help delete iowatchpoints
Delete some IO watchpoints.
Argument is IO watchpoints number.
To delete all IO watchpoints, give no argument.
(gdb) delete iowatchpoints 1
Succeeded to delete IO watchpoint 1
Figure 26
52
Delete IO watch point in GDB
8
Known Limitations &
Issues for Linux platforms
8.1 Known limitations
The debug solution has these known limitations on a Linux platform:
Firmware output (through the debug channel) should not contain nonASCII characters.
Do not use more than three user-specified breakpoints in the SEC/PEI
phase since hardware breakpoints are used for code executing from
read-only memory.
Code occurring before the source-level debug package is initialized
cannot be debugged.
— This includes early SEC code, early SMM code, and other code.
During the SEC, PEI phases, only one processor (the BSP, or boot
strap processor) can be debugged.
— This also applies to the DXE phase before the Multiple Processor (MP) Services Protocol
is installed. While in the DXE phase, after the MP Services Protocol has been installed,
switching to other active processors (AP, or Additional Processors) is possible.
Debugging is not supported if the CPU is executing in 16-bit real
mode.
If the CPU is executing with interrupts disabled, breaks from the host
to the target are not supported.
When using the USB debug cable as the debug communication
channel, USB devices cannot be detected on any other USB ports
associated with the same EHCI controller.
— USB ports associated with other EHCI controllers are not impacted.
Only AP code invoked by the Platform Initialization Multiprocessor
Services Protocol can be debugged.
— For example, on EdkCompatibilityPkg-based platforms, AP code invoked through the
Framework Multiprocessor Services Protocol cannot be debugged.
53
54
9
9.1
Debug Tips
& Techniques
Introduction
The debugging tips and techniques described in this section generally apply
to both Windows and Linux systems. Any platform specific differences are
explained in the topic.
9.2
Terminal redirection
Terminal I/O can be redirected to a local TCP port (default port is 20715),
which can be connected to using a third-party terminal software such as
PuTTY, as shown below. The output from the TARGET firmware can be
redirected to the terminal software and the end-user input from the
terminal software can be redirected to the TARGET firmware.
Figure 27
Using PuTTY to connect to the terminal redirection port
55
When source level debug is enabled, the debugger uses the serial port for
command/packet communication, and PuTTY cannot connect to the serial
port because it’s already in use by the debugger. To enable the ability to
type in shell commands from PuTTY, the debugger redirects the firmware
output to the TCP port and redirects the input from the TCP port to
firmware. This enables a user to connect PuTTY to the TCP port for typing
in shell commands and viewing firmware output.
If the tool is unable to use the selected TCP Port, it displays an error
message as shown in Figure 28. To correct this issue, modify the
configuration file to use a different TCP port as shown in the following
example.
Figure 28
Error displayed when the
terminal redirection port cannot be opened
[Features]
TerminalRedirectionPort = 30000
Figure 29
Sample configuration for using 30000
as the terminal redirection port
The following figure illustrates the data flow between TARGET and HOST
from the end-user’s perspective. The TCP Port is actually created by the
Intel® UDK Debugger Tool.
56
TARGET
HOST
Debug Output
3rd party
terminal
software e.g.
PuTTY
TCP Port
Text Output
(Setup, Shell, etc.)
DebugAgent
Communication
Packet
UDK Debugger Tool
Figure 30
9.3
Data flow between TARGET and HOST
Trace
With Trace, the Intel® UDK Debugger Tool logs the debug output during
execution. When a tool issue occurs, the log can be sent back to the
developer for root causing.
Tracing is turned off by default. Enable it in your configuration file with the
following code snippet:
[Debug]
Trace=0x1f
The log file is located in the root of the current user’s home directory. For
example, with Windows XP*, the log file is in C:\Document and
Settings\<userid>\udk-debugger-trace.log.
For Windows 7*, the log file is in C:\Users\<userid>\udk-debuggertrace.log.
For Linux, the log file is in /home/<userid>/udk-debugger-trace.log.
Note that the log file is truncated to empty every time the Intel® UDK
Debugger Tool starts up and tracing is turned on.
9.4
CPU exception information
The Intel® UDK Debugger Tool automatically shows the vector number and
the error code whenever a CPU exception occurs in firmware.
If a CPU exception happens in firmware before the Intel® UDK Debugger Tool
attaches, the Intel® UDK Debugger Tool automatically shows the exception
information as soon as it attaches to the firmware. For the Linux version, the
57
exception information is shown after sourcing the GDB script.
(gdb) c
Continuing.
Program received signal SIGTRAP, Trace/breakpoint trap.
0x0000000037f36fa1 in ?? ()
=> 0x0000000037f36fa1: 48 8b 04 25 00 00 ff ff mov
rax,QWORD PTR ds:0xffffffffffff0000
Target encounters an exception: Vector = 14, Error Code =
00000000
Figure 31
9.5
Output in GDB when a CPU exception happens in firmware
Disabling optimization
Compiler optimization switches are often used to reduce the size of the
output file including the reduction of the debug information included in the
output file.
To include more debug information in the output file, add compiler tags in
the Components section of the DSC file.
For more information and an example of adding compiler tags, refer to
section 2.2.5. Additional configuration requirements.
9.6
Improving debugger productivity
The debug tool can be more effective if these features are used:
Set unresolved breakpoint
Adjust the PcdDebugPropertyMask to enable CpuBreakpoint()
on ASSERT() conditions.
9.7
Debugging SEC and PEI code
Most code for the SEC and PEI (pre-EFI initialization) phases executes
from read-only memory.
The Intel® UDK Debugger Tool automatically uses a hardware breakpoint if
it detects the address is within the read-only memory flash range.
58
Currently, the Intel® UDK Debugger Tool assumes the range from 4GB1MB to 4GB to be read-only.
9.8
Debugging DXE code
Some platform initialization firmware implementations execute SEC/PEI in
32-bit mode and execute DXE/SMM in 64-bit mode. When the Intel® UDK
Debugger Tool detects a mode switch from 32-bit mode to 64-bit mode (or
vice versa), WinDbg is automatically re-launched.
9.9
Debugging SMM code
The Intel® UDK Debugger Tool does not enable a timer interrupt in SMM to
look for a break in the request from the host. Instead, an
smmentrybreak command must be used to set a flag so that the next
entry into SMM will force the target to break into the debugger.
Breakpoints can be set after the target enters SMM mode and debugging
can continue. Refer to the discussion on WinDbg extension commands
later in this section for a brief description of the smmentrybreak
command.
When the target system stops at the SMM entry, the source code for SMM
handlers and set software breakpoints may be opened. Basic debug
operations may also be performed when the target system is stopped at
the SMM.
SMM context is not visible after exiting SMM.
9.10
Debugging Boot Script code on S3 path
The Intel® UDK Debugger Tool does not enable a timer interrupt during
executing Boot Script code on S3 path to look for a break in the request
from the host. Instead, a bootccriptentrybreak command must be used
to set a flag so that target will break into debugger tools before executing
Boot script code.
Breakpoints can be set when target breaks before executing Boot Script
code and debugging can continue. Refer to the discussion on WinDbg
extension commands later in this section for a brief description of the
bootccriptentrybreak command.
When the target system stops before executing boot script code, the
source code of
MdeModulePkg\Library\PiDxeS3BootScriptLib\BootScriptExecute.c could be
opened and set software breakpoints for specific OpCode in
59
S3BootScriptExecute().
Basic debug operations may also be performed from
then on.
9.11
Debugging a standalone module
loaded in a UEFI shell
The Intel® UDK Debugging Tool allows debugging of UEFI applications or
UEFI drivers that are loaded and executed in the UEFI shell environment
on the target, even if the target firmware does not include the source-level
debug feature. The source code and debug symbol files of the firmware
are not needed in order to use the Intel® UDK Debugging Tool.
For information about building a UEFI driver or UEFI application, refer to
“Compiling a UEFI Driver using the Intel® UEFI Development Kit 2010”,
available at http://www.intel.com/content/www/us/en/architecture-andtechnology/unified-extensible-firmware-interface/uefi-driver-and-application-toolresources.html.
This procedure also assumes that the source code of the UEFI driver
or application resides on the host machine.
To debug in the shell environment, follow these general steps:
1. Make sure the target machine has available debug port (Serial Port or
USB Debug Port)
2. Build DebugAgentDxe driver in SourceLevelDebugPkg. The build
command will vary depending on the debug port type:
Debug Agent for Serial Port (x64):
build -p SourceLevelDebugPkg\SourceLevelDebugPkg.dsc -m
SourceLevelDebugPkg/DebugAgentDxe/DebugAgentDxe.inf -a X64
Debug Agent for USB Debug Port (x64):
build -p SourceLevelDebugPkg\SourceLevelDebugPkg.dsc -m
SourceLevelDebugPkg/DebugAgentDxe/DebugAgentDxe.inf -a X64 D SOURCE_DEBUG_USE_USB
3.
3. Copy the Debug Agent (DebugAgentDxe.efi) to a USB drive. For x64, the
file is in the Build\SourceLevelDebugPkg\DEBUG_VS2008\X64\ directory
4. On the host system, build the UEFI application or UEFI driver to be
debugged and copy the executable output file (such as example.efi)
to the USB memory stick.
5. Remove the USB memory stick from the host and plug it into the target
system.
60
6. Power up the target machine and wait for the target to boot to the UEFI
shell.
7. Connect the debug cable between the target and host machines.
8. Start Debugging feature on target machine by following steps:
a) If debug port is Serial Port,
1. Get handle number of IsaSerialDxe:
Shell> Drivers
2. Find the handle number of serial port managed by IsaSerialDxe by IsaSerialDxe ’s
handle number:
Shell> dh –d AC
3. Disconnect the controller managed by IsaSerialDxe by serial port’s handle
number:
Shell> disconnect EF
4. Load DebugAgentDxe.efi from the USB memory stick
Shell> map –r
61
Shell> fs0:
fs0:\> Load –nc DebugAgentDxe.efi
b) If debug port is USB Debug Port, copy DebugAgentDxe.efi and the debugged driver’s
.efi file into the hard disk
Shell> map –r
Shell> copy fs1:\DebugAgentDxe.efi fs1:\example.efi fs0:
Shell> fs0:
fs0:\> Load DebugAgentDxe.efi
9. On the host machine, launch the Intel® UDK Debugger Tool to connect
the TARGET.
10.On the host, set an unresolved breakpoint at the entry point for the
driver or application and let the TARGET go:
WinDbg: Issue the go command
Linux/GDB: Enter the c command
11.On the target machine, load and execute the driver’s .efi file from the
USB memory stick or the hard disk.
On the host, the debugger tool will stop at the unresolved breakpoint set
in Step 6 (above). After that, performing basic debug operations can begin
with the debug session for the application or driver loaded on the target
machine.
9.12 Intelligent symbol path searching
Sometimes the location of the symbol files is moved. Change
[Features]/SymbolPath setting to identify multiple directory paths
(semicolon ‘;’ as the separator), where the symbol files can be searched.
Intel® UDK Debugger Tool gets the symbol file path stored in the PE file.
When it cannot locate the symbol file, an intelligent symbol path searching
method is used to find the correct symbol file path. That is, it attempts to
locate a file by prefixing each directory path specified by the
[Features]/SymbolPath setting to the original symbol file path read from
62
the PE file. Alternatively, if it cannot locate the file, it iteratively strips
parts from the head of the original symbol file path until it locates the
symbol file.
If it cannot locate the symbol file, the symbol file won’t be loaded. For
example:
The symbol file path stored in the PE file is:
J:\BuildRoot\MdeModulePkg\Application\HelloWorld\HelloWorld.pdb and it
is moved to C:\Users\foo\HelloWorld\HelloWorld.pdb. With the following
configuration setting:
[Features]
SymbolPath = C:\Users\foo
The following paths are tried until the symbol file is successfully located:
1) Original symbol file path:
J:\BuildRoot\MdeModulePkg\Application\HelloWorld\HelloWorld.pdb
2) Combination of [Features]/SymbolPath and the original symbol file
path:
C:\Users\fooJ:\BuildRoot\MdeModulePkg\Application\HelloWorld\HelloWorl
d.pdb
3) With “J:” stripped:
C:\Users\foo\BuildRoot\MdeModulePkg\Application\HelloWorld\HelloWorld.
pdb
4) With “\BuildRoot” stripped:
C:\Users\foo\MdeModulePkg\Application\HelloWorld\HelloWorld.pdb
5) With “\MdeModulePkg” stripped:
C:\Users\foo\Application\HelloWorld\HelloWorld.pdb
6) With “\Application” stripped: C:\Users\foo\HelloWorld\HelloWorld.pdb
9.13 Source code not available
In some cases, the source code and debug symbol files of the firmware
may not be available. If so, only the driver or application compiled from
the source code can be debugged.
When the source code and symbol files are not available, debug BIOS
firmware only at the assembly code level.
63
9.14 Restart the debug session
CAUTION:
Powering down the target machine while the Intel® UDK Debugger Tool is
running on the host machine is not supported and may produce
unpredictable results. Make sure to close the debugging session on the
host machine before powering down the target system.
Windows/WinDbg
Use the .reboot command to reset the target machine and restart
the debug session.
Linux/GDB
Use the resettarget GDB extension command to reboot the target
machine and restart a debug session.
9.14.1 Shifting to a different
architecture mode (32-bit vs. 64-bit)
Windows/WinDbg:
Automatic relaunch with a change in architecture.
In some cases, the .reboot command is issued in 64-bit mode but
the SEC/PEI is in 32-bit mode. If so, WinDbg will automatically
relaunch in order to continue debugging the 32-bit SEC/PEI code.
Linux/GDB:
Already supports changes in architecture. GDB supports changes in
architecture and does not need to be relaunched when a mode
changes between 32-bit and 64-bit.
NOTE: Do not set unresolved breakpoints in code that runs in a different
architecture mode, e.g., setting an unresolved breakpoint in a DXE module
when the TARGET is stopped in PEI phase. It may cause unpredicted
results.
64
Appendix A
Additional Information
A.1
TERMS
This user manual uses the following acronyms and terms.
AP
Additional processors
BAR
Base address register
BSP
Boot strap processor
COM
Communication
CS
Code segment
CSM
Compatibility support module
CPU
Central processing unit
DSC
The file extension for files containing information
used during the FDF build process.
Debugger package
A source-level debug package provided by Intel and required
during the BIOS build process. When building the target
firmware image, the source-level debugger package must be
included in each build in order to use the Intel® UDK Debugger
Tool to debug the target system. When included in the firmware
build, the target system has debug functionality (“target
debugger”).
65
Debug solution
The combination of tools and packages that provide debug
capability on both the host and target systems. This includes the
Intel® UDK Debugger Tool, the operating system (OS)-specific
debug tool (on the host system), and the source-level debug
package (on the target system).
DXE
Driver execution. The DXE phase initializes the rest
of the system hardware.
ECP
Intel® UEFI Development Kit 2010 (Intel® UDK2010)
compatibility platforms
EFI
Extensible Firmware Interface
EHCI
Extended (extensible) host controller interface
eXdi
A process that extends functionality to Microsoft WinDbg or other
Microsoft applications.
FDF
Firmware device file
FIFO
First in first out
GDB
GNU Project Debugger*
Host debugger:
The debug functionality on the host system. The host debugger
is a combination of the Intel® UDK Debugger Tool and the OSspecific debug tool.
IDT
Interrupt description table
Intel® UDK2010
Intel’s UEFI development kit.
66
Intel® UDK Debugger Tool
A debugger tool that adds functionality to an OS-specific debug
tool. For example, the Intel® UDK Debugger Tool adds
functionality to Microsoft Windows Debug Tool* (WinDbg) as well
as to the GNU Project debugger* (GDB) for Linux platforms.
IP
Instruction pointer
MP
Multiple processors
OS
Operating system
PCD
Platform configuration database
PCI
Peripheral component interconnect
PDB
Platform database—the file extension of the file containing
source-level debug information from Microsoft compilers.
(Linux compilers use a different extension.)
PE
PE/COFF execution
PE/COFF
Portable executable and object file format
PEI
Pre-EFI initialization. The PEI phase finishes initializing
the CPU, makes permanent RAM (such as normal DRAM)
available. It then determines the boot mode (such as normal
boot, ACPI S3 resume from sleep, or ACPI S4 resume
from hibernation).
PEIM
Pre-EFI initialization module
RAM
Random access memory
67
SEC
Security. The security (SEC) phase brings the system out
of CPU reset and makes temporary RAM available for the
stack and for data storage.
SecCore
During the SEC (security) phase of execution, the SecCore
are the common functions across all platform implementations
of the Intel® UDK 2010 based firmware.
SMI
System management interrupt
SMM
System management mode
Target debugger
The debugger functionality on the target system. This
functionality is part of a BIOS image that has been built with the
Intel-provided source-level debugger package.
TE
Terse execution. This image format is a reduction in size
of PE (PE/COFF execution). Note that the PE image format has
a large header portion that the TE image format trims
significantly.
UDK
UEFI Development Kit
UEFI
Unified Extensible Firmware Interface
A.2
Conventions used in this document
This document uses the following conventions for code samples and
typographic differentiation.
A.2.1
Nomenclature of CPU architectures
This user manual refers to the following architectures:
Intel IA32 refers to Intel’s 32-bit processor architecture.
Intel x64 refers to Intel’s 64-bit superset of IA32.
Intel IA-64 refers to the Intel® Itanium® Platform Architecture (Intel
IPF).
68
A.2.2
Pseudo-code conventions
Pseudo code is presented to describe algorithms in a more concise form.
None of the algorithms in this document are intended to be compiled
directly. The code is presented
at a level corresponding to the surrounding text.
In describing variables, a list is an unordered collection of homogeneous
objects. A queue is an ordered list of homogeneous objects. Unless
otherwise noted, the ordering is assumed to be first-in-first-out (FIFO).
Pseudo code is presented in a C-like format, using C conventions where
appropriate.
The coding style, particularly the indentation style, is used for readability
and does not necessarily comply with an implementation of the UEFI
specification.
A.2.3
Typographic conventions
This document uses the typographic and illustrative conventions described below:
Plain text
Plain text (blue)
The normal text typeface is used for the vast majority of
the descriptive text in a specification.
In the electronic version of this specification, any plain
text, under-lined and in blue, indicates an active link to
the cross-reference.
Bold
In text, a Bold typeface identifies a processor register
name. In
other instances, a Bold typeface is used as a running
head within
a paragraph or to emphasize a critical term.
Italic
In text, an Italic typeface can be used as emphasis to
introduce a new term or to indicate the title of
documentation such as a user’s manual or name of a
specification.
Monospace
Italic Monospace
Computer code, example code segments, pseudo code,
and all prototype code segments use a BOLD
Monospace typeface with a dark red color. These code
listings normally appear in one or more separate
paragraphs, though words or segments can also be
embedded in a normal text paragraph.
In code or in text, words in Italic Monospace indicate
placeholder names for variable information (i.e.,
arguments) that must be supplied.
69
A.2.4
Other conventions
This user manual also uses the following convention for Linux examples:
foo@foo:~$
A.3
A user-defined command prompt for Linux-based command lines
used in the examples in this manual.
For more information
UEFI Specification:
Information about UEFI device types and status codes can be found in
the Unified Extensible Firmware Interface, version 2.3.1 or later, and
at the UEFI Forum , www.uefi.org. A summary of UEFI services and
GUIDs can be found in the Doxygen-generated help documents for the
MdePkg in the Intel® UDK 2010 releases.
tianocore.org:
The Intel® UDK 2010 source files and specifications are available at
www.tianocore.org (http://tianocore.sourceforge.net).
UEFI Driver Writers Guide:
Refer to the UEFI Driver Writer’s Guide for key descriptions of how to
implement UEFI requirements as well as recommendations for writing
drivers. This guide is now available at www.tianocore.org
(http://tianocore.sourceforge.net).
UEFI Development Kit 2010 (UDK2010):
This open-source kit provides the modern, feature-rich, cross-platform
firmware development environment for the UEFI and PI specifications.
The Intel® UDK2010 is a stable release of this open-source kit and
has been validated on a variety of Intel platforms, operating systems,
and application software. It is available for download at
www.tianocore.org (http://tianocore.sourceforge.net).
70