1
INTEL® UEFI Development Kit
Debugger Tool User Manual
September 2010
Revision 1.0
Version 1.0
INFORMATION IN THIS DOCUMENT IS PROVIDED IN CONNECTION WITH INTEL® PRODUCTS. NO LICENSE, EXPRESS OR IMPLIED, BY
ESTOPPEL OR OTHERWISE, TO ANY INTELLECTUAL PROPERTY RIGHTS IS GRANTED BY THIS DOCUMENT. EXCEPT AS PROVIDED IN
INTEL’S TERMS AND CONDITIONS OF SALE FOR SUCH PRODUCTS, INTEL ASSUMES NO LIABILITY WHATSOEVER, AND INTEL DISCLAIMS
ANY EXPRESS OR IMPLIED WARRANTY, RELATING TO SALE AND/OR USE OF INTEL PRODUCTS INCLUDING LIABILITY OR WARRANTIES
RELATING TO FITNESS FOR A PARTICULAR PURPOSE, MERCHANTABILITY, OR INFRINGEMENT OF ANY PATENT, COPYRIGHT OR OTHER
INTELLECTUAL PROPERTY RIGHT. Intel products are not intended for use in medical, life saving, or life sustaining applications.
Intel may make changes to specifications and product descriptions at any time, without notice.
Designers must not rely on the absence or characteristics of any features or instructions marked "reserved" or "undefined." Intel reserves
these for future definition and shall have no responsibility whatsoever for conflicts or incompatibilities arising from future changes to them.
The Intel® UEFI Development Kit Debugger Tool may contain design defects or errors known as errata which may cause the product to
deviate from published specifications. Current characterized errata are available on request.
Contact your local Intel sales office or your distributor to obtain the latest specifications and before placing your product order.
Intel, Intel® UEFI Development Kit Debugger Tool and the Intel logo are trademarks or registered trademarks of Intel Corporation or its
subsidiaries in the United States and other countries.
*Other names and brands may be claimed as the property of others.
Copyright © 2010, Intel Corporation. All rights reserved.
September 2010
ii
Contents
1
Document Conventions ......................................................................................1
1.1.1
1.1.2
2
Introduction .....................................................................................................3
2.1
3
Debugging SEC and PEI code ................................................................. 13
Debugging DXE code ............................................................................ 13
Debugging SMM code............................................................................ 13
Re-start the debug session .................................................................... 13
WinDbg Extension Commands ................................................................ 14
Enable Debug Solution on New Platform ............................................................. 15
5.1
5.2
6
Compile Firmware Image with TARGET Debug Agent ...................................7
Install HOST side software.......................................................................7
Set up Debug Connection between HOST and TARGET .................................8
Start a debug session .............................................................................9
Basic Debugging Operations................................................................... 11
End the debug session .......................................................................... 11
More Debug Techniques ................................................................................... 13
4.1
4.2
4.3
4.4
4.5
5
Basic Debugging Flow .............................................................................4
2.1.1
Compile ...................................................................................4
2.1.2
Program...................................................................................4
2.1.3
Launch ....................................................................................4
Quick Start ......................................................................................................7
3.1
3.2
3.3
3.4
3.5
3.6
4
Pseudo-code conventions ...........................................................1
Typographic conventions ............................................................1
Set up for TARGET Machine ................................................................... 15
5.1.1
Select libraries instances in DSC file........................................... 15
5.1.2
Reserve a serial port for debug usage (if using serial cable)........... 17
5.1.3
Configurations for USB 2.0 debug .............................................. 17
5.1.4
Adjust tool options and image format for the interested modules.... 18
5.1.5
Update CPU driver on ECP-based platforms ................................. 20
5.1.6
Build image and update flash .................................................... 21
Set up for HOST machine ...................................................................... 21
Known Limitations and Issues ........................................................................... 22
6.1
6.2
Known Limitations:............................................................................... 22
Known Issues ...................................................................................... 22
Tables
Table 1 Debug Agent Library Instances by Module Type........................................ 15
Table 2 Bit Layout ........................................................................................... 18
Version 1.0
iii
Figures
Figure
Figure
Figure
Figure
Figure
Figure
Figure
1
2
3
4
5
6
7
- Cable connection between the TARGET and HOST machines......................3
- Compiling firmware image with debug agent ..........................................4
- Debug session active components .........................................................5
- A WinDbg start launch window .............................................................9
- TARGET stopped at late SEC phase ..................................................... 10
– Example macro (using a serial cable) .................................................. 16
- Example macro (using a USB 2.0 debug cable) ..................................... 17
September 2010
iv
Revision History
Revision
Number
1.0
Version 1.0
Description
Initial release
Revision
Date
September,
2010
v
1
Document Conventions
This document uses the typographic and illustrative conventions described below.
1.1.1
Pseudo-code conventions
Pseudo code is presented to describe algorithms in a more concise form. None of the
algorithms in this document is intended to be compiled directly. The code is presented at a
level corresponding to the surrounding text.
In describing variables, a list is an unordered collection of homogeneous objects. A queue is
an ordered list of homogeneous objects. Unless otherwise noted, the ordering is assumed to
be First In First Out (FIFO).
Pseudo code is presented in a C-like format, using C conventions where appropriate. The
coding style, particularly the indentation style, is used for readability and does not necessarily
comply with an implementation of the Extensible Firmware Interface Specification.
1.1.2
Typographic conventions
This document uses the typographic and illustrative conventions described below:
Plain text
The normal text typeface is used for the vast majority of the descriptive
text in a specification.
(Body)
Plain text [blue]
Any plain text that is underlined and in blue indicates an active link to the
cross-reference. Click on the word to follow the hyperlink.
(Cross-Reference)
Bold
(Bold or
GlossTerm)
Italic
BOLD Monospace
(CodeCharacter
and
CodePargraph)
Bold Monospace
Version 1.0
In text, a Bold typeface identifies a processor register name. In other
instances, a Bold typeface can be used as a running head within a
paragraph. or as a definition heading (GlossTerm)
In text, an Italic typeface can be used as emphasis to introduce a new
term or to indicate a manual or specification name.
Computer code, example code segments, and all prototype code
segments use a BOLD Monospace typeface with a dark red color. These
code listings normally appear in one or more separate paragraphs,
though words or segments can also be embedded in a normal text
paragraph.
Words in a Bold Monospace typeface that is underlined and in blue
indicate an active hyperlink to the code definition for that function or
type definition. Click on the word to follow the hyperlink.
1
Italic
Monospace
(ArgCharacter,
ArgCharacter+
and
ArgParagraph)
Plain Monospace
(CodeCharacter
+ Not Bold)
In code or in text, words in Italic Monospace indicate placeholder names
for variable information that must be supplied (i.e., arguments).
Arguments or Parameters in a CodePargraph should use
ArgCharacter+ (to prevent Parameters being in bold).
ArgCharacter is fine for
In code, words in a Plain Monospace typeface that is a dark red color
but is not bold or italicized indicate pseudo code or example code. These
code segments typically occur in one or more separate paragraphs.
September 2010
2
2
Introduction
The target audience for the Intel® UEFI Development Kit Debugger Tool User Manual is the
advanced user – a developer with a solid understanding of EDK II and all of its ancillary
subjects.
In conjunction with Microsoft® Windows® Debug Tool (WinDbg) the Intel® UEFI Development
Kit Debugger Tool (Intel® UDK Debugger Tool) provides the developer with an ability to debug
UDK based firmware on UEFI IA-32 and UEFI x64 platforms. The target side component
(debug agent) is “SourceLevelDebugPkg” under the EDK II project maintained on
http://www.TianoCore.org.
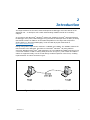
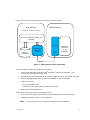
Debug configuration requires two machines: a TARGET and a HOST. The TARGET contains the
UDK firmware to be debugged. The HOST is a Microsoft® Windows® XP (SP3) platform
executing WinDbg and the Intel® UDK Debugger Tool. The TARGET and HOST interconnect via
a serial null modem or USB 2.0 debug cable (as shown in Figure 1). Null modem and USB 2.0
cables are supported today, but the overall design enables expansion in the future, enabling
implementation of custom connection types.
Figure 1 - Cable connection between the TARGET and HOST machines
Version 1.0
3
2.1
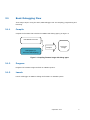
Basic Debugging Flow
Three major steps in using the Intel® UDK Debugger Tool are compiling, programming and
launching.
2.1.1
Compile
Compile the firmware that includes the TARGET side debug agent, per Figure 2:
UDK Based Firmware
Firmware
Image
Compile
DebugAgent (in
SourceLevelDebugPkg)
Figure 2 - Compiling firmware image with debug agent
2.1.2
Program
Program the firmware image into flash on TARGET system.
2.1.3
Launch
Launch a debugger on HOST to debug the firmware on TARGET system.
September 2010
4
Figure 3 shows how the components interact during a debug session:
Host Machine
Target Machine
(Microsoft® Windows® XP-SP3)
Microsoft® Windows® Debug Tool
(WinDbg)
Debug
PDB File
and Source
Intel® UDK
Debugger
Tool
Agent
UDK based
Firmware
(to be
debugged)
Figure 3 - Debug session active components
The Intel® UDK Debugger Tool supports the following:
Source level debugging using Microsoft® Windows® Debug Tool (WinDbg) - host
running Microsoft® Windows® XP (SP3)
Debugging as early as late SEC (after temporary RAM set up) for the normal boot path
Starting debugging SMM code by requesting TARGET to stop at next SMI
Cable interconnect:
Serial null modem cable
USB host to host cable (USB 2.0 debug device cable)
Setting unresolved breakpoints
The following sections provide a brief introduction for:
How to set up the debug environment and start debugging UDK based firmware
Enabling the debug feature on a new platform
Note:
Version 1.0
The reader must have a working knowledge of UDK and WinDbg.
5
September 2010
6
3
Quick Start
The following section briefly introduces the reader to the Intel® UDK Debugger Tools. In some
sections, the OVMF (Open source Virtual Machine Firmware) platform implementation
(available from the EDK II project in http://www.TianoCore.org) is used as an example to
demonstrate the debug process.
3.1
Compile Firmware Image with TARGET Debug Agent
Building a firmware image for a platform which has already enabled the source level debug
feature, simply append the “-D <MacroName> to the end of the build command line where
“MacroName” is the name of the macro which controls enables (turns on) or disables (turns off)
the source level debug feature. An example macro name might be “SOURCE_DEBUG_ENABLE”.
The name may be different on different platforms.
For example, using the OVMF platform the following command would be used to compile the
firmware image with TARGET debug agent:
build -D SOURCE_DEBUG_ENABLE
Refer to the OVMF wiki page at
http://sourceforge.net/apps/mediawiki/tianocore/index.php?title=OVMF_FAQ for general
instructions on building and booting the OVMF image.
3.2
Install HOST side software
The following are required to debug with the Intel® UDK Debugger Tool:
Microsoft® Windows® XP (32-bit, with Service Pack 3)
Microsoft® Windows® Debug Tool (WinDbg) 6.11.0001.404 X86 available for
download at: http://www.microsoft.com/whdc/devtools/debugging/default.mspx
It is recommended that WinDbg be installed at the default path (C:\Program Files\Debugging
Tools for Windows (x86)). Otherwise the configuration file for Intel® UDK Debugger Tool must
be edited so as it points to the correct WinDbg path. See section 4.2 for details.
Once the Intel® UEFI Development Kit Debugger Tool has been downloaded, run the
application: “Intel(R)_UDK_Debugger_Tool.exe”. Follow the installer instructions to complete
the installation process.
Missing DLL files on the HOST machine (e.g. MSVCP71.dll) may be reported. Needed runtime
DLL files for Microsoft® Visual Studio® C++ are located in the Microsoft® .NET Framework
Version (1.1) Redistribution Package, downloadable from Microsoft®
Version 1.0
7
(http://www.microsoft.com/downloads/details.aspx?FamilyId=262D25E3-F589-4842-8157034D1E7CF3A3&displaylang=en )
3.3
Set up Debug Connection between HOST and TARGET
The HOST and the TARGET machines must be interconnected with a debug cable dependent
upon the TARGET firmware configuration. Refer to chapter 4 for details on selecting the
correct debug cable type and which port to use on the TARGET.
The OVMF platform works on a virtual machine, and may be chosen so as to use virtual COM
to COM connections. Refer to OVMF wiki pages on tips of setting up COM connections between
HOST and TARGET
(http://sourceforge.net/apps/mediawiki/tianocore/index.php?title=OVMF_FAQ ).
Before using the Intel® UDK Debugger Tool, the settings must be configured correctly. This is
done by editing the SoftDebugger.ini file in the Intel® UDK Debugger Tool. Once the tool has
been successfully installed, bring up the SoftDebugger.ini file by starting from Windows Start > All Programs -> Intel UDK Debugger Tool -> Change Configurations. A text file will be
opened. If necessary, edit the text file to ensure it lists the correct debug port used by the
HOST, and the flow control. In the OVMF example, flow control should be disabled (turned off)
as shown in the following code fragment:
[Debug Port]
Port = COM6
FlowControl = 0
September 2010
8
3.4
Start a debug session
Please follow the following steps to start a Microsoft® Windows® Debug Tool (WinDbg)
session:
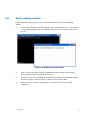
1.
Launch “Start WinDbg using UDK Debugger Tool” from Windows Start -> All Programs
-> Intel UDK Debugger Tool. Two windows similar to the ones shown in Figure 4 will
pop up
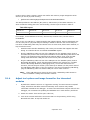
Figure 4 - A WinDbg start launch window
2.
Start up the target system using the UDK based firmware image with the debug
feature enabled (within 30 seconds after step 1);
3.
If OVMF is used, refer to README under OvmfPkg on details to launch OVFM platform.
Be sure to specify a serial port that you desire to connect with HOST.
4.
Wait two or three seconds, until WinDbg is connected and is ready to accept
commands;
Version 1.0
9
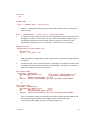
At this time, the Microsoft® Windows® Debug Tool (WinDbg) should stop the TARGET at late
SEC phase, and loaded the symbols for SecCore. WinDbg will show the source code similar to
the example shown in the following figure:
Figure 5 - TARGET stopped at late SEC phase
The WinDbg will show the current source code, and the statement to be executed is
highlighted - the layout might be different on different machines. A standard console window
(titled ...\SoftDebugger.exe, while "..." is the path of the installation path) is visible to the
user to display serial debug output from the TARGET machine.
A developer can configure Microsoft® Windows® Debug Tool (WinDbg) settings or set
breakpoints and then click "go" in the WinDbg tool bar to have the TARGET resume execution.
When the TARGET execution encounters a breakpoint, WinDbg will enter interactive mode
(ready to accept commands) automatically. In addition, the corresponding source code will be
loaded to source window. A developer can also choose to click "break" on the WinDbg tool bar
to break the execution.
Note:
The TARGET image is still able to run without a HOST side debugger. It will
pause for a few seconds time to detect the existence of a debug HOST, and
performs a normal boot if a timeout occurs. The HOST side debugger attaching to
the TARGET after a normal boot is not supported.
September 2010
10
3.5
Basic Debugging Operations
When TARGET reaches a breakpoint or stops after the user issues a "break" command, the
debugger loads the source of the current module, as well as all other modules that have
executed (if possible or applicable).
The following commands may be issued in the Microsoft® Windows® Debug Tool (WinDbg) to
complete basic debug operations:
3.6
Open source code and set/clear breakpoints.
Open disassembly window to see instructions around current IP.
Open memory window to read or write memory. Note that in order to prevent a
system hang, on some platforms, 0-128M memory access before physical memory is
ready will not actually go to TARGET. Dummy data is displayed instead. The filtering is
disabled during the transition from Pre-Memory to Post-Memory PEI. Note that OVMF,
for example, has memory functional from reset and displays real contents.
Open local variable window to read or write local variables and function parameters.
The /Od compiler option ensures all local variables shown. At optimization levels above
/Od, locals optimized into registers are not visible, while locals that are stored on the
stack may still been seen. The same conditions apply to parameters passed into a
function.
Open register window to read/write general purpose registers.
Open call stack window to see the call stack - parameter names/values can be seen as
well.
Issue "step into", "step over", and "go" commands to have TARGET to execute. On
multiple processor systems, "step into" and "step over" will only cause 1 processor to
execute (leaving other processors at stopped state), while "go" will cause all
processors to start execution.
Issue the "break" command while TARGET is running to break in. On multiple
processor systems, all active processors will be stopped.
Open Processes and Threads window to view and set current processor. On multiple
processor systems, each logical processor is emulated as a thread.
The Watch Window can be used to look at global variables (i.e. gBS, gST, gRT, gDS).
End the debug session
To end a debug session, close the WinDbg main window, as well as the SoftDebugger console
window.
Version 1.0
11
September 2010
12
4
More Debug Techniques
4.1
Debugging SEC and PEI code
Most of the code for SEC and PEI phase executes from read-only memory. The Intel® UDK
Debugging Tool automatically uses a hardware breakpoint if it detects the address is within
the read-only memory flash range. Currently, the Intel® UDK Debugging Tool assumes the
range from 4GB-1MB to 4GB to be read-only.
4.2
Debugging DXE code
Some PI firmware implementations execute SEC/PEI in 32-bit mode and DXE/SMM in 64-bit
mode. When the UEFI Debugger Tool detects a mode switch from either 32-bit mode to 64-bit
mode (or from 64-bit mode to 32-bit mode), the Microsoft® Windows® Debug Tool (WinDbg) is
automatically re-launched.
4.3
Debugging SMM code
The UDK Debugger Tool does not enable a timer interrupt in SMM to look for a break in
request from the HOST. Instead, the smmentrybreak command must be used to set a flag so
the next entry into SMM will force the TARGET to break into the debugger. The
smmentrybreak switch must be set to inform the TARGET whether it should stop the next time
it enters SMM mode. Breakpoints can be set after the TARGET enters SMM mode and
debugging can continue. Refer to Section 4.5 (WinDbg Extension Commands) for a format
description of the smmentrybreak command.
When the TARGET stops at the SMM entry, the source for SMM handlers may be opened, and
software breakpoints may be set. As mentioned earlier in this document, basic debug
operations may also be performed when the TARGET is stopped at SMM mode. SMM context is
not visible after exiting the SMM mode.
4.4
Re-start the debug session
The .reboot command can be used to reset the TARGET and re-start the debug session.
Powering off the TARGET while the Intel® UDK Debugger Tool is running is not supported and
may produce unexpected results. If the .reboot command is issued in 64-bit mode but the SEC
is in 32-bit mode, the Microsoft® Windows® Debug Tool (WinDbg) will automatically be relaunched to continue debugging the 32-bit SEC/PEI code.
Version 1.0
13
4.5
WinDbg Extension Commands
Several extension commands to WinDbg are provided to support debugging the firmware. The
following command will load the extension:
.load %INSTALL_PATH%\WinDbg\edk2.dll
Here, the %INSTALL_PATH% is where the Intel® UDK Debugger Tool is installed. By default,
it is at c:\Program Files\Intel\Intel UDK Debugger Tool.
Below are the extension commands in edk2.dll:
smmentrybreak [1|0]
Controls whether target should stop the next time SMM mode is entered. Set it to “1” to have
target stop on next SMM entry, and set it to “0” not to stop on the next SMM entry.
resetdelay <time in second>
Control the time between TARGET (more exactly, debug agent) reset and the WinDbg session
set up. A typical scenario of setting the resetdelay value to non-0 value is a platform setting
up a timer and not clearing it in early SEC, leading to a hardware reset that will interfere with
a debug session. Setting the resetdelay to a value larger than the timer timeout value (usually
10 seconds is enough) may resolve this problem.
Choosing to move logic to clear the timer to early SEC avoids the need to delay for each
reboot.
September 2010
14
5
Enable Debug Solution on New
Platform
5.1
Set up for TARGET Machine
The firmware in the TARGET machine should contain the proper debug agent implementation
to support debugging. The Platform DSC/FDF file may have to be updated to choose the
proper library instances as well as configuring a serial port or USB debug port for debug.
Adjusting compiler options and adding CpuBreakpoint() to the modules of interest may result
in a better debug experience. Also, adjusting PcdDebugPropertyMask to enable
CpuBreakpoint() on ASSERT() conditions helps.
When making changes to DSC/FDF file, it is recommended to define a macro to allow for
conditional turn on of the debug feature. An example (using macro
"SOURCE_DEBUG_ENABLE") is shown at the end of the next section.
5.1.1
Select libraries instances in DSC file
5.1.1.1
Debug Agent Library
There are three Debug Agent Library instances for different type of modules. Developers
should use the correct library instance to replace the NULL instances. Please refer to the table
below:
Table 1 Debug Agent Library Instances by Module Type
Module Type
Debug Agent Library Instance
SEC or PEI modules
SourceLevelDebugPkg/Library/DebugAgent/SecPeiDebugAgentLib.inf
DxeCore and DXE
modules
SourceLevelDebugPkg/Library/DebugAgent/DxeDebugAgentLib.inf
SMM modules
SourceLevelDebugPkg/Library/DebugAgent/SmmDebugAgentLib.inf
Note:
Because Debug Agent Library consumes Debug Library, a proper Debug
Library instance should be selected for modules in DSC file, including SEC module.
Version 1.0
15
5.1.1.2
Debug Communication Library
As the non-null Debug Agent library instances consume the Debug Communication Library,
one of the library instances given below should be selected:
SourceLevelDebugPkg/Library/DebugCommunicationLibSerialPort/DebugCommunicatio
nLibSerialPort.inf
This library instance should be used if the HOST and TARGET are using the serial
connection. It depends on SerialPort library, so a proper SerialPort library instance
should be specified for all modules depending on this library instance
SourceLevelDebugPkg/Library/DebugCommunicationLibUsb/DebugCommunicationLibU
sb.inf
This library instance should be used if the HOST and TARGET are using a USB2.0
debug cable connection.
5.1.1.3
PeCoffExtraAction Library
For all modules depending on PeCoffExtraAction library class, the below library instance should
be selected:
SourceLevelDebugPkg/Library/PeCoffExtraActionLibDebug/PeCoffExtraActionLibDebug.i
nf
This library instance is invoked every time a module is loaded or unloaded, and is
responsible for informing the HOST that the TARGET has loaded or unloaded a module.
5.1.1.4
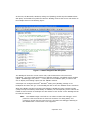
Turning Debug on or off
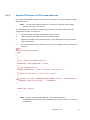
The followings are sample code fragments in [LibraryClasses] section that demonstrate using a
macro to more easily turn on or off the debug feature.
[LibraryClasses]
!ifdef $(SOURCE_DEBUG_ENABLE)
PeCoffExtraActionLib|SourceLevelDebugPkg/Library/PeCoffExtraActionLibDebug/PeCoffExtraActionLibDebug.inf
DebugCommunicationLib|SourceLevelDebugPkg/Library/DebugCommunicationLibSerialPort/DebugCommunicationLibSerialPort.inf
DebugAgentLib|SourceLevelDebugPkg/Library/DebugAgent/SecPeiDebugAgentLib.inf
!else
PeCoffExtraActionLib|MdePkg/Library/BasePeCoffExtraActionLibNull/BasePeCoffExtraActionLibNull.inf
DebugAgentLib|MdeModulePkg/Library/DebugAgentLibNull/DebugAgentLibNull.inf
!endif
Figure 6 – Example macro (using a serial cable)
September 2010
16
[LibraryClasses]
!ifdef $(SOURCE_DEBUG_ENABLE)
PeCoffExtraActionLib|SourceLevelDebugPkg/Library/PeCoffExtraActionLibDebug/PeCoffExtraActionLibDebug.inf
DebugCommunicationLib|SourceLevelDebugPkg/Library/DebugCommunicationLibUsb/DebugCommunicationLibUsb.inf
DebugAgentLib|SourceLevelDebugPkg/Library/DebugAgent/SecPeiDebugAgentLib.inf
!else
PeCoffExtraActionLib|MdePkg/Library/BasePeCoffExtraActionLibNull/BasePeCoffExtraActionLibNull.inf
DebugAgentLib|MdeModulePkg/Library/DebugAgentLibNull/DebugAgentLibNull.inf
!endif
Figure 7 - Example macro (using a USB 2.0 debug cable)
5.1.2
Reserve a serial port for debug usage (if using serial cable)
DebugCommunicationLibSerialPort library instance consumes Serial Port Library. In addition to
choosing the Serial Port Library applicable to the TARGET platform, the serial port parameters
must be configured to matching the HOST. For most cases, it is recommended to set baud rate
to 115200 and Flow Control to TRUE.
If the platform specific Serial Port library does not support hardware flow control, flow control
on the HOST side should be turned off.
Some platform-specific Serial Port Library instances may not enable receive and transmit FIFO.
This prevents the debug solution from working correctly, so it should be fixed prior to using
this debugger tool.
If the serial port is used by the console then the TerminalDxe module will read input
characters from the serial port. This creates a conflict with the debug agent. One method to
prevent the serial port from being used as the console is to remove the TerminalDxe module
from the platform FDF file, for example:
[FV.DXEFV]
...
!ifndef $(SOURCE_DEBUG_ENABLE)
INF MdeModulePkg/Universal/Console/TerminalDxe/TerminalDxe.inf
!endif
...
5.1.3
Configurations for USB 2.0 debug
DebugCommunicationLibUsb library instance requires several PCDs to be configured correctly.
The default value provided by the SourceLevelDebugPkg should work for most cases but
developer may need to adjust their value in some cases.
gEfiSourceLevelDebugPkgTokenSpaceGuid.PcdUsbDebugPortMemorySpaceBase
gEfiSourceLevelDebugPkgTokenSpaceGuid.PcdUsbEhciMemorySpaceBase
The two PCDs above are to specify the base address for the memory mapped IO (BAR) for the
ECHI controller and USB debug port, as the debug agents runs early in SEC. The developer
Version 1.0
17
needs to ensure these t memory ranges not conflict with memory ranges assigned to other
devices (as well as physical memory).
gEfiSourceLevelDebugPkgTokenSpaceGuid.PcdUsbEhciPciAddress
This PCD specifies the PCI address (Bus, Device, and Function) of the EHCI controller, on
which resides the debug port to be used for debug. The bit layout is shown in Table 2:
Table 2 Bit Layout
Bits 28~31
Bits 20~27
Bits 15~19
Bits 12~14
Bits 00~11
0
Bus Number
Device Number
Function Number
0
For example, for PCI address at bus 0x0, device 0x1D, function 0x07, the PCD value is
0x000EF000.
There is only one USB port in 1 EHCI controller that supports debug. Some motherboard may
not wire this port to a physical USB port making it difficult to discover the correct USB port
into which a USB debug cable may be inserted. Here are some tools, best-known methods, to
help resolve this issue:
Read the EHCI controller datasheet; find out the port number that supports the USB
debug. It is listed at bit 20~23 of EHCI HCSPARAMS register.
Plug the USB debug cable into one of the USB ports on the TARGET system, boot to
the UEFI shell; find out the device path information of the USB debug cable device and
check if it is plugged into the USB port that supports debug. If not, plug the USB
debug cable into another USB port and see the device path information again.
Plug the USB debug cable into one of the USB ports on the TARGET system, boot to
Microsoft® Windows®, launch the Microsoft® UsbView tool (usbview.exe, included
with the Microsoft® Windows ® Debugging Tools). Look at the USB device tree
structure; find out the port number (count from top to bottom) for the parent node of
the USB debug cable device. If the port number is not the one supporting USB debug,
plug the USB debug cable into another USB port until a match is found.
Note:
If the USB debug port cannot be found, then a USB debug cable cannot be
used to establish a debug communication channel.
5.1.4
Adjust tool options and image format for the interested
modules
1.
By default the GenFw tool turns on "aggressive zeroing" for some sections in PE/Coff
image, which does not affect module functionality. Such sections may contain
information needed for the debugger. To ensure the stack frame analysis works for the
debugger, we recommend to updating the BuildRules.txt in Conf directory as follows:
a.
Search for GenFw. There will be quite a few hits;
b.
Look at the context and find the occurrence that is to be processing .dll file using
Microsoft tool chain. It may look similar to:
September 2010
18
<InputFile>
?.dll
...
<Command.MSFT, ...>
...
GenFw -e $(MODULE_TYPE) -o ${dst} ${src}
...
c.
Append "--keepexceptionTable" option to the GenFw command line, to make the line
look like below:
GenFw -e $(MODULE_TYPE) -o ${dst} ${src} --keepexceptionTable
2.
A compiler may be configured to turn on some optimization, which makes source level
debugging not obvious. A developer may also choose to add certain compiler tags in
[Components] Section for the interested modules in DSC file, to make the code
generated by compiler be more "conventional". Take DxeCore as an example:
[Components.IA32]
...
MdeModulePkg/Core/Dxe/DxeMain.inf {
...
<BuildOptions>
MSFT:*_*_*_CC_FLAGS = /Od
...
}
'/Od' will disable the optimization so that compiler will not optimize the local variables
to registers.
3.
PE image format (versus TE image format) is suggested, if developers frequently need
to debug function calls betweens modules using WinDbg.). Taking the rule section for
PEIM as an example, the code changes from
[Rule.Common.PEIM]
FILE PEIM = $(NAMED_GUID)
{
PEI_DEPEX PEI_DEPEX Optional
$(INF_OUTPUT)/$(MODULE_NAME).depex
TE
TE
$(INF_OUTPUT)/$(MODULE_NAME).efi
UI
STRING="$(MODULE_NAME)" Optional
VERSION
STRING="$(INF_VERSION)" Optional BUILD_NUM=$(BUILD_NUMBER)
}
To:
[Rule.Common.PEIM]
FILE PEIM = $(NAMED_GUID) {
PEI_DEPEX PEI_DEPEX Optional
PE32
PE32 Align = 32
UI
STRING="$(MODULE_NAME)"
VERSION
STRING="$(INF_VERSION)"
}
|.depex
|.efi
Optional
Optional BUILD_NUM=$(BUILD_NUMBER)
And, it’s suggested to apply such change Rule sections for SEC and PEI_CORE as well,
the corresponding Rule section name might be [Rule.Common.SEC] and
[Rule.Common.PEI_CORE] (may vary on different platforms).
Version 1.0
19
5.1.5
Update CPU driver on ECP-based platforms
Most of Edk Compatibility Platforms use their own CPU driver, it must be updated to enable
debugging feature.
Note:
For the native platforms that use a CPU driver compliant to UDK Debug
Solution, this step is not needed.
The main updating is to reserve the original IDT entries set up before and to avoid any
modification on them. The steps are:
1.
Load the original IDT table and calculate its entries count.
2.
Copy the original IDT table entries to the new IDT table.
3.
Update the CS field for the IDT table entries, as the DXE phase is using a different
segment descriptor.
4.
Fill the reset of IDT entries needed by CPU driver. The updated code resembles the
following:
STATIC
VOID
InitInterruptDescriptorTable (
VOID
)
{
... ...
//
// Get original IDT address and size.
//
AsmReadIdtr ((IA32_DESCRIPTOR *) &Idtr);
//
// Copy original IDT entry.
//
CopyMem (&gIdtTable[0], (VOID *) Idtr.Base, Idtr.Limit + 1);
//
// Update all IDT entries to use current CS value
//
for (Index = 0; Index < INTERRUPT_VECTOR_NUMBER; Index ++, CurrentHandler +=
0x08) {
gIdtTable[Index].Bits.Selector
= AsmReadCs();
}
... ...
AsmWriteIdtr (IdtPtr);
... ...
}
Note:
Refer to MdePkg/Library/BaseLib for the implementation of
AsmReadIdtr(),AsmWriteIdtr() and AsmReadCs(), if the CPU module is not linked
with BaseLib.
September 2010
20
5.1.6
Build image and update flash
Developers need to build image and update flash before starting source level debugging. If
macro SOURCE_DEBUG_ENABLE is defined to turn on the debug feature conditionally,
developers may use the following command to build the image (assuming the Conf/target.txt
file is configured to identify the build target):
build -D SOURCE_DEBUG_ENABLE
5.2
Set up for HOST machine
Developers need to open the HOST side configuration file from Windows Start -> All Programs
-> Intel UDK Debugger Tool -> Change Configurations to review the settings, and modify
them to co-work with the TARGET platform if needed:
1.
Change [Debug Port]/Channel to Usb or Serial depending on what kind of cable being
used. The other [Debug Port] parameters are ignored when Channel is set to Usb;
2.
Change [Debug Port]/Port to reflect the correct COM port being used;
3.
Change [Debug Port]/FlowControl to 0 if the platform doesn't provide the SerialPortLib
instance with flow control enabled;
4.
Change [Target System]/ProcessorCount to the number of the logical processors in the
TARGET. Note that dual-core with hyper-threading (two thread for each core) means
four logic processors. A larger value than that is also acceptable;
5.
Change the [Debugger] section to reflect the correct WinDbg installation path.
Other debug-related software utilizing eXdi features may conflict with this debug solution. If
such software is installed, re-install the Intel® UDK Debugger Tool to re-enable the debug
solution.
The developer needs to connect the debug cable to the port on the Microsoft® Windows®
machine.
Version 1.0
21
6
Known Limitations and Issues
6.1
6.2
Known Limitations:
Debug output (through serial port) should not contain non-ASCII characters.
No more than 3 user specified breakpoints in SEC/PEI phase as hardware breakpoints
is used for code executing from read-only memory.
Smmentrybreak setting is not preserved across a TARGET reset. The preferred
Smmentrybreak status for each debug session must be set.
Any attempt to perform debugging of the Debug Agent in the TARGET may result in
unexpected behavior.
Other debug-related software that utilizes eXdi features may conflict with the
Microsoft® Windows® Debug Tool (WinDbg).
Code before debug agent is initialized cannot not be debugged, for example, early
SEC, early SMM, etc.
The TE header is emulated to be PE header for WinDbg. As a result, the contents of
the TE header may not be visible from the debugger.
On the phases of SEC, PEI and SMM mode, only one processor (the BSP) is able to be
debugged, also the DXE phase before the MP Services Protocol installed. In the DXE
phase after the MP Services Protocol installed, develop could switch to the other
processors (the AP) if they are in the active status.
It does not support debugging if the CPU goes in 16-bit real mode.
Break in from HOST to TARGET is not supported if CPU is executing with interrupts
disabled.
When using the USB debug port as the debug communication channel, there should
not be any USB devices present on any of the other USB ports associated with the
same EHCI controller. USB ports associated with other EHCI controllers are not
impacted.
Only AP code that is invoked by the Platform Initialization Multiprocessor Services
protocol could be debugged. For example, on EdkCompatibilityPkg based platforms, AP
code invoked through the Framework Multiprocessor Services Protocol cannot be
debugged.
Known Issues
While TARGET is running the Microsoft® Windows® Debug Tool, (WinDbg) command
input will show as busy and user issue "break" command, there is small possibility that
the UDK Debugger Tool will stop responding. Avoid issuing a "break" command when
TARGET is performing a switch from PEI to DXE or a switch from DXE to SMM, to
September 2010
22
reduce the chances of exposing this issue. You must to restart the debug session if the
debugger stops responding
WinDbg cannot display the value of local variables inside a function in the PEI phase
when the current module is TE format and its emulated PE header overlaps with
another module. Using the WinDbg command “.reload /u <module_name>", the
uninterested adjacent module must be unloaded to let the debugger correctly parse
the local variables. For example, to unload symbols for PeiCore, use the command:
“.reload /u PeiCore.” All the modules that are loaded in WinDbg may be discovered
using the “lm” command.
Access to memory ranges that are not decoded or supported by the platform hardware
may cause unexpected behavior including an unresponsive EDK Debugger Tool. A
developer must always be aware of the address ranges that may be accessed in each
phase of the TARGET firmware execution.
Version 1.0
23