1
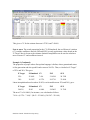
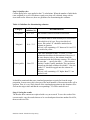
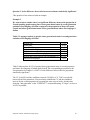
Back to referring page
Français
APPENDIX:
VARIANCE ESTIMATION
FOR THE ETHNIC DIVERSITY SURVEY
The variability or variance of an estimate is a good indicator of the quality of that
estimate. An estimate with an overly large variance is deemed unreliable. In order to
quantify what is considered an overly large variance, the EDS uses the coefficient of
variation (CV), which is a relative measure of variability. The CV is more useful than the
variance when comparing the accuracy of estimates from samples of different sizes or
scales.
The following section contains examples that may answer some of the questions that tend
to come up when analyzing data.
1) How does one determine the CV for a given estimate?
2) Is the difference observed between the two estimates (percentage or proportion)
statistically significant?
3) How does one determine the CV when the observed percentage is greater than
50%?
4) How does one determine the CV when only one sub-sample (domain) of the
population answered a question?
Question 1. How does one determine the CV for a given estimate?
For the EDS PUMF, there are two ways to estimate the CV associated with an estimate.
Users may calculate the CV by using the bootstrap weights included in the PUMF (see
section 1a) or the Excel tool containing pre-calculated CV approximations for certain
domains (see section 1b).
Although the first method is more precise for estimating variance, the Excel tool can be
used to obtain virtually equivalent CVs for proportions, and to do so more quickly.
A) Bootstrap method
An efficient way of estimating variance using survey data from a complex sample plan,
such as the EDS is to use one of the resampling techniques, like the bootstrap. In order to
∧
applys this technique, the estimate of interest θ should be calculated from survey data,
then this estimate should be recalculated for each of the 500 sets of bootstrap weights
(located in the file BSW.txt). The next step is the calculation of the variability between the
Statistics Canada – Ethnic Diversity Survey
1
estimates obtained through the following formula, which corresponds to the bootstrap
variance for this estimate:
∧
∧
V B(θ ) =
∧
∧
1 500 ∧
2
∑i =1 ( θ Bi − θ )
500
where θ Bi is the estimate based on the bootstrap weights for bootstrap sample i.
The CV for the estimate can be determined from the following formula:
V̂ ( θˆ )
CV ( θˆ ) = B
θˆ
Software like WESVAR, developed by WESTAT and SUDAAN, can be used to directly
estimate variance by the bootstrap method. Software such as SAS, SPSS and Stata do not
have this method directly available. Statistics Canada developed SAS macros (called
BOOTVAR) to apply the bootstrap method in order to obtain an accurate estimate of the
variance.
Users are free to use whichever software they wish to estimate variance as long as they
ensure that the bootstrap method is applied using the weights provided with the EDS
PUMF.
Statistics Canada – Ethnic Diversity Survey
2
The BOOTVAR macros program is included in the EDS PUMF product. User could refer
to the following document for instructions on using the BOOTVAR:
Appendix – User’s guide for the BOOTVAR
For more information on the bootstrap method, users should consult the following
documents:
Lohr, S. 1999. Sampling: Design and Analysis. Duxbury Press, USA.
Rao, J.N.K., C.F.J. Wu and K. Yue. 1992. “Some recent work on resampling methods for
complex surveys.” Survey methodology (Statistics Canada, Catalogue 12-001). Ottawa:
Statistics Canada, 18, 2: 209-217
K.F. Rust , J.N.K. Rao, “Variance estimation for complex surveys using replication
techniques”, Statistical Methods in Medical Research, 5, 1996, p. 281-310
Statistics Canada. 2003, Survey methods and practices, 12-587-XPE
Users may refer to the following documents for additional information on using the
bootstrap method in WesVar, SUDAAN or Stata:
Piérard, E., Buckley, N., Chowman, J. “Bootstrapping made easy: A STAT ADOO File”.
The Research Data Centres information and technical bulletin. Volume 1, number 1,
spring 2004, 20-36 (Statistics Canada, no. 12-002-XIE in the catalogue).
Phillips, O. “Using bootstrap weights with WesVar and SUDAAN”. The Research Data
Centres information and technical bulletin. Volume 1, number 2, fall 2004, 6-15
(Statistics Canada, no. 12-002-XIE in the catalogue).
Research Triangle Institute. 2001. SUDAAN User’s Manual, Release 8.0. Research
Triangle Institute, Research Triangle Park, NC.
Westat. 2002. WesVar 4.2 User’s Guide. Westat, USA.
Statistics Canada – Ethnic Diversity Survey
3
B) Excel tool
Approximate coefficients of variation (CV) can be obtained for EDS estimates by using a
simple interactive tool,. This tool is part of the EDS PUMF product. It is in the form of an
Excel spreadsheet.
Important notice to EDS PUMF users
The Excel tool presented in this section was designed only to estimate CVs and the
variance in simple cross-tabulation tables. With statistical methods that require the
measurement of significance (e.g. regression analysis), users will have to resort to the
previously presented bootstrap method.
To use the CV estimation tool for the EDS, open FindCV.xls. A window may appear. If
so, click on “Enable Macros”. An Excel spreadsheet will appear, and you should be able
to see the survey title and the "CV requested” button. Click on “CV requested” to open
the application. The following screen will appear:
Step 1: Selecting the type of domain
The estimation domain is simply the sub-category of the total sample chosen to produce a
given estimate (e.g., Montreal Catholics). Based on the classification variables used in the
analysis, select the appropriate domain in Table 1. Selecting one of the last two domains
will activate the drop box for dichotomous variables. The dichotomous variables are listed
in Table 2.
Statistics Canada – Ethnic Diversity Survey
4
Table 1: Available domains
CMA3, GENSTAT3 and RELIG
CMA3, AGES, SEX and VISMIND
CMA3, AGES, SEX and PBSLCT
CMA3, GENSTAT3 and VISMIND
CMA3, AGES, SEX and GENSTAT3
CMA3, GENSTAT3 and Dichotomous Variable
CMA3, AGES, SEX and Dichotomous Variable
Table 2: Available dichotomous variables
EA_C
EA_F_C
EA_QUE
EA_F
EA_ENG
EA_IRS
EA_SCT
EA_WEL
EA_BRT
EA_AUS
EA_BEL
EA_DUT
EA_GER
EA_SWS
EA_DAN
EA_FIN
EA_NOR
EA_SWD
EA_HNG
EA_POL
EA_ROM
EA_RUS
EA_UKR
EA_GRK
EA_ITL
EA_SPN
EA_POR
EA_JEW
EA_LEB
EA_EIN
EA_PNJ
EA_CHN
EA_FIL
EA_JPN
EA_VTN
EA_JAM
EA_AME
EA_REG
EA_OWE
EA_ONE
EA_OEE
EA_OSE
EA_OOE
EA_OAF
EA_OAR
EA_OWA
EA_OSA
EA_OEA
EA_OCR
EA_OLT
EA_OOT
L1_ENG
L1_FRE
L1_GER
L1_ITA
L1_POL
L1_POR
L1_PUN
L1_SPA
L1_TAG
L1_UKR
L1_ARA
L1_DUT
L1_CHIN
Note: The dichotomous variables starting with the prefix EA_ have not been put in the
microdata file. Each of these variables represents a specific ancestry or specific group of
ancestries as defined in EAC1 through EAC8. For example, if the user wants to have
approximations of CVs for respondents who reported an English ancestry (i.e. at least one
of the variables EAC1 through EAC8 is equal to 06), he should select the dichotomous
variable EA_ENG in the Excel tool. If analyse by ethnic ancestry are planned, it is
suggested to first derive the associated dichotomous variable based on EAC1 through
EAC8 then use this variable in the analyse.
Example 1
We want to calculate the CV for the proportion of French speaking people whose
generational status is first generation and whose first language is Italian.
In the CV Requested window, select CMA3_GENSTAT3_Dichotomous Variable and
dichotomous variable L1_ITA.
Statistics Canada – Ethnic Diversity Survey
5
Step 2: Selecting the desired items in the estimation domain
After clicking on OK, the Results sheet appears in the following form.
Every column in the output table has a specific meaning. In our example:
y CMA3 – Selected domain variable
y GENSTAT3 – Selected domain variable
y L1_ITA – Selected domain variable
y P Target – Target proportion in the simulation
y P Simulated – Real proportion obtained in the simulation
y N – Population size (rounded to the nearest tenth)
y n – Sample size
y Variance – Proportion estimate variance
y Standard deviation – Proportion estimate standard deviation
y CV – Coefficient of variation
y INF – Lower limit of the 95% confidence interval
y SUP – Upper limit of the 95% confidence interval
Once the Results sheet appears, the desired items have to be chosen in the estimation
domain. This is done by clicking on the scroll-down list
for column “CMA3” and
selecting the area for which the estimates are wanted. This will filter the data and retain
only those lines in the table that contain estimates for the specified geographic area. If user
Statistics Canada – Ethnic Diversity Survey
6
wants to list all geographic areas, select “(all)” so they will all be listed, or choose
“TOTAL” to save only overall estimates (i.e., estimate at Canada level). The same thing
should be done with the columns representing the other variables in the domain.
Then, select the desired proportion by clicking on “P Target”. For instance, if the objective
is to obtain a CV for a proportion of 23% (which is not on the list), select “(all)” in the
list in order to save all proportions. Thus, by using the CVs that correspond to the
proportions of 20% and 25% for a given domain, the desired CV would be between these
two limits.
Example 1 (Continued)
In the Results sheet, select “TOTAL” for variable CMA3, “1st generation” for
GENSTAT3 and Italian for “L1_ITA”.
Then determine the target proportion. It is easier to determine the desired proportion with
a frequency table. Weight WGT_PUMF will give the following results for languages
spoken:
Table 3: Languages spoken by people whose generational status is 1st generation and
whose first language is Italian
English only
French only
Non-official language
English and French
English and non-official language(s)
French and non-official language(s)
English and French and non-official language(s)
Non-official languages
0.76%
0.30%
17.75%
0.00%
53.34%
5.98%
21.75%
0.12%
According to the table, 28.03% of people whose first language is Italian and whose
generational status is first generation speak French. Since 28.03% is not in the P Target
list, we will select “(all)”, which will leave us with the following Excel sheet:
Statistics Canada – Ethnic Diversity Survey
7
This gives a CV for the estimate between 6.5376% and 7.4160%.
Note to users: The actual proportion for the CV (P Simulated), the coefficient of variation
(CV) and the confidence interval (INF and SUP) are only approximate values based on the
“P Target” that is closest to the estimate obtained. Interpolation can be used to calculate a
more accurate CV and confidence interval.
Example 1 (Continued)
The proportion of people whose first spoken language is Italian, whose generational status
is first generation and who speak French comes to 28.03%. Thus, we looked at “P Target”
of 25% and 30%. This gave:
P Target
P Simulated CV
INF
SUP
25%
25.1001
7.416
21.4544
28.7458
30%
30.1307
6.5376
26.2719
33.9896
Linear interpolation based on where 28.03% was located between 25% and 30%, gave:
P Target
P Simulated CV
INF
SUP
28.03%
28.03
24.2602
31.7999
6.9044
The new CV of 6.9044%, for instance, was calculated as follows:
7.416 + (6.5376 - 7.416) * (28.03 - 25.1001) / (30.1307 - 25.1001)
Statistics Canada – Ethnic Diversity Survey
8
Step 3: Quality rules
Certain quality rules were applied to the CV calculations. When the number of individuals
(non-weighted) in a cell is less than or equal to ten, that cell is deleted, along with its
associated results. Moreover, there are guidelines for disseminating the estimates.
Table 4: Guidelines for disseminating estimates
Category
Coefficient of
variation (%)
Acceptable
0.0 –16.5
Marginal
Unacceptable
Recommendations
This estimate can be used with no restriction.
16.6 – 33.3
The estimate must be used carefully as it is associated
with a high level of error. Every time this level
occurs, the symbol “E” should be attached to the
estimate in question.
In Excel, cells containing a CV between 16.6 and 33.3
are marked in yellow.
Over 33.3
If the value obtained for the CV is over 33.3, this
information should not be disseminated. However, if
the user chooses to do so, the estimate should be
disseminated with the following warning: “We inform
the user that … <specify the data > … does not meet
Statistic Canada’s quality standards. The conclusions
drawn from this data would not be reliable”. Also, the
symbol “F” should be tagged onto the estimate in
question.
In Excel, cells containing a CV higher than 33.3 are
marked in red.
It should be mentioned that some simulated proportions are quite far from the target
proportion. In most cases, this is because of the small number of observations in the cell in
question. Thus, it is very likely that all of the simulated proportions in this domain will be
far from the target value and that the corresponding CVs will be marked in red.
Step 4: Saving the results
The Results sheet contents are replaced with every new search. To save the results of the
current search, copy the results that are to be saved and paste them into another Excel file,
then save this new file.
Statistics Canada – Ethnic Diversity Survey
9
Question 2. Is the difference observed between two estimates statistically significant?
This question is best answered with an example.
Example 2
We want to know whether there is a significant difference between the proportion of
French-speaking people among those whose generational status is second generation
and whose first language is Italian compared to the proportion of those who speak
French and whose generational status is first generation and whose first language is
Italian.
Table 5: Languages spoken by people whose generational status is second generation
and whose first language is Italian
English only
French only
Non-official language
English and French
English and non-official language(s)
French and non-official language(s)
English and French and non-official language (s)
Non-official languages
2.53%
0.0%
0.0%
0.26%
50.33%
0.16%
46.53%
0.0%
Table 5 indicates that 46.95% of people whose generational status is second generation
and whose first language is Italian speak French. The corresponding proportion for the
first generation in example 1 is 28.03%. Is the difference between the two proportions
statistically significant?
The CV (6.9044%) and the confidence interval (24.2602% to 31.7999%) are already
known for the first generation. Users need only establish the CV and the confidence
interval for the second generation by repeating the same steps as before, but this time
choosing “2nd generation” in the “GENSTAT3” column and setting “P Target” as close to
46.95% as possible.
Statistics Canada – Ethnic Diversity Survey
10
The CVs of people whose generational status is second generation, whose first language is
Italian and who speak French is 5.7765%. The confidence interval is between 41.6914%
and 52.2086%, with a 95% confidence threshold.
The two confidence intervals have to be compared in order to determine whether the
difference between the two estimates is statistically significant.
1st generation: Between 24.2602% and 31.7999%
2nd generation: Between 41.6914% and 52.2086%
The method for determining whether the difference between the two estimates is
statistically significant is explicit. If the two intervals overlap, we cannot confirm whether
the two estimates are different (or, in more technical terms, with a confidence level of
95%, we cannot dismiss the null hypothesis whereby there is no statistical difference
between the two estimates). However, if the two intervals do not overlap, it is possible to
confirm that the two percentages are different, with a confidence level of 95% (in more
technical terms, we can dismiss the null hypothesis whereby there is no statistical
difference between the two estimates).
In summary, given the CVs and the confidence intervals, it is possible to confirm that the
proportion of French-speaking people among those whose first language is Italian and
whose generational status is first generation is much lower that the proportion of Frenchspeaking people among those whose first language is Italian and whose generational status
is second generation.
Question 3. How does one determine a CV when the estimate is higher than 50%?
First, apply the formula to calculate a coefficient of variation:
CV = Standard Error / Estimation * 100
Assume that we are interested in a specific domain, with a proportion higher than 50%. As
the table shows, no CV has been calculated for proportions above 50%. However, the
desired CVs can easily be calculated through the complementary proportion, as follows:
-
We want the CV for the B proportion that is higher than 50%.
We use the CV for the complementary A proportion for which A=100-B
We must work in a same domain for proportions A and B.
Thus, we have:
CVA = Standard ErrorA / EstimationA * 100
-
We must isolate the standard error in the formula and calculate the standard error
from the CV and the estimate in the table.
Standard ErrorA = (CVA * EstimationA) / 100
Statistics Canada – Ethnic Diversity Survey
11
-
Since the standard error for A is the same as for its complement B, we have to
use the starting formula to find the CV for B.
CVB = Standard ErrorA / EstimationB * 100
Example 3
We want to calculate the CV for the percentage of English-speaking people among
those whose generational status is first generation and whose first language is Italian.
In table 3, we note that the proportion of English-speaking people among those whose
generational status is first generation and whose first language is Italian is 75.85%. Thus,
the complementary proportion is 24.15%.
The CV associated with this proportion is 7.6379%. Thus, the standard error is 1.8446.
Hence, the CV associated with the estimate is 2.4318%.
Question 4. How does one determine a CV when only one sub-group answered a
question? (e.g. questions only applicable to immigrants or people who are member of
a club or an organization)
This scenario is different from the previous ones inasmuch as the respondents were
separated from the rest of the population ahead of time by identifying with a particular
characteristic.
If the sub-group in question corresponds to a domain that falls among those listed in the
Excel application, the approach is the same as in response to question 1. For instance, we
are looking for the CV of the proportion of immigrants who arrived in Canada before
1991. Here, the sub-group is immigrants (GENSTAT3 = 1).
However, if the sub-group does not correspond to a domain listed in the Excel application,
the proportion of those respondents out of all respondents is the one to use, not the
proportion out of the sub-group. For instance, the application can be used to find the CV
associated with the proportion of people in the total population who are part of a team or
sports club, but we cannot get the CV associated with the proportion of people who are
part of a team or sport club out of those who have indicated that they are part of a group or
organization because this domain is not available in the Excel application. To calculate the
CV associated with the second proportion, it would be necessary to use the bootstrap
method described in question 1a).
The previous case showed that there are several estimation domains, and it is important to
distinguish between them to obtain a CV for a sub-group in the population. Essentially, it
is a matter to ensuring that the denominator for the proportion corresponds to the value of
N in the Results sheet.
Statistics Canada – Ethnic Diversity Survey
12