1
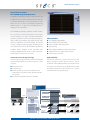
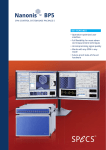
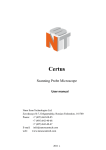
Customized Systems and Solutions Nanostructures and Thin Film Deposition Surface Analysis and Preparation Components Surface Science Applications Components for Surface Analysis Nanonis SPM Control System The Expandable Engine for Your SPM Project Features 24 Signal Channels Lowest Noise and Highest Resolution Highly Configurable Z-Controller Interactive Scan Control Multiple Desktop Advanced 2-D and 3-D Spectroscopy Manipulation and Lithography Powerful and Clear User Interface Spectrum Analyzer and Oscilloscope All Signals and Parameters in Real World Units Works with any SPM Future-Proof Outstanding Flexibility Performance Reliability and Easy to Use Nanonis SPM Control System The Base Package of the Nanonis Control System provides the full functionality for basic SPM applications. From signal conditioning and AD/DA conversion to real-time signal processing and the graphical user interface, the Nanonis Base Package provides a fundamental framework that can be adapted and extended with a range of add-on modules. All basic processes such as z-control, scan-control, data acquisition, atomic manipulation, lithography and spectroscopy are included, allowing easy control of elementary STM and AFM operations. Fully Digital System All analog signals are converted immediately and internal processing is fully digital. This has become possible only recently with the latest advances in the performance of processors and AD/DA converters. The advantages are: The system is very flexible and scalable. Software adaptations are all that is needed for rapid custom developments. Digital signal links are immune to noise, which is crucial for SPM applications. It has removed the limitation of range and resolution, which was a drawback when linking systems with analog signals was common. 24 Signal Channels The generic analog interface provides 24 live signals: 8 outputs, 8 inputs and 8 internal signals. This allows connection of signals including bias voltage, tunneling current, deflection, x, y, z, external lock-ins etc. The software displays all electronic signals as real world numbers in floating-point representation, with assigned SI units for immediate quantitative results. High Resolution AD/DA Conversion “There is plenty of room at the bottom“, said Richard Feynman when he described his vision of the science that led to nanotechnology. Enormous resolution is required to reveal the smallest features, while maintaining an acceptable sample range. The Nanonis system employs sophisticated digital filtering, oversampling and dithering techniques to provide the highest resolution. The patented hrDAC™ technology turns the 16-bit DA converters into real 22-bit devices which would fill up a full board and cost ten times as much in a traditional approach. There is no need to switch gains and co-ordinates are absolute over the full range. Nanonis is pushing the limits for high resolution scanning. Interactive Scan Control The control system for a scanning probe microscope is like a cockpit and the pilot needs to be supported in all his maneuvers on the flight through the nano-world. The scan control module is interactive and dynamic. It is possible to zoom-in on acquired data, paste scanned data to the background for reference and display different channels in multiple windows. The motion of the tip is visualized in real-time. In summary, this system is designed to be a pleasure to use, in line with our promise: Free to explore and discover. Versatile z-Controller The distance between tip and sample can be controlled by any signal or combination of signals. The quantitative parameters allow the application of control theory models and yield a further understanding of tip-sample interaction. The user-configurable z-controller allows onthe-fly switching between settings such as input signal and feedback parameters. Signal Analysis and Monitoring All signals can be inspected with the FFT spectrum analyzer, signal charts, oscilloscope or signal history. Such fully digital and integrated software instruments are much more efficient in use, less invasive, better in performance and lower in cost than their external counterparts. This is of great value for optimizing the experimental setup, eliminating disturbances and thus improving the quality of the scientific results. Innovation in Surface Spectroscopy and Microscopy Systems Nanonis SPM Control System Prepared for the Future: The LabVIEW Programming Interface Competitive advantage in research is often based on the modification of an instrument that allows the researcher to perform experiments in a way nobody else has done before him. This is where our LabVIEW Programming Interface steps in - to give you the building blocks to design your own experiment. The LabVIEW programming interface consists of libraries to access the controls and functions of the graphical user interface. It is used to automate experiments, sequences, calibration routines and experimental procedures. Polling of parameters and signals at high rates allows for supervision and alarm settings, etc. Instead of using a simple scripting language, the Nanonis System provides full access to all the features provided by LabVIEW: graphs, database access, convenient data handling, GPIB/RS232/USB access to other instruments, signal analysis functions and much more. Add-on Modules OC4: digitally integrated PLL Lock-in Detector for all channels Kelvin Controller: AM & FM modes Atom tracking High voltage amplifiers and Piezo Motor Drivers Adaptation kits for commercial microscopes Interferometer Controller Advanced 2D and 3D Spectroscopy Advanced spectroscopy modules provide a set of flexible routines for experiments on a point, line, grid, or a cloud of points: Bias spectroscopy z-spectroscopy Generic sweep: any output or parameter can be swept while any number of other selected channels are recorded User-defined experiment written in LabVIEW TCP/IP TCP/IP communication buffered transfer extensions OC4 Signal Conditioning SC4 2 x 8 bit DIO ports pulse counters pulse generator digital filter oversampling dithering hrDAC™ 8 analog inputs 16 bit 200 kS/s 16 bit 1 MS/s Innovation in Surface Spectroscopy and Microscopy Systems MIO C0 time critical loops PI controllers PCI bus data aquisition scan generation DMA,IRQ register state machines etc. … NI-7833 FPGA Card DIO C1 Realtime Controller RC4 Pentium Processor LabVIEW RT OS DIO C2 Host Computer Windows XP or Vista dual or quad display data storage graphical user- interface High Reliability The Nanonis system has a proven track record of reliability, running for months without re-boot in labs all around the world. SPM experiments are complex and do not always work on the first try. A reliable control system provides the safety that it will not fail just as a complicated experiment is progressing well. LP 5 kHz 8 analog outputs LP 5 kHz Nanonis SPM Control System General Scope of delivery Cases Real-time controller RC4, signal conditioning SC4, software and license, unlimited updates and support for one year, host computer (opt.) Stackable benchtop cases, Wavetronics, rack mount kit available Operating temp. +5° C to +40° C Compliance CE Warranty One year parts and labor on defects in material and workmanship Documentation User manual for hardware and installation, printed user manual for graphical user interface, online help RC4 Dimensions, weight 32.5 x 28 x 12 cm, 4.5 kg Power Universal power supply, max 60 W Components Pentium mobile 2 GHz, 1 GB ram, 40 GB HD, 2 PCI slots, ethernet adapter Operating system National Instruments Real-Time OS I/O card NI-FPGA RIO (PCI-7831R) SC4 Dimensions, weight 32.5 x 28 x 7 cm, 3.6 kg Power 100 V - 240 V, 50 - 60 Hz, 10 W, automatic switching, toroidal transformer, linear regulated Ground 100 kΩ AGND to chassis, decoupled from RC4 Analog Inputs Hardware interface Diff input volt. range Diff input resistance Analog bandwidth AD converter Effective resolution Analog input noise Converter noise Measurement noise 8 x BNC connectors, differential ±10 V 100 kΩ DC - 5 kHz, 4th order Butterworth low-pass filter 16-bit, no missing codes, 200 kS/s 20-bit @ 10 kS/s, 24-bit @ 100 S/s (oversampling) ‹ 15 nV / sqrt(Hz) ‹ 2 μV / sqrt(Hz) ‹ 140 μV rms @ 10 kS/s, ‹ 45 μV rms @ 1 kS/s Analog Outputs Hardware interface 8 x BNC, referenced to AGND Output voltage ±10 V into 2 kΩ, (0 to 10 V per dip switch per channel) Output resistance ‹ 1Ω, short circuit safe Analog bandwidth DA converter Effective resolution Noise density Output noise 5 kHz, 4th order Butterworth low-pass filter 16-bit, monotonic, 1 MS/s 22-bit, patented hrDAC™ technolgy with active glitch compensation ‹ 350 nV / sqrt(Hz) ‹ 30 μVrms, ‹ 150 μVpp (DC - 1 MHz) Digital Lines and Pulse Counter Ports 2 x 8 lines on two sub-D9 female Direction Input or output for each line Signal 3.3 V TTL, max 5mA per line Pulse counters 2, up to 40 MC/s Coarse Positioning and Auto Approach Types Slip stick piezo drive, beetle type, stepper motor, DC motor Interfaces Digital port, serial, USB, GPIB, ethernet etc. Auto approach Different protocols, configurable, programmable with programming interface Graphical User Interface Operating system Windows XP/Vista/7 Min. requirements Pentium 2 GHz or equiv., 2 GB Ram, 40 GB HD, two 19‘‘ Monitors with at least 1280 x 1024 pixels License Unlimited in time, bound to RC4 Documentation Online help, F1 for context sensitive help, tip strips for each control element, printed software operation manual Load & save For every session directory, settings, parameters and screen layout settings Technical alterations reserved. The information in this document is provided with greatest care but SPECS does not assume any liability arising from the application or use of the information or product described here. SPECS is a registered trademarks of SPECS GmbH. SPECS Surface Nano Analysis GmbH Voltastrasse 5 13355 Berlin Germany Tel.: Fax: Email: Web: +49 30 46 78 24-0 +49 30 46 42 0 83 [email protected] www.specs.com Signals & Analysis Signals Data transfer Representation Oscilloscope Spectrum analyzer Long term spectrum Signal charts Long term chart Signal history 24 live signals: 8 inputs, 8 outputs and 8 internal signals Via TCP/IP, 1 kS/s default, up to 10 kS/s 32-bit floating point, real world physical units DC, rms and peak-peak measurements, triggering by level or manual Power spectral density in physical units (e.g. A / sqrt(Hz)) Power spectral density vs time as gray-scale plot Continuously rolling charts with adjustable speed Record signals over days All 24 signals in memory for the last minute z-Controller Algorithm Control bandwidth Control signal Preprocessing Controller switching Param. adjustment SafeTip™ TipLift™ Smooth-off Digital PI controller, anti wind-up, bump-less start and stop Up to 2 kHz (3 dB point of closed-loop transfer function) Any of the 24 signals and elementary operations thereof (+, -, *, /) Abs, log, bipolar On-the-fly, from a predefined set of controller settings Real-time interactive, physical units, logarithmic or linear slider scales User-definable condition on any signal or combination thereof Z-offset after switching the controller off Averaging z-position for reproducible hold of tip-sample distance Scan Control Aquisition channels Scan frame Resolution Scan speed 1 - 24 forward and backward Real-time interactive, mouse definable, also non-square 32 x 32 up to 8192 x 8192, also non-square pixels Max. 10 kHz pixel frequency, max. 100 lines/second; const time / line or const surface speed, diff. forward and backward speed Scan modes Single: up & down, continuous: up, down & bounce, auto save File format Documented, example load routines, SPIP, Gwyddion, WSxM, MATLAB Visualization Tip position in real-time, adjustable color table, paste scanned image to background for reference Scan data display Up to 7 windows with different views for zoom, channel, color etc. Display data proc. None, slope subtract, slope and av. subtract, differentiate Line scan monitor Display up to 4 last scan lines, forward and backward scan Slope compensation Real-time, adjustable in degrees, smooth transitions Drift compensation Linear in 3 dimensions Generic Sweeper Sweep channels Acquisition channels Samples per curve Visualization Timing Spectroscopy Acquisition channels Sweep channels Data samples Timing Multi-curve av. Outputs, setpoints, div. parameters 24 signals, system parameters 32 - 1 M Real-time during acquisition Settling time and acquisition time (1 ms - 10 s) 1 - 24, forward and backward Bias, z 32 - 1M (per curve) Z-hold av., initial settling time, settling time, acquisition time, slew rate, etc. 100 μs resolution, up to 10 s With z-control in between Spectroscopy on a Grid or Line Grid Rectangular, min. 4 x 4, max. limited by 2 GB total data file File format ASCII for each curve or binary for total grid, documented file format, file browser & example load routines Experiments Bias- or z-spectroscopy, generic sweeper or any self-programmed routines with LabVIEW interface Data aquired Topography, set of config. parameters for every point, spectroscopy data LabVIEW Programming Interface Scope Library of VI‘s to control elements of the graphical user-interface Connection Via TCP/IP to VISA Server on host computer, local or remote access Tasks Automate experiments, automate operation sequence for calibrations and experimental procedures, polling of parameters and signals at high rate for supervision, alarming etc. Other product and company names mentioned herein are trademarks or trade names of their respective companies. Printed in March 2010 Your Local Representative: ISO 9001 Certificate Innovation in Surface Spectroscopy and Microscopy Systems