1
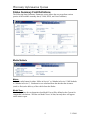
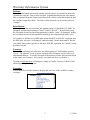
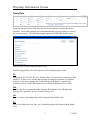
USER
MANUAL
3/1/2010
Table of Contents
Introduction ..................................................................................................................... 1
Logon Procedures ........................................................................................................... 2
WIS Report Selections .................................................................................................... 3
Status Summary Field Definitions .................................................................................. 4
Metric/Vehicle ............................................................................................................ 4
Market/Platform .......................................................................................................... 6
Query Rule .................................................................................................................. 7
Report By .................................................................................................................... 9
Status Summary Results ............................................................................................... 10
Status Summaries Query Example................................................................................ 11
Top Problems by Part Number ..................................................................................... 16
Top Problems by LOP .................................................................................................. 18
MOP/MIS ...................................................................................................................... 19
Cumulative C/1000 Matrix: ...................................................................................... 20
Conditions Matrix: .................................................................................................... 21
CLM Link: ................................................................................................................ 22
QNA Link: ................................................................................................................ 22
Lag Factored Sales: ................................................................................................... 23
Calculating C/1000, EPUS, & Cost/Condition ............................................................. 24
Cumulative C/1000: .................................................................................................. 24
Cumulative EPUS: .................................................................................................... 25
Cost per Condition .................................................................................................... 26
Calculating Prior Comparable Cumulative C/1000 ...................................................... 27
Charting......................................................................................................................... 29
Consecutive Graph: ................................................................................................... 31
Sales Graph: .............................................................................................................. 31
Overlay Graph:.......................................................................................................... 32
Supplier Targets ............................................................................................................ 33
Printing.......................................................................................................................... 35
Export............................................................................................................................ 36
Export Controls - Standard: ...................................................................................... 36
Export Controls - Advanced: .................................................................................... 37
Advanced Reports ......................................................................................................... 39
Jobs: .......................................................................................................................... 40
Queries: ..................................................................................................................... 41
Parameters: ................................................................................................................ 42
Rules: ........................................................................................................................ 43
Scheduler: ................................................................................................................. 45
Performing Queries on Jobs: ..................................................................................... 47
Warranty Information System Training ....................................................................... 47
Warranty Information System
Introduction
The Finance Organization developed the WIS system to provide corporate standard
metrics to track vehicle warranty activity. These metrics consist of conditions per 1000
vehicles sold (C/1000), expense per unit sold (EPUS) and cost per condition (CST/C).
These metrics are used in forecasting future expenses and to measure vehicle quality.
WIS is a browser based application and can support a large user community of corporate
and supplier quality analysts.
Warranty claims that are reported in the WIS system include:
Warranty data only. Does not include Service Contract or Transportation claims.
Repairs on sold vehicles only. Repairs will be reported after the vehicle is sold if
the repair occurred prior to the sale date.
Retail and Daily fleet repairs. Chrysler company car program vehicle repairs are
not reported in WIS until after a retail sale has occurred.
Paid warranty repairs only. Denied or rejected claims are not reported in WIS.
The following are some of the key items the system has to offer:
Six Model Years of data for either Months in Service or Miles in Service.
Three Model Year comparisons are standard.
Months in Service metrics can be generated for any available coverage.
Sample (Days to Sale Selection) and all vehicle sales are available.
Markets can be combined to generate a “Global” warranty metric.
EPUS can be reported in Local Currency.
All Product Teams can be combined to generate a corporate total metric.
Corporate Body Models are available for queries.
Component Typing has been changed to represent vehicle populations.
Reporting by Part Numbers is now available.
Data extraction has been improved with a new “Export” feature. The format for
exported data is now user defined.
Advanced Reporting is done on a real time basis. No more overnight processing
for custom reports.
Link to EWT from all reporting screens.
Link to QNA from the claim report generated by the EWT link.
1
3/1/2010
Warranty Information System
Logon Procedures
WIS is accessed using either Internet Explorer™ (IE) through the following URL:
http://aqip02.intra.daimlerchrysler.com/WIS/servlet/com.dcx.quality.aqip.qir.WisServlet
or through Covisant (external suppliers).
Make sure that the IE software is at least version 6.0 or higher. Upon accessing the WIS
URL, users will be prompted to input their TID and password into the sign-on window
and click on the “OK” button:
Note: Use your mainframe TID and password. If you do not know your mainframe
password, go to the “ME” section on the Chrysler Dashboard and select the “Change
Password” option to establish/reset your password.
2
3/1/2010
Warranty Information System
WIS Report Selections
Once logged in, the WIS Home page will appear:
Using the mouse, click on the feature desired.
Status Summary:
Displays specific information by Product Lines, Assembly Plants, Part Number, labor
operation codes (LOP), etc.
Top Problems:
Displays top problems by the first six positions of the LOP or by part number for
specified Product Line, Functional Group, SMLC, or Assembly Plant
MOP/MIS:
Displays all matrices and provides data export and charting. This is the only area within
WIS where the “Chart” feature is available.
Supplier Targets:
Tracks outside supplier warranty targets.
Advanced Reports:
Allows users to customize their own reports.
3
3/1/2010
Warranty Information System
Status Summary Field Definitions
The following Status Summary Parameters screen allows the user to perform various
queries of the available warranty data (C/1000, EPUS, and Cost/Condition).
Metric/Vehicle
Metric:
Select the radio button for either “Miles in Service” or “Months in Service” (MIS defaults
to “Months in Service”). Both metrics are calculated from the date that the customer
(retail or fleet) takes delivery of the vehicle from the Dealer.
Model Year:
Use the drop down box to determine what Model Year will be defined as the Current for
comparable calculations. WIS has six Model Years’ of data, but only three will appear
on the metric report.
4
3/1/2010
Warranty Information System
Vehicles:
Select the radio button to determine whether all sold vehicles are included in the metric
calculation or only the “Days to Sale Selection” population defined by the sales market.
This is calculated using the J-Status build date on the vehicle record and the date the date
the customer bought the vehicle. The Days to Sale Selection was previously known as
“Sample”.
Sales Divisor:
The Sales Divisor has two selections, the optional setting of "Standard or CT/SMLC So
Equipped" and the default setting of "Non 'CT/SMLC' Specific". In the default setting
the calculation is based on the total population of vehicles. In the “So Equipped” setting
the calculation is based on the population defined by the component type (sales code)
For example, to find the cost of RES radio repairs (086002) on 2008 RT’s equipped with
the RES radio, select the “So Equipped” optional setting. On the other hand, to find the
cost of RES radio repairs spread over the entire 2008 RT population, the “default” setting
should be selected.
Currency:
The Currency option has two selections, the default setting of "USD" and the optional
"Local". The optional "Local" selection calculates EPUS using the Local Currency for
International Markets. To use this selection all the Business Centers selected must report
in the same Local Currency. For example, you cannot mix Peso’s with Euro’s.
Clicking on Exchange Rate will bring up a listing of Country, Currency, Effective Date,
and corresponding exchange rate.
Coverage:
Use the drop-down window button to display and select one of the available warranty
coverages.
5
3/1/2010
Warranty Information System
Market/Platform
Fleet/Retail:
Determine which type of sold vehicles to include by selecting All, Fleet, or Retail.
Market:
Determine which sold market by selecting All or one of the specific sales markets.
Multiple markets may be selected by holding the Shift or Ctrl key down while clicking on
the various selections.
Product Team:
Determine which Product Teams to include. Multiple Product Teams may be selected by
holding the Shift or Ctrl key down while clicking on the various selections.
6
3/1/2010
Warranty Information System
Query Rule
Inputs into the Query Rule fields allow the user to determine how detailed the metrics
should be. Most fields currently active and underlined have pop-up windows to assist in
the selection process. The following example represents all 2008 MY Product Lines
defined for the Car and Minivan Product Team.
The following provides a brief description of each of the Query Rule fields:
PL:
Product Line (PL, RS, DN, WJ, etc.) Product Line is a field created for reporting in WIS
and EWT. It allows easy viewing and reporting of commonly separated, or combined,
vehicles. In the above example, the Grand Cherokee, WK family, is separated by
whether or not it is a LHD (WK Product Line) or RHD (WR Product Line) vehicle.
FM:
Family is the first two positions of the Corporate Body Model Code (HB represents
Durango, RT represents Caravan / Town & Country, etc.)
LN:
Line or Carline is the third position of the Corporate Body Model Code.
PC:
Price Class (High Line, Low Line, etc.) is the third position the Corporate Body Model
Code.
7
3/1/2010
Warranty Information System
BS:
Body Style (2-door, 4-door, Convertible, etc.) is the last two positions of the Corporate
Body Model Code.
AP:
Assembly Plant (SHAP, Toluca, JNAP, etc.)
FG:
Functional Group is the 1st and 2nd digits of the labor operation code (LOP). It defines
the major categories (Suspension, Brakes, Engine, etc.).
CG:
Component Group is the 3rd and 4th digits of the LOP and is a sub-category of the
Functional Group. A Component Group cannot be selected without first selecting a
Functional Group.
CC:
Component Code is the 5th and 6th digits of the LOP and is a sub-category of the
Component Group. A Component Code cannot be selected without first selecting a
FG/CG combination.
OP:
Operation Code represents the 7th and 8th or the last two digits of the LOP and is a subcategory of the Component Code. An Operation Code cannot be selected without first
selecting a FG/CG/CC combination.
FC:
Failure Code is not a part of the LOP. It simply describes the reason the warranty repair
was done.
FGCGCC:
6 Position LOP or Top Problem
CTC:
Component Type Class identifies a class of vehicle components (engines, transmission,
wheels, etc.).
CT:
The Component Type identifies the number of vehicles equipped with specific
components identified by sales codes. For example DFF is the sales code for the 4 Speed
41TE Transmission. The resulting metrics is then based on that population of vehicles if
the “So Equipped” Sales Divisor is selected.
SMLC:
Supplier Manufacturing Location Code as assigned in the Purchase Order system.
8
3/1/2010
Warranty Information System
PN:
Part Number selected as the failed part on the warranty claim.
LCC:
Local Commodity Code as defined in the Purchase Order system..
CD:
Commodity Director is a designation within Supplier Quality. QM, or Quality Manager,
is a subset of CD.
QM:
Quality Manager is a designation within Supplier Quality. QS, or Quality Specialist, is a
subset of QM.
QS:
Quality Specialist is a designation within Supplier Quality.
IMKT:
International Market may represent a single country such as the USA or a group of
countries such as Europe.
RGN:
Region/Business Center represents a subset of the International Markets defined in the
IMKT field.
BC:
Business Center represents a subset of the IMKT/RGN combination.
Report By
“Report By:” determines the list of items for the Status Summary description column.
The user may select one item from the pop-up window or inputting the wildcard sign/s
(=) into the Query Rule field will generate the same results.
9
3/1/2010
Warranty Information System
Status Summary Results
Sales:
This represents the recorded number of vehicles Chrysler Group Dealers sold to
customers when the system was loaded. Sales volumes can either be all vehicles sold or
the sample population.
Current C/1000, EPUS, or Cost/Condition:
Current metrics represent the latest Model Year’s warranty activity in the system or the
prior Model Year as determined by the user. All metrics are based on the Model Year’s
population of recorded sold vehicles prior to the last system update.
Comp C/1000, EPUS, or Cost/Condition:
Comparable (Comp) metrics are a look at the prior Model Years’ warranty metrics to see
how they would compare to the same number of Months of Production (MOP)/Months in
Service (MIS) as the Current Model Year.
YTD C/1000, EPUS, or Cost/Condition:
Year-to-date (YTD) equals the total Model Years’ warranty through the current reporting
period.
Current to Comp:
The first of the two columns defines the delta between the Current and Comp columns,
while the second indicates the percentage of change between the Current and Comp
columns.
10
3/1/2010
Warranty Information System
Status Summaries Query Example
To begin the Status Summaries query process, click on “Status Summary” at the top of
the WIS Home Page:
From the Parameters tab, select the Metric/Vehicle Definition, Market/Product Team,
Query Rule, and Report By as indicated below and click on the C/1000 metric tab.
11
3/1/2010
Warranty Information System
Once the C/1000 metric query results are displayed, drilling down through the various
levels to accomplish with the following:
1. Select the radio button next to one of the description list items.
2. Select the level from the “Next” `pop-up window.
3. Click the “GO” button.
Select “Durango/Aspen (HB)” from the description list, “Functional Group” from the
“Next” pop-up window and press “GO”.
12
3/1/2010
Warranty Information System
Select “Electrical (08)” from the description list, “Component Group” from the “Next”
pop-up window and press “GO”.
Select “Motors/Modules (0852)” from the description list, “Component Code” from the
“Next” pop-up window and press “GO”.
13
3/1/2010
Warranty Information System
Select “Module, heated seat control (085234)” from the description list, “Operation
Code” from the “Next” pop-up window and press “GO”.
Select “TOTALS” from the description list, “Failure Code” from the “Next” pop-up
window and press “GO”.
14
3/1/2010
Warranty Information System
The following lists all the Failure Codes Dealers selected as the reason why the Keyless
Entry was replaced (LOP 088028).
To switch to another metric (C/1000 to EPUS), simply click on the desired metric tab.
15
3/1/2010
Warranty Information System
Top Problems by Part Number
Top Problems provides a listing of the top LOP’s or Part Numbers in metric descending
order based on the parameters selected. After selecting the Top Problems feature, the
Parameters tab will be displayed. RT will be used for the following example.
Note: If a prior query was run, the Parameters default to those selected for the prior
query.
Similar to a Status Summary report, a Top Problems report also provides a three Model
Year comparison. The previous Model Years’ Comparable metrics are calculated based
on Current Year sales.
16
3/1/2010
Warranty Information System
With the top ten C/1000 Part Numbers for RT displayed, clicking on the EPUS tab will
display the corresponding EPUS values for the top C/1000 Part Numbers.
To display the top EPUS Part Numbers for RT, simple click on the “Current EPUS”
header and the system will redisplay the Part Numbers in descending EPUS order.
17
3/1/2010
Warranty Information System
Top Problems by LOP
The parameters below are the same as the prior example for Top Problems by Part
Number, except the type of report selected is LOP.
In this example only the Top Problem selection has been set to 3.
Which gives the resulting report:
18
3/1/2010
Warranty Information System
MOP/MIS
The MOP/MIS feature is where the matrices are located. Matrices contain all of the
Months of Production (MOP) and Months in Service/Miles in Service (MIS) metric data
for the current and prior Model Years. They may be viewed, printed, charted or exported
for use in a PC application, i.e., MS Excel or MS Access.
After selecting the MOP/MIS feature, the Parameters tab is displayed. It is similar to the
Status Summary except the “Report By:” is not available.
19
3/1/2010
Warranty Information System
Cumulative C/1000 Matrix:
The following is the 2008 Cumulative C/1000 matrix for LX.
The x-axis represents the MOP’s. A normal system Model Year launch timing, has
production beginning in the month of August (Note: If the Model Year actually launches
in July, vehicles built in July and August are lumped into the AUG MOP).
The y-axis represents the MIS. MIS is measured from the time the vehicle is sold to
either the retail/fleet customer. 0 MIS is the pre-delivery warranty activity on the sold
vehicles.
20
3/1/2010
Warranty Information System
Conditions Matrix:
The Conditions Matrix can be selected from the drop-down window on the C/1000 tab.
This matrix contains the number of conditions (repairs) for the criteria specified in the
Query Rule. Conditions are the numerator in the C/1000 calculation.
To interpret the Conditions Matrix above, focus first on the Aug column. The first
number in the Aug column indicates vehicles in the system experienced 22 repairs before
they were sold. In the next row, 19 repairs occurred between 0 and 1 MIS. This same
approach can be applied to the remaining Months of Production.
21
3/1/2010
Warranty Information System
CLM Link:
To view the claim detail you may select the CLM button on any report. Selecting the
CLM button by a MOP, as shown below, will link you to a EWT claim report of those
repairs. The following claim report was retrieved by selecting the CLM button for the
Mar MOP. Note that there are 25 claims listed below but only 15 conditions in the
matrix. One reason for the difference may be “continuation claims”. These are repairs
which are submitted on more than one claim but for only one repair. WIS “knows” it was
only one repair and therefore counts it only once, but the claim report will show them all
for analysis purposes.
QNA Link:
The QNA button will take you to a listing of narratives for these warranty claims. The
following link will take you to the QNA system. For further information concerning
QNA, please see the Help Document link located in the upper right hand corner of the
QNA homepage.
http://aqip01.intra.daimlerchrysler.com/Qna/Qnahome.do
The GCS button will take you to the Global Claims System for complete details
concerning the vehicle and repairs. For further information concerning GCS, please see
the Glossary link located on the GCS toolbar.
22
3/1/2010
Warranty Information System
Lag Factored Sales:
The Lag Factored Sales Matrix contains the number of vehicle sales reported before the
last WIS update. Lag Factored Sales are the denominators used for the C/1000 and EPUS
metric calculation.
Focusing on the Aug column in the example below, there were a total of 434.03 sales as
indicated in the 0 MIS. Of these 434.03 sales, only 433.28 have reached 1 MIS, 431.51
2 MIS, and 426.64 3 MIS.
Because WIS only calculates metrics based on paid warranty claims, Lag Factors are
applied to the vehicle sales to statistically compensate for unpaid warranty conditions.
Typical reasons for unpaid conditions include:
1. Dealers have 90 days to submit claims after the actual repair date.
2. WIS is only loaded once a month, many claims miss the payment cutoff date and are reported
in the following 30-day period.
3. As many as 30% of all claims are rejected on the first submission.
Each month WIS calculates the factors used to lag the sales data. Claim payment
experience is analyzed over an 18-month period. The claims are segregated according to
the month incurred and month paid and percentages are calculated based on this
information.
23
3/1/2010
Warranty Information System
Calculating C/1000, EPUS, & Cost/Condition
WIS calculates the metrics using “Matrix Math”, the following examples will focus on
the Minivan’s Aug MOP to demonstrate how C/1000, EPUS, and Cost/Condition
matrices are derived.
Cumulative C/1000:
C/1000 = (Raw Conditions divided by Lag Factored Sales) times 1000
MIS 0: (736/7,598.90)*1000 = 96.8561
MIS 1: (1,221/7,588.01)*1000 = 160.9117
Because the matrix is cumulative, the 96.8561 must be added to the 160.9117 for a
rounded Cumulative C/1000 at 01 MIS of 257.7678 for the Aug MOP. This method is
applied to each column of the Cumulative C/1000 matrix.
24
3/1/2010
Warranty Information System
Cumulative EPUS:
EPUS = (Raw Expense divided by Lag Factored Sales)
MIS 0: (128,070.26/7,598.90) = 16.8538
MIS 1: (205,341.27/7588.01) = 27.0613
Because the matrix is cumulative, the 16.8538 must be added to the 27.0613 for a
rounded Cumulative EPUS at 1 MIS of 43.92 rounded for the Aug MOP. This method is
applied to each column of the Cumulative EPUS matrix.
25
3/1/2010
Warranty Information System
Cost per Condition
CST/C = (EPUS divided C/1000)*1000
MIS 0: (16.8538/96.8561) * 1000 = 174.0086
MIS 1: (43.9151/257.7678) * 1000 = 170.3668
26
3/1/2010
Warranty Information System
Calculating Prior Comparable Cumulative C/1000
The 2 matrices used are the Current Lag Factored Sales Matrix and the Prior Cumulative
C/1000 (or EPUS) Matrix. The following example uses C/1000 at 3MIS.
CURRENT LAG FACTORED SALES MATRIX
Month of Production
MIS
0
1
3,857.51
2
2,441.06
3
1,164.99
4
387.27
5
17.61
Total
7,868.43
1
3,726.71
1,984.61
632.55
118.07
-
6,461.94
2
3,215.00
963.17
107.73
-
-
4,285.90
3
1,911.80
178.32
-
-
-
2,090.13
5
20.71
Total
N/A
PRIOR CUMULATIVE C/1000 MATRIX
Month of Production
MIS
0
1
28.47
2
19.98
3
17.16
4
23.78
1
80.75
73.26
62.66
78.55
81.4
N/A
2
107.67
116
94.99
121.8
130.05
N/A
3
150.12
152.64
128.13
167.21
166.19
N/A
The Prior Year Cumulative C/1000 Matrix must be "de-cumed". This will leave us with
the Incremental C/1000 for each cell in the matrix.
PRIOR INCREMENTAL C/1000 MATRIX
Month of Production
MIS
0
1
28.47
2
19.98
3
17.16
4
23.78
5
20.71
Total
N/A
1
52.28
53.28
45.5
54.77
60.69
N/A
2
26.92
42.74
32.33
43.25
48.65
N/A
3
42.45
36.64
33.14
45.41
36.14
N/A
Each cell in the Prior Incremental C/1000 Matrix is multiplied by the corresponding cell
value in the Current Lag Factored C/1000 Sales Matrix. This generates the Prior
Comparable Raw Conditions. For example:
28.47 * 3857.51 = 109823.3
52.28 * 3726.71 = 194832.4
PRIOR INCREMENTAL C/1000 MATRIX multiplied by CURRENT LAG FACTORED SALES MATRIX
Month of Production
MIS
1
0 109823.31
1 194832.4
2
3
2
3
4
5
48772.3788
19991.2284
9209.2806
364.7031
Total
188160.9
105740.021
28781.025
6466.6939
86547.8
41165.8858
3482.9109
0
0
81155.91
6533.6448
0
0
0 87689.555
27
0 335820.14
131196.6
3/1/2010
Warranty Information System
Divide the Prior Comparable Raw Conditions from the "Total" column by the
corresponding cell value in the Current Lag Factored C/1000 Sales Matrix.
MIS
0
Prior
Comparable
Incremental
C/1000
Calculation
Used
23.9133983
(188160.9 / 7868.43)
1
51.96893479
(335820.1 / 6461.94)
2
30.61121274
(131196.6 / 4285.90)
3
41.9541152
(87689.55 / 2090.13)
The Prior Comparable Incremental C/1000 are then summed into the Prior Comparable
Cumulative C/1000.
MIS
0
Prior
Comparable
Cumulative
C/1000
Calculation
Used
23.9134
23.913398
1
75.8823
(23.913398 + 51.968935)
2
106.4935
(75.882333 + 30.611213)
3
148.4477
(106.493546 + 41.954115)
The 148.4477 rounds to 148.45 which is reflected on the Status Summary report below.
28
3/1/2010
Warranty Information System
Charting
The WIS Charting feature generates three standard graphs (Consecutive, Sales, and
Overlay). The Chart feature is only available within the MOP/MIS section of the system.
Once parameters are defined on the MOP/MIS Parameters tab and a matrix is displayed,
the Chart feature becomes active.
29
3/1/2010
Warranty Information System
After the matrix is displayed and the Chart feature is selected, the Chart Controls window
will appear.
Chart Controls
Determines what types of graph/s to display along with how the “Y” axis is defined.
Months of Production:
Determines how many MOP’s are to be displayed for each Model Year.
Months in Service:
Determines which MIS rows are plotted.
30
3/1/2010
Warranty Information System
Clicking on the “Chart” button on the Chart Controls window opens a new browser
session with the graphs in a print-preview mode. Graphs can be viewed on-line by
scrolling or printed using the browser’s print command. Also, each graph is displayed as
a separate picture. The graph can be saved, printed, or copied by either using the “mouse
over” option, or by right clicking on the graph.
Consecutive Graph:
On the following C/1000 Consecutive graph, the “Y” axis is the C/1000 value and the
“X” axis the various MOP’s for each Model Year selected. Each line on the graph
represents a specific MIS row from the matrix.
Sales Graph:
The Sales graph displays the vehicle sales for each MOP. In the event there is a metric
spike for a specific MOP, the Sales graph should be reviewed to determine if the spike is
the result of low volume.
31
3/1/2010
Warranty Information System
Overlay Graph:
An Overlay graph depicts the “Total” column values from the respective matrix. In the
example below, the “Y” axis reflects the total cumulative C/1000 values while the “X”
axis indicates the various MIS for the Model Years selected.
32
3/1/2010
Warranty Information System
Supplier Targets
The Target Screen calculates the Fulfillment rate used in the External Balanced
Scorecard. The fulfillment rate (FFR) from the supplier target screens are transferred for
each supplier manufacturing location by commodity. Additional information on target
setting and the Fulfillment rate calculation can be found on the Warranty Reduction
Program website.
http://icon.intra.daimlerchrysler.com/wi/clients/sqwrp_e
Select the Commodity then select the C/1000 tab.
33
3/1/2010
Warranty Information System
The resulting report is by Supplier Manufacturing Location Code. The first three
columns should be familiar. They are the Current C/1000, the Comparable (or Comp),
and the percentage better/worse to last years comparable number. The Target column is
based on the Fulfillment Rate calculations found on the Warranty Reduction Program
Website. The next column is the supplier identified as the Best Current Score Supplier.
The last column is the Fulfillment Rate which is transferred to the External Balanced
Scorecard.
The EPUS tab displays the same type of information found on the C/1000 tab.
34
3/1/2010
Warranty Information System
Printing
To print data generated from WIS queries, first select the “Print” command in the WIS
title bar. This opens a new browser window with the data in a print preview mode.
Once the new browser is launched with the data in a print preview, use the browser’s
print command to send the data to a user-defined printer or file.
35
3/1/2010
Warranty Information System
Export
WIS data can be downloaded into a Comma Separated Value (*.csv) format file using the
“Export” command on the WIS Title Bar. Once a report is displayed such as the Status
Summary C/1000 report below, clicking on the “Export” command will be begin the
download process.
Export Controls - Standard:
Standard Reporting Export Controls provide options for exporting only the data displayed
in the report (Report View) or all the metrics for each line item in the report (Data
Extract).
36
3/1/2010
Warranty Information System
Export Controls – Advanced Reports:
Advanced Reports Export Controls provide options for exporting .
37
3/1/2010
Warranty Information System
The first 3 sections of the Advanced Export Control box contains the same parameters
found on the parameters tab in the Status Summary report, as well as throughout WIS.
This allows you to delimit the data you export from the job.
The next section, Report By, allows multiple selections which that data will be
summarized by.
The next 3 sections, Months of Production, Months in Service, and Miles in Service will
allow you to select the level of detail or summary for each of those choices.
After selecting the parameters, click on Export and Internet Explorer will open the
following window. Selecting “Open this file from its current location”, will
automatically open the text file with an application defined by the user. If a *.csv file has
not previously been opened on the PC, the system will prompt the user to select an
application.
Selecting “Save this file to disk” will simply save the data as a *.csv file to the user
defined folder location.
38
3/1/2010
Warranty Information System
Advanced Reports
In most cases, WIS Standard Reports (Status Summary, Top Problems, and MOP/MIS)
will achieve the reporting needs of the user. When scenarios arise where it is not possible
to extract a metric using the Standard Reporting features, the Advance Reports feature is
available.
Some reporting requirements that must use the Advance Reports options include, but are
not limited to:
Combining multiple Query Rules
Excluding data
Reporting on a MIS other than the current system MIS
Advanced Reports are accessed from the WIS Home Page. The “Advanced Reports”
command toggles between Standard Reports and the Advanced Reports.
39
3/1/2010
Warranty Information System
Jobs:
The Jobs tab contains data extracted from the system. The first time the Advanced
Reports feature is accessed, the Jobs tab will be empty. Each month the system is
updated with new MIS data, all users Jobs are deleted.
All Jobs have unique Job ID’s (Jid). They are created when a Query is submitted against
the database.
Refresh:
Refreshes the screen and updates the Status.
ResubmitFTP:
Resubmits only the FTP for the selected job.
Resubmit:
Resubmits the selected Job against the database. The “Processing Start Date” and
“Processing End Date” will update accordingly.
Abort:
Aborts the processing of a selected Job.
Delete:
Deletes the selected Job.
40
3/1/2010
Warranty Information System
Queries:
The Queries tab contains user-defined queries that are submitted against the database to
extract data. Queries are defined using the Parameters and Rules tab. The Scheduler tab
determines the submit frequency for the query. The first time the Advanced Reports
feature is accessed, the Queries tab will be empty.
All Queries have unique Query ID’s (Qid). Qid’s are assigned when a new Query is
saved/submitted against the database.
To start a query, select New. A pop-up box allowing you to enter a name will appear.
41
3/1/2010
Warranty Information System
Parameters:
Similar to Standard Reports, the Vehicles, Model Years, Coverage, Fleet/Retail, Market,
and Product Team/s are selected during the Query definition process.
Note: Make sure to select a minimum of two Model Years.
42
3/1/2010
Warranty Information System
Rules:
Vehicle, LOP, Other, and Combination the groupings available to define the Rules during
the Query definition process. The fields contained in each section are the same as those
used in Standard Reporting. Each field will allow multiple codes separated by commas
and will accommodate up to 255 characters.
Save:
Saves the Query with the current defined Parameters and Rules
Clear:
Clears all Rules’ field entries, or for just that grouping where Clear is selected
Reset:
Resets all Rules to the last saved, or for just that grouping where Reset is selected
Exclude:
Checking the “Exclude” box, excludes all data (expense and sales) defined by the rule
Select Row:
Use the “Select Row” box with the Clear , Delete, or Zoom command
Zoom:
As each field can contain up to 255 characters, the Zoom command allows viewing of
selected field entries that extend beyond the normal field window
Delete:
Deletes the row where the Select Row box has been checked
43
3/1/2010
Warranty Information System
Add:
The Add command in each Rule section can be used to insert additional rows. Clicking
on Add will open the following window. In the box to the right of “New rows”, input the
number of additional rows desired and click on “OK”.
Using the Drop Down box, you can select to Add a link from another query, or Copy
from another query. To Link to , or Copy, another query you must know the Query ID.
The Link function allows you to use another query as it is at the time you run it. If the
query you are linked to changes, your query will also then run with those changes.
The Copy function allows you to copy into your query the parameters of another query.
44
3/1/2010
Warranty Information System
Scheduler:
Once a Query has been defined, it can either be saved for use at a later time and a Query
ID will be assigned, or it can be submitted creating a Query ID and a Job ID.
Save:
Saves the Query and assigns a unique Qid.
Submit:
Saves the Query and creates a Job ID with the data extracted from the database.
Query Name:
Allows the Query Name to be modified.
Folder:
To keep Queries organized, Queries can be saved under different user defined folders.
Folder commands include New, Rename, and Delete.
Frequency:
“On Demand” will generate a Job when the Submit command is selected.
“Monthly” will generate a Job only when the system is updated with the next MIS load.
***NOTE: The query must have the Frequency set at Monthly and ALSO be in Submit
status for it to automatically be run with the next MIS load.
Description:
Allows text input to describe the Query.
45
3/1/2010
Warranty Information System
FTP Site:
The FTP site is for internal DCX users only. This function allows for the job output to be
sent to your LAN Server. The WIS Contact person listed on the homepage of WIS can
facilitate your request.
Export Controls:
This allows you to set up the file to be FTPed to your LAN Server.
46
3/1/2010
Warranty Information System
Performing Queries on Jobs:
Jobs are created from Queries submitted against the WIS database. Performing queries
on Job data is done from the Jobs tab. When the Job Status states “Completed”, select
the Job by clicking its radio button. Now, the Status Summary, Top Problems, or
MOP/MIS feature may be used to perform queries on the data.
Using Advanced Reports Data
After the Job has been selected, you can use any of the Reports previously covered in the
manual. However, options will be limited based on the Parameters and Rules defined in
the Query used to generate the Job.
Warranty Information System Training
Online training is available via TEDS course code DQIWIS101.
47
3/1/2010