1
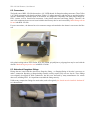
RD2: 250-280 Detector, User Manual
1
REACH Devices
RD2: 250-280
2-Channel Preparative Chromatography Detector
User Manual
(for unit with the serial numbers 1430-0-0000 and up)
Innovative Equipment Designed by
and for Synthetic Organic Chemists.
6525 Gunpark Drive
Suite 370-179
Boulder, Colorado, 80301
USA
Phone:
(720) 288-5722
e-mail: [email protected]
RD2: 250-280 Detector, User Manual
2
Table of Contents
1. Overview............................................................................................................................................. 3
2. Powering unit on and power outages...................................................................................................4
3. List of supplied parts (may vary with the model)..................................................................................4
4. Safety.................................................................................................................................................. 4
5. Flow cell chemical compatibility and care............................................................................................5
6. Attaching RD2: 250-280 detector to the column..................................................................................5
6.1. Column pressure.......................................................................................................................... 5
6.2. Connectors................................................................................................................................... 6
6.3. Note about flangeless fittings.......................................................................................................6
6.4. Glass column adapter..................................................................................................................7
7. Running columns with RD2: 250-280 detector.....................................................................................8
7.1. Before you start............................................................................................................................ 8
7.2. Welcome Screen.......................................................................................................................... 8
7.3. Detailed description of Acquisition Mode......................................................................................9
7.4. Detailed description of Settings Menu........................................................................................11
7.4.1. Change of detector Parameters.......................................................................................11
7.4.2. Calibration........................................................................................................................ 12
7.4.2.1. Test of external equipment.................................................................................13
7.4.2.2. Zero................................................................................................................... 14
7.4.2.3. Set Energy.........................................................................................................14
7.4.2.4. Calibration Charts..............................................................................................15
7.5. Fraction collectors and other external equipment.......................................................................16
7.5.1. General information .........................................................................................................16
7.5.2. Attaching fraction collectors ............................................................................................17
8. Setting up the valves......................................................................................................................... 17
8.1. Overall description..................................................................................................................... 17
8.2. Editing the Valve Table............................................................................................................... 19
8.3. Optional relays........................................................................................................................... 20
9. Import of data.................................................................................................................................... 20
9.1. Import to Excel........................................................................................................................... 20
9.2. Import to MathCAD.................................................................................................................... 21
10. Firmware download......................................................................................................................... 22
11. Appendix 1: Optical path-length.......................................................................................................23
12. Appendix 2: Legal disclaimer........................................................................................................... 24
RD2: 250-280 Detector, User Manual
3
1. Overview
RD2: 250-280 is a stand-alone detector for preparative chromatography designed to operate with conventional
glass chromatography columns, FPLC chromatography systems, or preparative HPLC columns. Operation with
analytical HPLC columns is not advised due to RD2's relatively large flow cell volume (150 uL). The detector
employs standard 1/4” 28TPI connectors, and is compatible with any organic or aqueous media, excluding
hydrofluoric acid and concentrated (>10% vol) hydrogen peroxide.
The detector is designed to minimize resistance to solvent flow rates of up to 300 ml/min. Therefore, even simple
gravity chromatography can be carried out with RD2: 250-280.
A unique feature of RD2: 250-280 design is that UV absorption data is simultaneously collected for optical pathlengths from 0.001 to 10 mm. For user's convenience, the data is presented as if the acquisitions occurred using a
10 mm or 1 mm optical path-length with up to 100 AU (Absorption Units) range. The apparent optical pathlength
can be changed by user at any time by simply pressing the detector's softkey. Unlike other UV monitors, the
chromatogram collected by the RD2 detector does not plateau when the concentration of UV-absorbing
compounds is high, allowing the user to see true analyte peaks as they leave the column. For more information see
Appendix 1.
The RD2: 250-280 detector simultaneously records the following properties of the elutant:
1. Optical density at 250 nm (10 nm bandwidth) in 0.001-100 AU range for the theoretical 1 mm or 10 mm
optical path length with 0.0001 AU resolution
2. Optical density at 280 nm (10 nm bandwidth) in 0.001-100 AU range for the theoretical 1 mm or 10 mm
optical path length with 0.0001 AU resolution
The measured data is recorded to non-volatile memory of the detector according to the acquisition rate setting.
This rate parameter may be selected by user to take measurements within every 0.2 to 10 seconds, which
corresponds to acquisition rates of 5 to 0.1 Hz. Note that the 5 Hz acquisition rate setting leads to a rapid (about 7
hours) filling of the detector memory, while the 0.1 Hz rate allows for 15 days of continuous data collection. Data
acquisition can be stopped/resumed many times during the run. Unexpected power outage or detector's shut-off
does not corrupt, erase, or alter the collected data in any way, and normal acquisition will be automatically
resumed from the last point collected after the unit is powered on again. The data collected can only be erased by
pressing the “New run” soft key.
The unit color display shows the data being collected in real time. Zoom is automatically adjusted so that every
newly acquired point will land within screen coordinates. The user may switch on/off UV at 280 nm trace, (UV at
250 nm trace that is always on) and adjust zoom during data acquisition.
The collected data can be transferred onto a conventional flash drive. The file written is a space delineated text
file, which can be imported into Excel, MathCAD, KaleidaGraph, R, MATLAB, or any other software capable of
building 2D graphs.
The RD2: 250-280 is equipped with a real time clock powered continuously by a 3V lithium battery (CR2430).
The battery should last for at least 5 years after which it needs to be replaced. Access to the battery is achieved by
counter-clockwise twisting of the battery cap on the bottom of the detector unit.
There is a communication interface built in RD2: 250-280 that is physically arranged as a female 8-pin socket on
the back of the detector. This interface includes 1 analog output, and a single digital input which can count
external electrical pulses (such as fraction change events in a fraction collector).
RD2: 250-280 Detector, User Manual
4
2. Powering unit on and power outages
RD2: 250-280 detector is not a battery-powered device, thus it cannot collect data without the line power.
The close proximity of conductive or flammable elutants to a source of electrical sparks or to power sockets is
hazardous. Unfortunately, there are no true waterproof switches on the market that fit the small size of the
detector's housing and have the needed electrical ratings. To provide maximum safety the RD2: 250-280 detector
unit does not have a power switch:
•
•
The detector is powered on from its keyboard by pressing two keys simultaneously as engraved on the
detector housing.
To switch the unit off the operator needs to go to “Help/Off ” menu and press “Turn Unit Off“ softkey.
Normally, the detector must be disconnected from line power if it is not in use for more than 24 hours. However,
if the detector is permanently situated in a cold room (4 oC) with high humidity, it should remain connected to a
power line to maintain detector's housing temperature slightly above 4 oC, thus preventing water vapor
condensation inside the unit.
An unexpected power outage would not disrupt the detector operation or cause data corruption. If the outage
happens during data collection, the detector will shut down but turn on again and smoothly resume data collection
after the power is on. If the detector was powered off from the keyboard, it will remain in this state after power is
back on after an outage.
However, if the unlikely power outage happens during data transfer to a flash drive, the data on the flash drive
may become corrupted. The flash drive may need formatting after the incident. Again, detector's internal data
would remain intact.
3. List of supplied parts (may vary with the model)
1. RD2: 250-280 detector unit, 90-240 VAC
2. One power cord, country style specified at purchase
3. Three 1/16” tubing connectors with ferrules, material: Teflon
4. Three 1/8” tubing connectors with ferrules, material: Teflon
5. One Male Luer Lock to 1/4”-28TPI male thread connector, material: PEEK
6. One Female Luer Lock to 1/4”-28TPI male thread connector, material: PEEK
7. One universal connector to a glass column, PTFE/Nylon-12, with two sets of three Viton O-rings
8. 4 feet of 1/16'' PTFE tubing (1/32” bore)
9. 4 feet of 1/8'' PTFE tubing (1/16” bore)
10. Connector cable to the customer-specified fraction collector (if applicable)
4. Safety
RD2: 250-280 detector was designed for usage in synthetic organic chemistry labs, where corrosive atmospheres
exist and solvent splashes happen. The unit case is made of anodized titanium – no peeling paint, and the LCD is
protected with a glass sheet. However, the unit may not be used in an explosive/flammable/highly corrosive
atmosphere or be submerged in any liquid. Standard safety practices, pertinent to the workplace, must be carried
out at all times. REACH Devices shall NOT be liable for any personal injury or property damages resulting from
the use or misuse of this device.
RD2: 250-280 Detector, User Manual
5
5. Flow cell chemical compatibility and care
The unit's flow cell has the following features:
•
•
•
•
0.15 ml total volume
accepts 2,500 psi maximum pressure (see Chapter 6.1 for details)
wetted materials: quartz, sapphire, Teflon and anodized titanium
low hydrodynamic resistance
The flow cell of the detector is compatible with almost all solvents and reagents. However, the following
chemicals will cause rapid deterioration of the unit:
•
•
•
•
Aqueous and nonaqueous solutions containing free hydrofluoric acid (HF) cannot be allowed to make
contact with the flow cell, even intermittently. Please understand that HF is a weak acid and will form in
any acidic solution which contains fluoride anions (like NaF + HCl or even TBAF + Acetic Acid).
Fluorinating agents like DAST (dimethylaminosulfur trifluoride), SF 4 solutions, and the like, are all
incompatible with the flow cell. Immediate severe and irreparable damage to the flow cell will result upon
exposure to any of these chemicals.
Concentrated (>10% vol) hydrogen peroxide, especially in the presence of strongly chelating compounds,
such as EDTA or glycolic acid, slowly dissolves titanium.
Strong hot aqueous alkaline solutions (like 40% NaOH at 50 oC) will cause corrosion of quartz and
titanium surfaces and thus are not recommended for use with the detector.
Fuming nitric acid may react with titanium.
After using the device, it is imperative to rinse the flow cell with a compatible solvent.
For example, if an aqueous phosphate buffer was inside, rinsing with, say, methanol, will precipitate salts from the
buffer and clog the flow cell. Use water in this case. Likewise, if a solution of a hydrophobic organic compound
in acetonitrile was inside of the flow cell, then rinse with acetonitrile, not water.
Avoid introduction of immiscible solvents into the flow cell. For example, if hexane needs to be replaced with
water, rinse with acetone first (acetone is miscible with hexane and with water), then with straight water.
The detector must be disconnected from liquid lines if it is not in use for more than 24 hours.
6. Attaching RD2: 250-280 detector to the column
6.1. Column pressure
It is important to realize that the 2500 psi pressure limit does not preclude usage of RD2: 250-280 detector with
an HPLC system where the elutant pressure on the top of the column may reach up to 4000 psi.
There are only two requirements that are mandatory for the safe usage of RD2: 250-280 detector with highpressure systems:
1. The elutant flow may not be restricted downstream of the detector. This rule is especially pertinent to
some fraction collectors that may indeed temporarily restrict flow downstream, for example, by closing a
valve on the collector's intake. If solvent flow may potentially be interrupted in your chromatography setup, a pressure-relief valve must be placed somewhere BEFORE the detector, or the solvent pump must be
switched off during flow interruption.
2. The flow rates of 300 ml/min for 1/8” ID tubing, and 30 ml/min for 1/16” ID tubing may not be exceeded.
This rule is only applicable for low-viscosity solutions, such as water, ethanol or acetonitrile; at higher
viscosity (DMF or DMSO), even slower rates must be used.
RD2: 250-280 Detector, User Manual
6
6.2. Connectors
The liquid ports of RD2: 250-280 detector have 1/4”-28TPI threads for flangeless tubing connectors. Three Teflon
1/16” tubing connectors with ferrules and three Teflon 1/8” tubing connectors with ferrules are provided with the
detector. Additionally, inlet/outlet ports of the detector are designed be compatible with most plastic fittings for
FPLC systems, such as ferrule-based connectors, O-ring based connectors and flange fittings,. Therefore, the
user’s own connectors that were not issued with the detector may also be used successfully. Metal fittings can not
be used with RD2: 250-280.
For user convenience, the detector has a six-connector storage rack attached to the detector's case next to the flow
cell.
Only plastic tubing such as PTFE/Teflon, PFA, FEP, PEEK, polyethylene or polypropylene may be used with the
detector. Metal tubing may not be used with RD2: 250-280.
6.3. Note about flangeless fittings
Fittings that are issued with this detector are flangeless fitting – no flanging/flaring of the tube is necessary to
make a connection. Repairing a flanged tubing assembly usually requires only one new ferrule. These fittings
were originally developed for DNA synthesizers, but later were borrowed by many manufacturers for various
other uses, including FPLC. It is important to assemble the fitting correctly.
Unlike many compression fittings for metal tubes (such as Swagelok), the ferrule must be installed “backwards”
as is shown below:
RD2: 250-280 Detector, User Manual
7
Before assembling the fitting, make sure that the tubing end is squarely cut by a new razor blade and is flush with
the broader ferrule end.
A common assembly problem that often goes unnoticed occurs when the end of the tubing gets slightly pulled out
of the ferrule prior to screw tightening. The subsequent tightening will crush the ferrule. Therefore, it is useful to
slightly push the tubing into the screw nut during tightening. Do not use tools to tighten the connector body.
If a leak occurs, the following must be inspected before more torque is applied to the connector body:
1. There is no foreign material within the connector assembly.
2. The tubing end is not warped, cracked or deformed (this can easily be rectified by cutting off the damaged
end with a razor blade).
3. The ferrule surface is smooth without dents, scratches or deformed areas. Replace ferrule if it is damaged.
6.4. Glass column adapter
The glass column adapter may be used to attach 1/8” or 1/16” tubing to a
conventional glass column.
The adapter works by squeezing a flexible O-ring over a glass column outlet.
Because there is no standard size for outlet diameters, three different sizes of Orings are provided with the adapter. Only one most suitable O-ring should be used at
a given time. The extra rings may be placed onto adapter outer surface for storage
as shown.
By default, the provided O-rings are made of Viton – a brand of fluorocarbon
elastomers. Viton O-rings are fairly stable to most solvents. However, prolonged
exposure (days) to toluene, DMF, DMSO, pyridine or triethylamine
will cause excessive, likely permanent swelling or disintegration. For applications
involving extensive use of the above solvents, blue colored fluorosilicone O-rings
are advised and may be requested on ordering of the adapter. It should be
remembered that the fluorosilicone O-rings are not stable to acetone and other
ketones.
To prolong the useful life span of the O-rings, the glass column adapter should not
be stored attached to a column soaked with solvents. It is a good practice to rinse
the adapter with an appropriate solvent and store it separately from a column in a dry place.
For most glass columns, 1/8” tubing is recommended to minimize the hydrodynamic resistance to liquid flow.
1/16” tubing should be used only for very small glass columns (less than 10 ml volume) to minimize the dead
volume of the system.
RD2: 250-280 Detector, User Manual
8
7. Running columns with RD2: 250-280 detector
7.1. Before you start
RD4: 250-280-RI-Cond is a preparative detector, optimized for flow rates of at least 10 ml/min. At lower flow
rates, an air bubble may be retained in UV/Conductivity flow cell, which would result in decreased absorption
readings.
If you intend to use the detector at < 10 ml/min flow rates, a flowing procedure is advised after detector
unpacking.
1. Run 10% NaOH at 100 ml/min for one minute through the detector.
2. Run an aqueous surfactant (e,g. 1% SDS) at 100 ml/min for at least two minutes.
3. If the initial separation solvent is water-miscible (phosphate buffer), proceed to step 4.
If you intend to begin separation in non water-miscible solvent such as hexane, ethyl acetate or
dichloromethane, rinse the flow cell with methanol, acetone or acetonitrile, then proceed to step 4.
4. Purge RD4 for 15 seconds with the initial separation's solvent at 100 ml/min flow rate.
To use gravity to facilitate air bubble expulsion, the flow must be directed from the lower situated inlet to the
higher situated outlet.
7.2. Welcome Screen
After the detector is powered on, the Welcome Screen will display the following information:
1. Device serial number. This will be also the root directory name where detector will store the data files
on a flash drive.
2. Currents through light sources. The
detector runs each light source (250 nm
UV LED and 280 nm UV LED) so that the
light output is constant. As the light source
ages (or ambient temperature increases),
more current is needed to maintain a set
light intensity. The light sources may
operate at maximum 25 mA current.
3. Elutant temperature, in oC.
4. Optical block temperature, in oC.
5. Memory usage, %.
6. Current date/time. This information is
used to automatically create a correct
directory tree on a flash drive without user
intervention. The correct date/time is
essential for flash drive operation, and may
be set by the user from “Settings” menu.
7. Flash drive presence/absence.
8. Legends over four soft keys:
If a flash drive is not inserted, the legends are: “New Run” “Continue” “Settings” and “Help/Off”.
If a flash drive is inserted, the legends are: “New Run” “Continue” “Save data” and “Help/Off”.
Pressing soft keys at the Welcome Screen menu will accomplish the following:
“Run” – on pressing this softkey, the detector switches to the acquisition mode, see Chapter 7.3 for details.
“Valves” – on pressing this softkey the detector will open the Event Editing screen, see Chapter 8 for details.
RD2: 250-280 Detector, User Manual
9
“Settings” – this function is available only when a flash drive is not inserted. On pressing “Settings” softkey, the
following options are presented to the user: “Parameters”, “Calibration”, “Quit” and “Set clock”.
“Parameters” – this screen allows to adjust detector's parameters: flow rate, acquisition rate, apparent
optical path-length, and an analog output controlling the external equipment, see Chapter 7.4.1 for details.
“Calibration” – this screen allows the user to test external equipment connected to the detector, to zero
the UV channels; to change the energy emitted by UV LED light sources; and to re-calibrate the UV at
250 nm and UV at 280 nm channels. See Chapter 7.4.2 for details.
“Set clock” – on pressing this softkey, the user is presented the means to set the real-time clock.
“Save data” – this function is available only when a flash drive is inserted. The softkey allows for transfer of the
data accumulated within the non-volatile memory onto a flash drive. Pressing the “Save data” softkey
automatically creates a directory tree: UnitSerialNumber/Year/Month/Day/ on the inserted flash drive. The
directory's name reflects the date of the data transfer. The data file is saved to this directory with a name reflecting
the time of the data transfer in the 24-hour notation: XXhXXm.txt.
For example, if the detector's serial number is 1503-0-1234, and a data file is transferred to a flash drive at 10.43
a.m. on May 17, 2014 – a directory named “1503-0-1234/2014/MAY/17/” will be created on the flash drive, and a
data file named “10h43m.txt” will be recorded to this directory. If another data file were to be saved to the same
flash drive at 3.18 p.m on the same day – it will be named “15h18m.txt” and saved to the same directory.
Note that the time and date are those of the moment of the data recording, not of the moment when the data
collection had been started. This eliminates the possibility of data file overrides. Obviously, the real time clock
must be set correctly. For more details about the data file see Chapter 9.
7.3. Detailed description of Acquisition Mode
Acquisition mode starts when the “Run” softkey is pressed, leading to the following screen being opened.
Legends change to: “New” “Continue” and “Quit”. Pressing soft keys will accomplish the following:
“New” – the detector will opens the
Acquisition Screen and begin data recording.
Any previously-collected data is deleted from
the detector’s non-volatile memory (but NOT
from the flash drive). All four channels will be
rendered on the screen as four colored traces
(unless toggled off). Data acquisition will
continue until it is suspended by the user, or
until the data memory is filled to maximum
capacity (7 hours to 15 days depending on the
acquisition rate setting). In the latter case, a
message in red “Data memory is full” will
appear, and the unit will not save any more
data.
“Continue” – the detector switches to the
acquisition mode. Any previously-collected
data is recalled from non-volatile memory, all
further collected information is added to the
already-existing data set. This cannot be carried out if the non-volatile memory is full.
“Quit” – pressing this softkey returns the user to the Welcome Screen.
Acquisition Screen displays up to four traces with corresponding vertical axes in four different colors. The
legends over the four soft keys change to: “Traces” “Zoom” “Offset” and “Suspend”. The acquisition state is
conveyed at the top left corner of the screen as a “Running” or “Suspended” message in white font.
RD2: 250-280 Detector, User Manual
10
UV 250 nm trace is presented in deep blue,
the corresponding Y-axis is located on far left
of the screen. Data is presented in Absorption
units (AU) at 0.0001AU resolution.
UV 280 nm trace is presented in green, the
corresponding Y-axis is located on the left of
the screen next to 250 nm axis. Data is
presented in Absorption units (AU) at
0.0001AU resolution.
In acquisition mode, three current numerical values are displayed at the top of the screen, left to right:
• fraction Number, received from a fraction collector (Value will be 0 if no fraction collector is used)
• acquisition time (white font, XX hours XX minutes, XX seconds format)
• optical density at 250 nm (deep blue font, in AU)
• optical density at 280 nm (green font, in AU)
Pressing soft keys at the Acquisition Screen menu will accomplish the following:
“Traces” – this softkey allows for choosing of X units and toggling of the visibility of UV 280 nm trace. Each
stroke of this key will cause a new vertical cyan message to appear in the lower part of the left side of the screen.
Rotation the knob changes parameters associated with this message. There are following choices:
SEC/ML/FR.N – Sets units on the detector's X axis. Rotation of the knob will allow to choose from the
following options:
• time – actual elution time in easily understandable format. For example, “04:33” label corresponds to
4 minutes and 33 seconds. The label “2h15:22” corresponds to 2 hours 15 minutes and 22 seconds.
• ML – volume of elutant calculated from the flow rate entered by the user on the Parameters Screen
and actual elution time
• RF.N – fraction number: number of electrical pulses received on Pin7 of the detector socket.
The RF.N option is applicable only if a fraction collector that is sending an electrical signal indicating
fraction changes is attached to the detector, otherwise it will show 0.
280nm ON/OFF – rotation of the knob will toggle the UV 280 nm trace on and off.
“Zoom” – this softkey allows for the change of the X or Y scale magnification and the position of traces. The
value to be scaled is chosen by consecutive strokes of “Zoom” key and is noted in the cyan vertical message in the
lower left part of the screen. Turning the knob clockwise will expand the scale, turning knob counter-clockwise
will compact the scale. Each press of “Zoom” soft key will cycle through the following:
SETS X SCALE – rotation of knob changes the zoom of the X axis.
SETS 250nm SCALE – rotation of knob changes the zoom of the UV 250 nm axis.
SETS 280nm SCALE – rotation of knob changes the zoom of the UV 280 nm axis.
If left on its own, RD2: 250-280 will “compact” X and Y scales continuously so that ALL collected data is shown
on the screen. In a while it may seem that traces are “frozen” and not progressing any more. The same
phenomenon occurs when someone is looking at hours hand of a clock – it seems to not be moving. In this case
press “Zoom” soft key until “SETS X SCALE” appears, and turn knob clockwise until the desired X scale is
achieved. The detector now would show only the last chunk of the data collected. Turning knob counter-clockwise
would zoom out, until eventually all graphs were compacted again.
RD2: 250-280 Detector, User Manual
11
Note that if acquisition is not suspended and a newly acquired point happens to be outside of the screen area, the
detector will automatically readjust the zoom in order to bring the new point back onto the screen area. This
feature is specifically implemented to avoid a situation when the detector is running but the “Zoom” is set by user
in such a way that new data points are outside of the screen area and are not shown.
The automatic zoom readjustment is further explained by the following example. A large 250 nm absorption value
(say 10 AU) had been reached when the first fraction was eluted. This decreased the visual sensitivity of 250 nm
trace (to fit the top of the peak on the screen) to the extent that a next weak peak (0.1AU) cannot be seen on the
screen because it was rendered in too small of a height. A user now can increase sensitivity (zoom) back to the
desired value to enlarge this weak peak. The top of the previous peak will go off the screen, but because the
currently collected data still falls within screen coordinates, the detector will not interfere with this change.
It should be remembered that, during acquisition, the data from both channels is continuously written to nonvolatile memory. Manipulating “Traces” or “Zoom” functions has no effect on this process. If 280 nm trace is off,
the unit still collects 280 nm data points. These data points may be observed if 280 nm trace is turned on again.
Similarly, changing zoom does not change the unit sensitivity or affect acquisition in any way. Modifying zoom
just changes how the graphs are presented to the user.
“Suspend” – this softkey allows temporary or permanent suspension of the acquisition. One brief press of this
softkey will temporarily suspend the data collection; the second press will resume the acquisition. A prolonged
pressing of “Suspend” softkey will stop the acquisition and switch the detector to the Welcome Screen ( Chapter
7.2) from where data can be saved onto a flash drive, a new acquisition can be started or the previous acquisition
can be resumed.
7.4. Detailed description of Settings Menu
When the “Settings” softkey is pressed from
the Welcome Screen, a short help text
appears, and the softkey's legends change to
the following: ”Parameters”, “Calibration”,
“Quit” and “Set Clock”.
7.4.1. Change of detector Parameters
When the “Parameters” softkey is pressed from the “Settings” menu, the detector's parameters that can be
changed appear in the right column of the table at the bottom of the screen. The parameter being changed is
indicated with a green arrow. The softkeys' legends change to: “Select”, “Coarse/Fine”, “Cancel” and “Accept”.
“Select” – this softkey allows the user to choose the parameter to be changed. Each stroke of the “Select” key
moves the green arrow that marks the parameter to be modified. The marked parameter can be changed by
rotating the knob.
RD2: 250-280 Detector, User Manual
12
“Coarse/Fine” – this softkey allows the user
to toggle the rate with which values are
incremented/decremented by the knob. For
example, if the knob turned clockwise the
flow rate will increase as follow: 7.00, 8.00,
9.00, 10.00 ... etc. If “Coarse/Fine” softkey is
pressed once the same amount of knob
rotation will increment flow rate as follow:
7.00, 7.01, 7.02, 7.03 ... etc.
“Cancel” – pressing this softkey will ignore
all changes made in the table and bring up the
welcome screen.
“Accept” – pressing this softkey will record
new values to the non-volatile memory an
then bring up the Welcome Screen.
Detector's parameters have the following meanings:
Acquisition rate – indicates how often the detector saves the collected data into internal memory (sample rate).
The maximum achievable length of run depends on acquisition rate settings as follows:
Acquisition rate Time interval between measurements Maximum length of a run
5 Hz
0.2 seconds
1 hours 49 min
4 Hz
0.5 seconds
5 hours 27 min
1 Hz
1 seconds
9 h 5 min
0.5 Hz
2 seconds
18 h 11 min
0.2 Hz
5 seconds
45 h 28 min
0.1 Hz
10 seconds
90 h 56 min
Note, that it is not desirable to change acquisition rate in the middle of a run. Such an action will cause some X
units (such as time or volume) to be shown incorrectly.
Path-length – selects apparent optical path length of 1 mm or 10 mm by rotation of the knob, see Appendix 1
for details..
Pin1 – allows to assign which channel (UV250 or UV280) is linked to Pin 1 of the interface connector socket,
also see Chapter 7.5.1. It is useful when a fraction collector or other external system to be connected to the
detector has only one analog input. This way any of 2 channels can be attached to the same input without a cable
change.
7.4.2. Calibration
Pressing “Calibration” softkey from the “Settings” menu, brings up the Calibration Screen. Softkeys' legends
change to: “Quit”, “Set Energy”, “Zero” and “Calibration Chart”. The screen provides user with four
opportunities:
1. to test external equipment: to see whether a fraction collector, an external data recorder, or other external
devices are correctly connected to the detector's interface circuit;
2. to zero both UV channels;
3. to change the energy emitted by detector's UV LEDs (service function);
4. to access calibration charts.
RD2: 250-280 Detector, User Manual
13
7.4.2.1. Test of external equipment
While the Parameters Screen is displayed, the detector continuously generates a 1000 mV, 0.5 Hz signal on the
detector's output connector's Pin1. The external equipment must be able to pick up this signal if the connection is
implemented correctly. For example, some modern fraction collectors are able to actuate a tube change when a
peak is detected. The generated 0.5 Hz square wave presents an artificial peak to such fraction collector.
Therefore, during the test, a properly connected fraction collector should advance a tube every 2 seconds. Please
consult your fraction collector's User Manual for correct programming of your collector in this mode.
Pin 7 is used to “listen” to an output of an external
device connected to the detector. A typical
example is a signal received from a fraction
collector indicating a tube change. In general, a
fraction collector signals about a tube change by
ether actuating a mechanical switch, or producing
an electrical signal (TTL or CMOS) in the range
3-5 Volts. Usually when a tube is changed this
voltage intermittently drops to zero. In addition,
the detector has an internal pull-up resistor
allowing it to accept the actuation of a mechanical
switch on this same pin, while not hindering
recognition of TTL/CMOS signal.
When there in no connection of an external device, a message “Pin7:High” must be present on the Parameters
Screen. For most fraction collectors the message “Pin7:High” will alter to “Pin7:Low” during the tube change,
indicating the correct connection. In rare cases it might be opposite (“Pin7:Low” will alter to “Pin7:High”), which
is still acceptable. The lack of message alteration during a tube change indicates incorrect connection.
While some fraction collectors may produce very short-lasting signals, the altered message will artificially linger
on the detector's screed for about a second.
Pin 8 is ground.
RD2: 250-280 Detector, User Manual
14
7.4.2.2. Zero
Pressing “Zero” softkey will zero both UV250 and UV280 channels and change the legend over this softkey to
“UnZero”. To perform true zeroing, UV transparent media must flow through the flow cell at the flow rate
closest to the desired separation's flow rate. Zeroing function will calculate and record to detector's nonvolatile
memory offset correction coefficients, so that both UV readings became 0.0000. The stored correction
coefficients are shown at the bottom of the screen. It is possible to return to the factory defaults by setting these
coefficients back to 0 by pressing “UnZero” softkey. Never zero while a UV-opaque solution (OD > 2AU) is
running through the flow cell.
Absorption readings in excess of 2 AU while a UV transparent solution is running through a flow cell are
indications of an internal problem with the detector. Please do not hesitate to contact the REACH devices service
in such cases. Absorption readings less than -1 warrant the use of the “Set Energy” function (see below).
7.4.2.3. Set Energy
“Set Energy” is a service function and
normally should not be used. Before doing
any manipulations with “Set Energy” function
you must run UV transparent media
through the flow cell for at least 30 seconds,
and continue to run it during the whole
procedure, otherwise, severe damage to the
UV sources may result. This function will
change the energy emitted by a chosen UV
LED (250 nm or 280 nm). The function
allows for corrections in cases when for some
reason the OD reading of UV250 or UV280
channels became less than -1.
Before “Set Energy” procedure is started, the
“UnZero” key must be pressed (Chapter
7.4.2.2) so that the zero correction
coefficients are set to 0.
To allow faster feedback during “Set Energy” procedure, the acquisition rate should be set to 1 Hz or more (see
Chapter 7.4.1 for acquisition rate settings).
Pressing the “Set Energy” softkey from the Calibration Screen opens the Set Energy Screen, and softkeys'
legends change to: “250nm”, “280nm”, “Accept” and “Cancel”. Current absorption readings of UV at 250 nm
and 280 nm appear at the top of the screen in blue and green font respectively.
Pressing “250nm” softkey and then slowly turning the knob while softkey is still pressed will bring a message:
“Emitted energy (100-4000 Range): NNN,” where NNN is an integer number directly proportional to the emitted
250 nm UV energy. The NNN number will change fast upon the knob rotation, while the corresponding
absorption reading at the top of the screen will change more slowly or with a delay. Decreasing of NNN number
will decrease the energy emitted by 250 nm UV LED, therefore increasing UV250 absorption reading. Ideally, by
rotating the knob back and forth, it should be possible to achieve UV250 reading within 0.001 AU from zero.
The same procedure repeated using the “280nm” softkey will allow adjustment of 280 nm channel.
After the desired results are obtained, press the “Accept” softkey. Pressing “Cancel” softkey will revert the
detector to the previous energy settings.
“Set Energy” adjustments of 280 nm UV LED will change RI calibration (see next Chapter).
RD2: 250-280 Detector, User Manual
15
7.4.2.4. Calibration Charts
Pressing “Calibration Charts” softkey from the Calibration Screen brings up the Charts Screen. Softkeys'
legends change to: “250nm” and “280nm”. From this screen it is possible to select a calibration chart to be
created or updated. For example, pressing “250nm” softkey from the Charts Screen will open the UV 250nm
Chart Screen. Both UV calibration charts have identical user interface.
Bear Law (see Appendix 1 for more details) manifests linear relationship between the concentration of a UV
absorbing compound and the absorption of the solution of this compound in a UV-transparent solvent. However, it
is usually not applicable to concentrated (over 100 mM) solutions of UV absorbing species. Therefore, absorption
values observed by RD2 detector follow the following rules:
• for up to 0.1 M concentration of any UV absorbing compound in a UV-transparent solvent, the exact
concentration of this compound can be calculated from the observed absorption value and the extinction
coefficient of this compound.
• for over 0.1 M concentration of UV-absorbing species, increase in concentrations will correspond to
increase in absorption, but linearity will not necessarily be preserved.
The hard-coded internal calibration table ensures that the detector has linear response for up to 10 M acetone.
If a linear response for high concentrations of another UV absorbing compound is needed, the detector may be recalibrated using high-concentration standards of this compound as described below. Note, that outside of the usercreated calibration table, the hard-coded internal calibration values will take precedence. The hard-coded table is
never deleted, but simply bypassed. If the user wants to return to the factory calibration, he simply needs to delete
his/her calibration values.
The UV “280nm” Chart Screen is shown on
the left. “Measured values” correspond to the
absorption values from the hard-coded
table. “Desired values” are the absorption
values that can be set by user.
It is important to understand that “desired
values” do not necessarily mean “correct”
values.
For example, imagine that your separation
procedure calls for collection of four fraction
of a UV absorbing product X: 10 to 50%, 50
to 70%; 70 to 50% and 50 to 35%.
For your convenience you may calibrate the
detector using four solutions of X, and assign
10% of X a “desired” absorption of 1 AU,
50% of X a “desired” absorption of 5 AU,
70% of X a “desired” absorption of 7 AU,
and 35% of X a “desired” absorption of 3.5 AU.
Calibration procedure: UV at 280 nm
1. Before any manipulations on the Chart Screen, at least two (maximum five) of degassed calibrating
solutions of known UV absorptions must be purchased or prepared. The internal detector's calculations
are done in a linear fashion, therefore at least two points need to be set to establish a meaningful outcome.
However, if so desired, up to five calibration points can be set.
2. Press the “280nm” softkey from Charts Screen. This opens the UV 280nm Chart Screen, softkeys'
legends change to: “Enter”, “Cancel” and “Accept”.
RD2: 250-280 Detector, User Manual
16
3. Select a calibration point by rotating the knob, which will move the yellow arrow up or down the
calibration table. After the point is chosen, press “Enter” softkey. The softkey's legends will change to
“Faster”, “Set”, “Cancel” and “Delete”. Now, the chosen calibration point can be “set” (edited) or
“deleted” (cleared).
4. Enter the “Desired value” of the calibration point – the known absorption value of the first calibration
solution. This is accomplished by knob rotation. Faster knob rotation will cause exponentially faster value
change. If it still too slow to arrive to the desired value, then “Faster” softkey may be pressed
simultaneously while knob is rotated.
5. Run the calibration solution exhibiting the “Desired value” of absorption through the flow cell for at least
1 minute, at a flow rate of 20 ml/min or more, afterward press the “ Set” softkey. At this moment, a new
“Measured value”, corresponding to the previously entered “Desired value” will be recorded in the
detector's memory, and will appear in the calibration table. The legends over the softkeys will change
back to “Enter”, “Cancel” and “Accept”, thus allowing you to chose the next calibration point.
6. Repeat the procedure for up to five different calibration solutions to establish up to five calibration
points. The “set” calibration points do not need to be consecutive.
7. You must clear the unused calibration points. To do so, selecting each unused point with the yellow
arrow, press “Enter”, then press “Delete”. The “Not set” message must appear next to these points.
8. To use the newly created calibration chart you must to press “Accept” softkey at the end of the procedure
and follow the screen prompts.
7.5. Fraction collectors and other external equipment
7.5.1. General information
The detector has an HR-25A 8-pin female socket (Hirose Electric Co Ltd, mating connector part number is
HR25A-7P-8P), which provides the possibility to communicate with external hardware.
Pins 1 supplies an analog output (0 to 1V range, 10mA max) that is always active while the Acquisition Screen
(Chapter 7.3) is displayed. By default, during data collection, the relations between output voltage (in V) and the
measured values are as follows:
Pin1 Vout=(AU+1)/100, clips AU>99 to 1V
Note that Pin1 may be reconfigured in Parameters Screen (Chapter 7.4.1) to output 250 nm or 280 nm channel.
The outputs are also active when “Suspended” message is shown on the left top corner of the Acquisition Screen
and no data logging is occurring.
Pin 7 provides an input that has a 5K pull-up
resistor to +5V. Open collector, open drain,
TTL/CMOS (active low) or mechanical switch
are all acceptable sources to be attached to Pin7.
During data acquisition, a transition from logical
1 to 0 level (or contacts closure) is recorded to
data memory as an external fraction number. This
is implemented for faction collectors that produce
an electrical pulse when they change the fraction.
Note that only one transition per acquisition rate
would be recorded. So, if the detector acquisition
rate is set to 1 second (default), then fraction
collector should not output more than 1 pulse per
second.
Pin 8 is the detector ground.
RD2: 250-280 Detector, User Manual
17
7.5.2. Attaching fraction collectors
RD2: 250-280 can interface with virtually any model of a fraction collector. In general, depending on the fraction
collector's brand, two types of interface are possible.
1. Event Marker / Tube change: output on the faction collector, input on the detector. The detector 'listens'
to fraction change signal from the fraction collector, displays the actual number of the fraction on X axis,
and stores the fraction count in the output file. In this scenario, typically, the fraction collector fraction
change event output should be connected to Pin7 of the detector with a shielded cable.
2. Analog output: input on the faction collector, output on the detector. The detector supplies the fraction
collector with an analog signal proportional to UV250 or UV280 channel output, as chosen by the user.
The collector is programmed by the user to perform the tube change depending on the value of the data
signal. In this scenario, typically, Pin1 of the detector should be attached to the analog input of the
fraction collector. It is very important to use a shielded cable.
Customers are encouraged to experiment with the actual connection pattern.
During the purchase, a customer may inform REACH Devices about the brand of the fraction collector he/she
intends to be using with RD2: 250-280. In this case, a connection cord with a connector fitting the particular
fraction collector will be provided. If needed in the future, this cord can be cut and outfitted with a different
connector to fit another fraction collector’s brand. The wires are color coded as follow:
1
Red
(Pin1 of the detector)
detector's analog output (Pin1), 0 to +1V range, may be assigned to any
channel from the detector menu. Maximum load: +/- 20mA
2
White
(Pin7 of the detector)
detector's digital input (Pin7). Pulled up to +5V via 5K resistor. Compatible
with TTL, CMOS and mechanical switch. Active low.
3
Black and / or bare wire Ground (Pin8)
After a fraction collector is attached, the connection can be easily tested from Calibration Screen as described in
Chapter 7.4.2.1.
8. Setting up the valves
8.1. Overall description
Pressing “Valves” softkey from the Welcome Screen will open the Valves Menu.
The Valves Menu allows the user to set up a
program controlling which valve is open on a
given separation moment. Up to 16 valves can
be requested during the detector's ordering.
The program consists of a sequence of up to
fifty Events. Each Event is assigned by the user
to a single valve being open. Therefore, each
Event corresponds to a single valve, but several
Events can be assigned to the same valve.
On the beginning of a new separation, the
program will start from the Event 1. The Event
1 will expire once certain user-set conditions
are met. On the expiration of the Event 1, the
Event 2 will became active, and so on until an
Empty Event (an Event with no conditions) or
the Event 50 is reached. At this moment the
program will stall indefinitely.
RD2: 250-280 Detector, User Manual
18
The user-set conditions may be of three types.
1. Time Conditions – user specifies the time for each valve to be opened.
2. Effluent Properties Conditions – user specifies an absorption, or conductivity, or RI value to be reached
for the Event to expire.
3. Double-type Conditions – user specifies an Effluent Properties Condition, but a certain user-specified
time must elapse before this conditions is checked by the detector's software.
Below are examples of valve programming.
Example One. Simple time-based collection (conditions type 1 only):
1. The effluent is routed to a waste vessel through the Valve 1 for the first 1 hour 05 minutes after the
beginning of the separation
2. For the next 14 minutes 30 seconds, the first useful fraction is collected in a Vessel A through the
Valve 2.
3. Afterward, the solution is again routed to the waste vessel through the Valve 1 for 18 minutes.
4. For the following 7 minutes, the second useful fraction is collected in a Vessel B through the Valve 3.
5. Afterward, the solution is again routed to the waste vessel through the Valve 1 indefinitely.
Event
Min Duration
Max Duration
Next After
Valve
Relay
1
-
1h05:00s
-
V1
1- 2-
2
-
14:30s
-
V2
1- 2-
3
-
18:00s
-
V1
1- 2-
4
-
07:00s
-
V3
1- 2-
5
-
-
-
V1
1- 2-
Example Two. Effluent properties and time-based collection (conditions type 1 and type 2 only):
1. The effluent is routed to a waste vessel through the Valve 1 until absorption at 280 nm rises to 3.9 AU.
2. The first useful fraction is collected in a Vessel A through the Valve 2 until absorption at 280 nm drops
below 0.54 AU.
3. Afterward, an intermediate fraction is collected to a Vessel B through the Valve 3 for 8 minutes 40
seconds.
4. Afterward, the solution is again routed to the waste vessel through Valve 1 indefinitely.
Event
Min Duration
Max Duration
Next After
Valve
Relay
1
-
-
UV280 < 3.900
V1
1- 2-
2
-
-
UV280 > 0.5400
V2
1- 2-
3
-
08:40s
-
V3
1- 2-
4
-
-
-
V1
1- 2-
RD2: 250-280 Detector, User Manual
19
Example Three. Double-type Conditions (conditions type 3 only):
1. Initially, the effluent is routed to a waste vessel through the Valve 1. The first fraction to be collected
begins after absorption at 250 nm reaches 5 AU. However, the user knows from previous experience that
this can not happen sooner than about 10 minutes after the beginning of the separation.
2. The user wants to keep collecting the product into a Vessel A through the Valve 2 until the absorption at
280 nm drops below 1.4 AU. However, the collection can not last for more than 35 minutes, because after
30 minutes the Vessel A will overflow.
3. Afterward, the solution is again routed to the waste vessel through Valve 1 indefinitely.
Event
Min Duration
Max Duration
Next After
Valve
Relay
1
10:00s
-
UV250 < 5.000
V1
1- 2-
2
-
35:00s
UV280 > 1.400
V2
1- 2-
3
V1
1- 2In this case, setting of Double-type Conditions prevents the situation when a spurious air bubble, or a solid
particle, or a line power glitch would cause a short (a second or two) spike of absorption over 5 AU, and the
program advances to the next event collecting the waste solution into Vessel A.
8.2. Editing the Valve Table
Once in the Valve Menu, select an Event by rotating the knob, which will move the yellow arrow up or down the
Event Table. Moving the pointer before the bottom of the screen will scroll up revealing more Events.
When the arrow points to the white-font Event row, the softkeys have the following meanings:
“Insert Line” – pressing this softkey will
insert a new blank Event line at the pointer,
while the very last (fiftieth) line will be
deleted, line numbering will be kept
consecutive.
“Delete Line” – pressing this softkey will
remove the line at the pointer, a blank fiftieth
line will be added at the very end on the table.
“Save and exit” – pressing this softkey will
save the Event Table to the detector's
permanent memory and exit to the Welcome
Screen.
“Enter” – pressing this softkey will change
the softkey's legends to “→”, “←”, “Faster”
and “Done”. The pointer will jump in to the
next column (Min Duration) of the table. Now,
Min Duration can be edited by rotating the knob. Faster rotation will cause faster value change. If you hold the
“Faster” softkey while rotating the knob, the value will be changing even more rapidly. Pressing “→” or
“←”allows the user to move horizontally along the Event line. Once the line is edited, pressing “Done” will
return the user to the Valves Menu, where the next Event may be chosen for editing.
When the arrow points to the yellow font special row, only “Enter” softkey may be pressed.
While the Event Table is edited by the user before the beginning of the separation, the special yellow row will
read “E Current event is: 1 Duration 00:00s“. Pressing the “Enter” softkey at this time is meaningless.
Only after the actual separation is started, and the automatic events count is underway, the special line may be
used.
RD2: 250-280 Detector, User Manual
20
While the separation is running, a magenta line “Valve:X Event:Y Duration mm:ss” is always shown on the
Acquisition Screen, informing the user about the Event Table progress. The user can skip an Event(s) or return to
a previous Event(s) to be repeated. To do so, the user needs to execute the following:
• suspend the acquisition
• go to Valves Menu, navigate to the special yellow line and press the “Enter” softkey
• change the current event number by rotating the knob. The Duration will be automatically set to 00:00.
Optionally, the user may now edit the Event Table.
• press “Done” to return to the Valves Menu
• press “Save and exit” to save the edited Event Table and to exit to the Welcome Screen
• press “Run”, then press “Continue” to continue the acquisition.
8.3. Optional relays
On user request, optional relays 250 VAC, 4 A can be installed. If the relays are installed, an operator “GO TO
EVENT #N will be available to allow for process control loops. The relays are controlled by the last column in
the Valve Menu. Notations are as follows:
Both relays are OFF: 1- 2-
Relay 1 is ON, Relay 2 is OFF: 1+ 2-
9. Import of data
The collected data can be recorded onto a flash drive as a text data file consisting of multiple strings of six spaceseparated numbers. A carriage return sequence (0DH, 0AH Microsoft style) concludes each string of data.
1. The first number depends on X axis units that are currently selected (Chapter 7.3). If X units are set to
time then the first number represents amount of seconds passed since the acquisition started. If X units
are set to mL then the first number is the volume of elutant calculated from Flow rate
(Settings/Parameters menu) and actual elution time. Finally, If X units are set to N then the first number
is meaningless.
2. The second number is the optical density at 250 nm in Absorption Units (AU), -2.0000 to 120.0 range.
3. The third number is the optical density at 280 nm in Absorption Units (AU), -2.0000 to 120.0 range,
4. The forth number is the Refractive Index at 280 nm, unitless, 1.0000 to 3.0000 range.
5. The fifth number is the Conductivity in S/m, 0.0000 to 50.00 range.
6. The last number is the external fraction number, an integer in 0 to 65535 range. This value is only
meaningful if a fraction collector was attached during the run.
7. The last number is the valve being open during this time.
9.1. Import to Excel
1.
2.
3.
4.
5.
In Excel, go to File → Open in the top menu (alternatively, press Ctrl+O).
Select Text files (*.prn *.txt *.csv) file type from the file type sub-menu.
In the file list, select the file you wish to process, and click “Open”.
On next screen chose “Delimited – Characters such as comma or tabs separates each field”.
On the next screen, make sure “Space” as delimiter character is selected (box is checked), and click
“Finish”. Now the file is imported to Excel and should look like this:
6. Select a column (column A is time in seconds, column B is absorption at 250 nm, C is absorption at 280
nm, D conductivity E is RI and F is open valve number) by clicking the column’s letter at the top of the
column.
7. Click: Insert → Chart → Line and click through subsequent screens (if any) to get the graph printed. In
the later versions of excel, click “Insert” and select the chart type (we recommend Plain line charts). The
default result looks like this (column B was selected):
Of course, the user should adjust axes, legends, color, etc. as usual.
RD2: 250-280 Detector, User Manual
21
9.2. Import to MathCAD
In MathCAD, start a new file first. Then go to
Insert → Component → File read or write → Read from a data source
Choose File format as Text files and then locate and click on the desired data file.
A placeholder, similar to the one shown below, will appear in MathCAD window:
The user needs to type a matrix name (say letter M) instead of the red rectangle.
Below the matrix name, a component range expression should be placed by typing: i:0;rows(M)-1
Below the range expression, a 2D graph should be started by typing Shift+@ combination.
The content that should appear in MathCAD window is shown in the left image on the next page.
The graph can be recalled by typing i instead of lower black rectangle and M[i,1 (for 250nm graph; M[i,2 for
280nm graph, M[i,3 for conductivity graph, M[i,4 for the RI graph and M[i,5 for valve graph) instead of left
black rectangle.
RD2: 250-280 Detector, User Manual
22
If automatic calculation is not enabled then F9 key (or Math → Calculate worksheet menu) should be pressed,
which will populate the graph area as is shown on the right image above. Again, the user can adjust axes, legends,
color, etc. as usual.
10. Firmware download
If necessary, the firmware of RD4: 250-280-RI-Cond may be updated by the user in the field. To obtain a new
firmware file RD4-FRMW.BIN, please contact REACH support by E-Mail. The file can then be downloaded to
the detector from a flash drive. The following rules must be observed:
• the flash drive is FAT32 formatted, is not in 'write protect' mode and has at least 300Kb of free space
• a file RD4-FRMW.BIN is present in the root directory
• a file RD4-FRMW.OLD is not present in the root directory
To prevent any incompatibility issues, old
firmware will be automatically uploaded to
the flash drive, so the user can revert back if
needed.
Firmware upload procedure:
6.
1. Turn on the detector, the Welcome Screen
will be displayed.
2. Unplug the detector from a power outlet
while the Welcome Screen is shown.
3. Press and hold the two middle softkeys
until step 5.
4. Plug the detector back to the power outlet.
The blue screen of bootloader program
will appear:
5. You may now release the middle two
softkeys. Insert a flash drive with the new
firmware.
Press the leftmost key to proceed with the download or rightmost key to exit the bootloader.
After the new firmware is downloaded, the file RD4-FRMW.OLD will be created in the root directory. This is the
old firmware. This file should be saved in a safe place, not in the root directory of the flash drive. To use this file
(and thus revert to the old firmware), it should be manually renamed as RD4-FRMW.BIN. Now, the firmware
download procedure can be repeated using the renamed file placed in the root directory of a flash drive.
RD2: 250-280 Detector, User Manual
23
11. Appendix 1: Optical path-length
In any UV detector, a beam of light passes through a certain width of liquid to be analyzed. The detector measures
absorbance A (expressed in Absorption Units, AU) of the sample, that is determined as follows:
A = - log(intensity of light emerging from the sample cell / Intensity of light directed onto the sample cell)
where log(x) is the base-ten logarithm of x.
for A = 1.00: 90% of the photons are absorbed, 10% reach the detector;
for A = 2.00: 99% of the photons are absorbed, 1% reach the detector;
for A = 5.00: 99.999% of the photons are absorbed, 0.001% reach the detector.
Contemporary UV detectors employ very low intensity of the irradiating UV light. Higher intensities are
detrimental for the analyzed samples, and they would make the detectors dramatically larger, more expensive and
require an extended maintenance. Reliable measurements of less then 0.001% of this low-intensity light is, at the
moment, not viable for commercial instruments. Therefore, NO available detector can directly measure
absorption exceeding 5 AU.
HOW IS THE ABSORPTION UP TO 100 AU RECORDED BY RD4: 250-280-RI-Cond?
According to the Beer-Lambert law:
A = E * b * C, where:
• A is the measured absorbance of a sample, expressed in Absorption Units, AU;
• E is molar absorption coefficient (at a particular wavelength λ) of the compound that is analyzed,
expressed in l/(mol * cm);
• b is optical path length – the width of the analyzed liquid layer , which is equal to the distance between
the inner faces of the sample cell, expressed in cm;
• C is the concentration of the compound in solution, expressed in mol/l.
With the exception of our detectors, all other available instruments have flow cells with a fixed b.
The illustrating table presents absorbances A of methyl benzoate and benzyl alcohol calculated for various optical
path-lengths b, at typical for silica-based preparative chromatography purification concentrations C = 0.15 M.
Visualization of a strongly absorbing product (methyl benzoate) requires b = 0.01 mm optical cells. However,
such a small optical path-length will "miss" weakly absorbing admixtures (benzyl alcohol).
Optical path b, mm
Absorbance, Absorption Units
Methyl benzoate, 0.15M
E = 14400 l/(mol cm) at λ= 242nm
Benzyl alcohol, 0.015M
E=12 l/(mol cm) at λ= 250 nm
10
2200 AU
0.18 AU
5
1100 AU
0.09 AU
2
440 AU
0.036 AU
1
220 AU
0.018 AU
0.1
22 AU
0.0018 AU
0.01
2.2 AU
0.00018 AU
A unique feature of RD4 is that UV absorption data is simultaneously collected for optical path-lengths from
0.001 to 10 mm. For user's convenience, the data is presented as if the acquisitions occurred using a 10 mm or 1
mm optical path-length with up to 100 AU range. The apparent 10 mm or 1 mm optical path-length can be
changed by user at any time by simply pressing the detector's softkey. The chromatogram collected by the RD4
detector does not plateau when the concentration of UV-absorbing compounds is high, allowing the user to
reliably visualize both strongly and weakly absorbing analytes at essentially any concentration.
RD2: 250-280 Detector, User Manual
24
12. Appendix 2: Legal disclaimer
Installation and Use: Customer shall install and use the Products in accordance with instructions provided by
REACH. REACH will not be responsible for any damage arising out of direct exposure to fire, flooding or severe
mechanical impact, improper or unauthorized installation, opening or altering of the unit in which the Products
are encased, negligence, neglect, abuse, misuse, or improper maintenance by Customer and any such acts will
invalidate the warranty. Further, if the flow cell is destroyed by hydrofluoric acid, concentrated hydrogen
peroxide, strong hot aqueous alkaline solutions or fuming nitric acid; or damaged by excessive pressure and/or if
the flow cell is permanently clogged with solid material, those acts will invalidate the warranty. A fee will be
charged for the flow cell replacement where it is destroyed, damaged or clogged.
Prohibited Uses: Customer shall not and shall not permit others to use the products for separations of mixtures
containing hydrofluoric acid, concentrated hydrogen peroxide, strong hot aqueous alkaline solutions or fuming
nitric acid. The detector cannot be used under pressures exceeding 15 psi. The detector cannot be used for
separation of solutions containing suspended solid particles. Standard safety practices, pertinent to the workplace,
must be maintained at all times.
Limited Warranty: REACH warrants all of its products to be free from defects in material and workmanship
under normal use and service for a period of three years from the date of shipment. REACH’s sole obligation
under this warranty shall be limited either to replace or repair defective products or to refund the purchase price,
at REACH’s option, after inspection at REACH’s facility verifies the claim. THERE ARE NO OTHER
WARRANTIES WHICH EXTEND BEYOND THE DESCRIPTION OF THIS LIMITED WARRANTY, AND
TO THE FULL EXTENT PERMITTED BY LAW, ANY AND ALL IMPLIED WARRANTIES, INCLUDING
IMPLIED WARRANTIES OF MERCHANTABILITY OR FITNESS FOR A PARTICULAR
PURPOSE OR ARISING FROM ANY COURSE OF DEALING OR USAGE OR TRADE, ARE HEREBY
EXPRESSLY DISCLAIMED AND EXCLUDED, AS WELL AS ALL OTHER OBLIGATIONS OR
LIABILITIES OF REACH.
Reverse Engineering: As a condition of sale, Customer agrees not to copy, reverse engineer, produce or
manufacture, or to cause or enable others to copy, reverse engineer, produce or manufacture any item containing
intellectual property rights or confidential information of REACH.
Force Majeure: REACH is not liable for loss, damage, detention, or delay due to causes beyond its reasonable
control such as acts of God, acts of Customer, acts of civil or military authority, priorities, fires, strikes, floods,
epidemics, quarantine restrictions, war, riot, delays in transportation, government restrictions or embargoes, or
difficulties in obtaining necessary labor, materials, and manufacturing facilities due to such causes.
Limitation of Liability: CUSTOMER AGREES THAT REACH SHALL NOT BE LIABLE FOR ANY
SPECIAL, INCIDENTAL, EXEMPLARY, INDIRECT OR CONSEQUENTIAL DAMAGES INLUDING BUT
NOT LIMITED TO LOSS OF REVENUES OR PROFIT, PROPERTY DAMAGE OR LOSS OF GOODWILL,
EVEN IF REACH SHALL HAVE BEEN ADVISED OF THE POSSIBILITY OF SUCH POTENTIAL LOSS OR
DAMAGE, ARISING OUT OF OR RESULTING FROM THE SALE, INSTALLATION OR USE OF ANY
REACH PRODUCT OR SERVICE OR FOR ANY OTHER REASON. REACH’S TOTAL CUMULATIVE
LIABILITY IN CONNECTION WITH ANY OCCURRENCE OR SERIES OF OCCURRENCES, WHETHER
IN CONTRACT OR TORT OR OTHERWISE, WILL NOT EXCEED THE CONTRACTUAL VALUE OF THE
GOODS OR SERVICES SOLD SIX MONTHS PRIOR TO THE OCCURRENCE. REACH WILL NOT BE
LIABLE FOR ANY DAMAGES ARISING OUT OF THE IMPROPER RETURN OF PRODUCTS THAT
CONTAIN HAZARDOUS MATERIALS ON OR WITHIN THE PRODUCTS