1
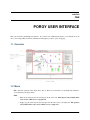
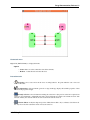
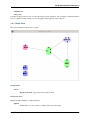
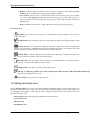
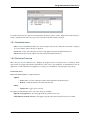
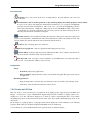
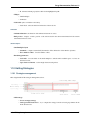
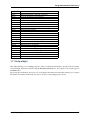
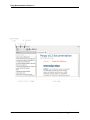
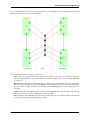
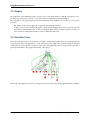
Porgy Documentation
Release 1.2
Bruno Pinaud Jonathan Dubois
July 10, 2012
CONTENTS
1
2
3
Porgy User Interface
1.1 Overview . . . . . . . . . . . . . . .
1.2 Menu . . . . . . . . . . . . . . . . .
1.3 Toolbars . . . . . . . . . . . . . . .
1.4 Configuring current view . . . . . . .
1.5 Configuring Current Interaction Tool
1.6 Configuring Element Properties . . .
1.7 Editing Rules . . . . . . . . . . . . .
1.8 Editing Graphs . . . . . . . . . . . .
1.9 Editing derivation trees . . . . . . . .
1.10 Editing Strategies . . . . . . . . . . .
1.11 Help widget . . . . . . . . . . . . .
.
.
.
.
.
.
.
.
.
.
.
.
.
.
.
.
.
.
.
.
.
.
.
.
.
.
.
.
.
.
.
.
.
.
.
.
.
.
.
.
.
.
.
.
.
.
.
.
.
.
.
.
.
.
.
.
.
.
.
.
.
.
.
.
.
.
.
.
.
.
.
.
.
.
.
.
.
.
.
.
.
.
.
.
.
.
.
.
.
.
.
.
.
.
.
.
.
.
.
.
.
.
.
.
.
.
.
.
.
.
.
.
.
.
.
.
.
.
.
.
.
.
.
.
.
.
.
.
.
.
.
.
.
.
.
.
.
.
.
.
.
.
.
.
.
.
.
.
.
.
.
.
.
.
.
.
.
.
.
.
.
.
.
.
.
.
.
.
.
.
.
.
.
.
.
.
.
.
.
.
.
.
.
.
.
.
.
.
.
.
.
.
.
.
.
.
.
.
.
.
.
.
.
.
.
.
.
.
.
.
.
.
.
.
.
.
.
.
.
.
.
.
.
.
.
.
.
.
.
.
.
.
.
.
.
.
.
.
.
.
.
.
.
.
.
.
.
.
.
.
.
.
.
.
.
.
.
.
.
.
.
.
.
.
.
.
.
.
.
.
.
.
.
.
.
.
.
.
.
.
.
.
.
.
.
.
.
.
.
.
.
.
.
.
.
.
.
.
.
.
.
.
.
.
.
.
.
.
.
.
.
.
.
.
.
.
.
.
.
.
.
.
.
.
.
.
.
.
.
.
.
.
.
.
.
.
.
.
.
.
.
.
.
.
.
.
.
.
.
.
.
.
.
.
.
.
.
.
.
.
.
.
.
.
.
.
.
.
.
.
.
.
.
.
3
3
3
4
4
5
5
5
8
10
15
17
Porgy data structure
2.1 Portgraphs . . .
2.2 Rules . . . . . .
2.3 Graphs . . . . .
2.4 Derivation trees .
.
.
.
.
.
.
.
.
.
.
.
.
.
.
.
.
.
.
.
.
.
.
.
.
.
.
.
.
.
.
.
.
.
.
.
.
.
.
.
.
.
.
.
.
.
.
.
.
.
.
.
.
.
.
.
.
.
.
.
.
.
.
.
.
.
.
.
.
.
.
.
.
.
.
.
.
.
.
.
.
.
.
.
.
.
.
.
.
.
.
.
.
.
.
.
.
.
.
.
.
.
.
.
.
.
.
.
.
.
.
.
.
.
.
.
.
.
.
.
.
.
.
.
.
.
.
.
.
.
.
.
.
.
.
.
.
19
19
19
22
22
Building the derivation tree
3.1 Applying rules . . . . . . . . . . . . . . . . . . . . . . . . . . . . . . . . . . . . . . . . . . . . . .
3.2 Strategies . . . . . . . . . . . . . . . . . . . . . . . . . . . . . . . . . . . . . . . . . . . . . . . . .
23
23
23
.
.
.
.
.
.
.
.
.
.
.
.
.
.
.
.
.
.
.
.
.
.
.
.
.
.
.
.
.
.
.
.
.
.
.
.
.
.
.
.
.
.
.
.
i
ii
Porgy Documentation, Release 1.2
PORGY is an interactive visual environment for modelling complex systems through graphs and graph rewriting
rules. Graph rewriting systems appear as a powerful formalism to capture and study phenomena occurring in complex
systems, such as the evolution of bio-molecular networks, adhoc communication networks or interaction nets.
Contents:
CONTENTS
1
Porgy Documentation, Release 1.2
2
CONTENTS
CHAPTER
ONE
PORGY USER INTERFACE
This section describes the Porgy user interface. If you need some additional information on an element move the
cursor on it and press F1 on windows and Linux and the help key on mac to get it’s help page.
1.1 Overview
1.2 Menu
• File: usual file operations (New, Open, Save, Save as, Print, Close Tab, Exit). See the Tulip user manual for
more information about this menu.
• Edit:
– Cut: cut the selected portnodes and edges from the active view. This option is only available if the
active view is a Rule view or a graph view.
– Copy: copy the selected portnodes and edges from the active view to the clipboard. This option is
only available if the active view is a Rule view or a graph view.
3
Porgy Documentation, Release 1.2
– Paste: paste the portnodes and the edges from the clipboard to the active rule view. This option is
only available if the active view is a Rule view or a graph view.
– Select all: clear the selection then add the portnodes and the edges present in the active view.
– Deselect all: clear the selection.
– Invert selection: invert the selection. Selected elements become unselected and unselected become
selected.
– Delete selection: delete portnodes and edges selected in the active view. This option is only available
if the active view is a Rule view or a graph view.
• Algorithm: allows the user to compute and apply algorithm.
– Measure: compute and assign a value to the ‘viewMetric’ property of graph elements. For example,
when running the ‘Portnode’s degree’ algorithm, the degree (the number of neighbors) is computed
and stored, for each portnode, into its ‘viewMetric’ property.
– Selection: selects nodes and/or edges based on advanced criteria. (Selecting means assigning the
‘viewSelection’ property).
– General: contains all the base porgy algorithms. This menu is made for an advance use of Porgy.
• Docks: allows to show and hide dock widgets in the Porgy user interface.
• Windows: manages the sub-windows of the view window.
• Help: Tulip documentation, Preferences, Plug-ins manager, About this software, including version number.
1.3 Toolbars
1.3.1 Generic options toolbar
The toolbar contains 3 icons:
•
Open file: Open a new graph.
•
Save file: Save the current graph.
•
Snapshot : Take a snapshot of the current view.
1.3.2 Current view interaction tools toolbar
The toolbar contains all the interaction tools available for the activated view. For more information about each tool see
the documentation of the views.
1.4 Configuring current view
Click the “View” tab at the top left corner to access this sub-window. Here one can configure the views. Thus, when
the type of active view changes, this window also changes. Each view has it’s own configuration widget see, the
documentation of the views if you want more information about a specific configuration widget.
4
Chapter 1. Porgy User Interface
Porgy Documentation, Release 1.2
1.5 Configuring Current Interaction Tool
Click the “Interactor” tab at the top left corner to access this sub-window. Here one can configure and the active
interaction tool. Thus, when the current interaction tool changes, this window also changes. Each interaction tool
has it’s own configuration widget, see the documentation of the views if you want more information about a specific
configuration widget.
1.6 Configuring Element Properties
Click this button
in the toolbar , then click an element (node or edge). The element tab opens:
Like before, double-click a cell (in the value column) to update it.
1.7 Editing Rules
Click on Rules tab to access to the Rules management widget. Here one can create, visualize and destruct rules. Use
the text line at the top of the widget to filter rules using rule names.
There is four preview mode :
• List: Do not display rules previews
• Small icons
• Medium icons
• Large icons
To display a larger preview of the rule hoover it.
1.5. Configuring Current Interaction Tool
5
Porgy Documentation, Release 1.2
1.7.1 Contextual menu
• Show : A rule must be selected to enable this action. Displays a visualization/edition view for the selected rule.
One can also double click on the rule or drag and drop the view on the workspace to display it.
• Create new : Create a new empty rule.
• Clone : A rule must be selected to enable this action. Clone the selected rule, i.e create a copy of the rule with
the same port nodes and the same values.
• Delete : A rule must be selected to enable this action. Delete the rule. If the rule is used in an existing graph it
cannot be deleted.
1.7.2 Applying a rule
The application of a rule is made by a drag and drop of a rule to:
• a graph metanode in the derivation tree view. If the operation is valid a green square will appear.
• a graph view.
Once you drop the rule a parameter configuration widget will appear to configure the rule application.
You can customize these parameters:
• Rule Name
• Maximum number of instances to apply: the maximum number of matching to compute.
• Use position?: enable the Position parameter to restrict the search of the instances. See the Position parameter
for more information.
• Position: the boolean property that define a subgraph of the graph. This subgraph is used to restrict the search
of the instances of the left-hand side rl of the rule to apply in the target graph m. When one tries to find the
instances I of rl in m, at least one node of each I must be in P. It is possible to define more than one P.
• Layout algorithm: set the layout algorithm to apply after the rule application.
Here is the description of the dialog interface:
• Restore System Default: get the default parameters. Replace current parameters.
• Set as Defaults: save the current parameters as default.
• Cancel: cancel the rule application.
• OK: launch the rule application process.
If the process works, the resulting graph will appear in the derivation tree, else a red square will appear.
1.7.3 Rule View
This is the visualization/edition view for rules.
Configuration
• Labels
– Display node labels: toggle the portnodes and ports label.
6
Chapter 1. Porgy User Interface
Porgy Documentation, Release 1.2
Contextual menu
Right-click (Ctrl-click Mac) to display this menu:
• Options
– Center view : move the camera the view all the elements.
– Redraw : redraw the rule and center the view.
Interaction tools
•
Navigation: move, rotate and zoom the view. Zooming behavior: the point under the cursor is moved
closer to the center.
•
Get information: click an element (portnode or edge) and Porgy displays all available properties of that
element in the properties widget.
•
Rectangle selection: select all elements touching the selection box (the previous selection is replaced, but
can be recovered with Undo). With Shift, the newly selected elements are added to the current selection; with
Ctrl (Alt on Mac), the selected elements are removed from the current selection.
•
Selection edition: modify the shape and position. Shift-click modifies only coordinates. Ctrl-click modifies only size. Left-click outside the selection resets the selection.
1.7. Editing Rules
7
Porgy Documentation, Release 1.2
•
•
Edit edge bends: click on an edge to select it (with this tool), then Shift-click to add a new bend, click a
bend to move it, or Ctrl-click (Alt on Mac) to remove a bend.
Add portnodes: allow the user to create,edit and add portnodes.
•
Add edge: to add an edge, click the source node, optionally click outside of nodes to add bends, finally click the targe
You can only add edge between two ports.
•
Delete element: click a portnode or edge to delete it.
1.8 Editing Graphs
Click on Graphs tab to access to the graphs management widget. Use the text line at the top of the widget to filter
them using names.
There is four preview mode :
• No icons: Do not display previews.
• Small icons
8
Chapter 1. Porgy User Interface
Porgy Documentation, Release 1.2
• Medium icons
• Large icons
To display a larger preview hover it, a tooltip with a larger preview will appear. You can display a visualization/edition
view for a graph by double clicking on it or by dragging it and dropping it on the workspace.
1.8.1 Graph View
This is the visualization/edition view for graphs.
Configuration
• Labels
– Display node labels: toggle the portnodes and ports label.
Contextual menu
Right-click (Ctrl-click Mac) to display this menu:
• Options
– Center view : move the camera to visualize all the ports in the graph.
1.8. Editing Graphs
9
Porgy Documentation, Release 1.2
– Redraw : redraw the graph and center the view. You can choose between a force drawing algorithm
(GEM (Frick)) or a hierarchical drawing algorithm (Sugiyama (OGDF))
– Save selection : allow the user to save the current selection in a new local property or in an existing
one. Click on New property and input the name of the new property to create a new property. To
erase an existing one just click on the name of the property to replace. This is useful to create P and
Ban properties.
– Restore selection : allow the user to replace the current selection by the selected property.
Interaction tools
•
Navigation: move, rotate and zoom the view. Zooming behavior: the point under the cursor is moved
closer to the center.
•
Get information: click an element (portnode or edge) and Porgy displays all available properties of that
element.
•
Rectangle selection: select all elements touching the selection box (the previous selection is replaced, but
can be recovered with Undo). With Shift, the newly selected elements are added to the current selection; with
Ctrl (Alt on Mac), the selected elements are removed from the current selection.
•
Selection edition: modify the shape and position. Shift-click modifies only coordinates. Ctrl-click modifies only size. Left-click outside the selection resets the selection.
•
Edit edge bends: click on an edge to select it (with this tool), then Shift-click to add a new bend, click a
bend to move it, or Ctrl-click (Alt on Mac) to remove a bend.
•
Add portnodes: allow the user to create,edit and add portnodes.
•
Add edge: to add an edge, click the source node, optionally click outside of nodes to add bends, finally click the targe
You can only add edge between two ports.
•
Delete element: click a portnode or edge to delete it.
1.9 Editing derivation trees
Click on Derivation Trees tab to access to the Derivation Trees management widget. Use the text line at the top of
the widget to filter derivation trees using names. You can display a visualization/edition view by double clicking on it
or by dragging it and dropping it on the workspace. There is 4 kind of visualizations (see the views section for more
information on Porgy views).
• Derivation Tree view: This is the general visualization for derivation trees.
• Scatter plot 2D view
• Histogram view
• Small multiple view
10
Chapter 1. Porgy User Interface
Porgy Documentation, Release 1.2
To rename a derivation tree select it and click with the left button on the it’s name. Input the new name then press
return to validate the new name. If you press the escape button the edition will be canceled.
1.9.1 Contextual menu
• Show : Create a visualization/edition view on the workspace. One can also double click on the rule or drag and
drop a list element on the workspace to display it.
• Create new : Create a new derivation tree based on the graphs selected in the main derivation tree.
• Delete :Destruct the selected element. One cannot delete the main derivation tree.
1.9.2 Derivation Tree view
This is the base view for derivation trees. Displays the graphs present in a derivation tree as a hierarchy. Each
edge between two graphs represents the transformation of the source to the destination. A transformation can be an
application of a rule (simple rule), an application of a strategy or a modification of the p property (Set position).
Contextual menu
Right-click (Ctrl-click Mac) to display this menu:
• Options
– Center view : move the camera the visualize all the elements in the derivation tree.
– Redraw : redraw the derivation tree and center the view.
• Dialog
– 3D Overview: toggle top left overview
If a graph is present under the cursor some other options are available:
• Open in a new graph view : show the graph under the pointer in a new view.
• Add to/Remove from the selection : if the graph is present in the current selection remove it else add it.
1.9. Editing derivation trees
11
Porgy Documentation, Release 1.2
12
Chapter 1. Porgy User Interface
Porgy Documentation, Release 1.2
Interaction tools
•
•
•
•
•
Navigation: move, rotate and zoom the view. Zooming behavior: the point under the cursor is moved
closer to the center.
Get information: click an element (portnode or edge) and Porgy displays all available properties of that element.
If you hoover an edge it will display the transformation information as a tool tip and it will highlight
portnodes involved in this transformation. Here is the color code used when higlighting portnodes
involved in a transformation: * Simple rule : LHS portnodes are in red and RHS are in blue. * Set position
: portnodes that are only in the original P property are in red, portnodes only in the new P property are in
blue and portnodes in both old and new are in green.
Rectangle selection: select all elements touching the selection box (the previous selection is replaced, but
can be recovered with Undo). With Shift, the newly selected elements are added to the current selection; with
Ctrl (Alt on Mac), the selected elements are removed from the current selection.
Zoom box: draw a rectangle and zooms on this area.
Open in a new graph view : click on a graph and it will be displayed a new view.
•
Selection edition: modify the shape and position. Shift-click modifies only coordinates. Ctrl-click modifies only size. Left-click outside the selection resets the selection.
•
Edit edge bends: click on an edge to select it (with this tool), then Shift-click to add a new bend, click a
bend to move it, or Ctrl-click (Alt on Mac) to remove a bend.
Configuration
• Labels
– Node labels: displays the graphs names.
– Meta-node labels: displays the names of the portnodes inside each graph. This option can slow down
the application.
• Rendering parameters
– Edge size interpolation: scales the edges size in function of the size of their source and target nodes.
– Scale labels: scales the label size in function of the node size
1.9.3 Scatter plot 2D View
This view allows to create 2d scatter plots of graph nodes from graph properties (supported types are Metric and
Integer). A scatter plot is a type of mathematical diagram using Cartesian coordinates to display values for two
variables for a set of data. The data is displayed as a collection of points, each having the value of one variable
determining the position on the horizontal axis and the value of the other variable determining the position on the
vertical axis.
By selecting a set of graph properties, a scatter plot matrix will be displayed for each combination of two different
properties. Each scatter plot can then be displayed individually in a more detailed way.
A set of interaction tools are bundled with the view to perform selection, statistical analysis, ...
1.9. Editing derivation trees
13
Porgy Documentation, Release 1.2
1.9.4 Histogram view
This view plug-in allows to create frequency histograms from graph properties (supported types are Metric and Integer). By selecting a set of graph properties, frequency histograms are computed and displayed for values associated to
nodes (or edges).
This view also allows to map visual properties (colors, sizes, glyphs, ..) of the graph elements with respect to a graph
metric in a visual way. These operations can be done with the “Metric mapping” interactor. Many interaction tools are
also bundled with the view to perform elements selection, statistical analysis, ...
1.9.5 Small multiple View
This view allows to visualize the transformations between different graphs using small multiples and/or animation.
User can add intermediate states to emphasize elements present in the P property, the LHS and the RHS.
Small multiples are useful to have an overview of the whole states of the derivation tree. The aim of the animation is
to interpolate the change each states to show a video of the change. You see the film of the transformations.
Configuration
General
• Intermediate states [compute intermediate states between two graphs.]
– RHS : elements in the right hand side have their border highlighted in red.
– LHS : elements in the left hand side have their border highlighted in blue.
14
Chapter 1. Porgy User Interface
Porgy Documentation, Release 1.2
– P : elements in the P property have their border highlighted in pink.
• Widgets
– Small multiples
– Animation
• Node labels [show or hide the node labels.]
– Scale labels: scales the label size in function of the node size
Animation
• Animation duration : the duration of the animation between two states.
• Rule preview : displays or hide a preview of the rule involved in the current transformation if the current
transformation involve a rule.
Small multiples
• Small multiples layout
– Automatic : computes automatically the number of lines in function of the number of pictures.
– Force number of lines : force the number of lines.
• Rendering parameters
– Scale titles : force the labels of the small multiples to take the whole available space or to have an
uniform font size.
– Space between elements : set the margin between each preview.
1.10 Editing Strategies
1.10.1 Strategies management
This widget handle all the strategies management actions.
• Add strategy :
– Create an empty strategy
– Strategy from derivation tree : try to compute the strategy from the selected grap elements in the
main derivation tree.
1.10. Editing Strategies
15
Porgy Documentation, Release 1.2
– Import from a file : load a strategy from a file. The new strategy will have the name of the file loaded
without the file extension.
• Remove strategy: remove the selected strategy
• Export strategy : save the selected property on the disk.
1.10.2 Applying a strategy
The application of a strategy can be made with 2 different way:
• Drag and drop a strategy to:
– a graph metanode in a derivation tree view. If the operation is valid a green square will appear.
– a graph view.
• Select a strategy, select a graph in the graphs widget and press on the Execute button.
1.10.3 Strategies edition
When selecting a strategy in the strategy management widget it’s code appear in the edition widget.
Strategies macro system
You can call an existing strategy inside another strategy. Just insert the name of the strategy to insert surrounded by #
in a strategy. By example we have two strategies:
Strategy_1
rule_1;rule_2
Strategy_2
rule_3;rule_4
We want to create a new strategy that uses the strategy 1 and the strategy 2
Strategy_3
rule_5;#Strategy_1#;rule_7;#Strategy_2#;rule_10
Editing Key Bindings
To select (mark) text hold down the Shift key whilst pressing one of the movement keystrokes, for example,
Shift+Right will select the character to the right, and Shift+Ctrl+Right will select the word to the right, etc. The
list of key bindings which are implemented for editing:
16
Chapter 1. Porgy User Interface
Porgy Documentation, Release 1.2
Keypresses
Backspace
Delete
Ctrl+C
Ctrl+Insert
Ctrl+K
Ctrl+V
Shift+Insert
Ctrl+X
Shift+Delete
Ctrl+Z
Ctrl+Y
Left
Ctrl+Left
Right
Ctrl+Right
Up
Down
PageUp
PageDown
Home
Ctrl+Home
End
Ctrl+End
Alt+Wheel
Action
Deletes the character to the left of the cursor.
Deletes the character to the right of the cursor.
Copy the selected text to the clipboard.
Copy the selected text to the clipboard.
Deletes to the end of the line.
Pastes the clipboard text into text edit.
Pastes the clipboard text into text edit.
Deletes the selected text and copies it to the clipboard.
Deletes the selected text and copies it to the clipboard.
Undoes the last operation.
Redoes the last operation.
Moves the cursor one character to the left.
Moves the cursor one word to the left.
Moves the cursor one character to the right.
Moves the cursor one word to the right.
Moves the cursor one line up.
Moves the cursor one line down.
Moves the cursor one page up.
Moves the cursor one page down.
Moves the cursor to the beginning of the line.
Moves the cursor to the beginning of the text.
Moves the cursor to the end of the line.
Moves the cursor to the end of the text.
Scrolls the page horizontally (the Wheel is the mouse wheel).
1.11 Help widget
This widget will help you to use Porgy perspective. Click on a link in the main widget to navigate in the user manual.
You can navigate in the history any time using the Previous and Next buttons. To go directly to the contents page use
the Home button.
By pressing the search button (the top-left one) it will display the index/content panel that will help you to navigate
through the user manual. Double click on an item to show the corresponding page in a new tab.
1.11. Help widget
17
Porgy Documentation, Release 1.2
18
Chapter 1. Porgy User Interface
CHAPTER
TWO
PORGY DATA STRUCTURE
The Porgy structure is made of these elements :
• Portgraph: a common base structure for graphs and rules. Contains Portnodes and edges.
– Graph: a state of the model.
– Rule: a transformation rule.
• Derivation tree: keeps a trace of each rewrite operation.
2.1 Portgraphs
Portgraphs are the common ancestors for Rules and Graphs. They are made of portnodes and edges which link the
portnodes via the ports. In practical terms a portnode is made of nodes and edges. A first node is the center of the
portnode. The nodes connected to the center node are the ports. The connections between portnodes can only be done
through ports.
The properties detailed below must be used in order to identify each part of a portnode:
• PortNode_type: type of the node. Two possible values: center or port.
• State: define a particular state of the port. The possible values depend on the data used and can also be different
between rules and graphs:
– hidden: the port cannot be connected to another one (for biochemical networks).
– used: the port is connected to another one. This property can be used along with the property called arity
(see below).
– free: the port can be connected to another one (for biochemical networks).
– not used (only for rules): the state and arity of the port are not taken into account by the matching algorithm
for the application of a rule.
– Principal : the port is the principal port of the agent (for interaction nets).
2.2 Rules
A rule is composed of a left-hand side, a right hand-side and a bridge which connects both sides. The red edges
represent connections of equivalent ports between the left-hand side and the right-hand side. For instance, the two
ports labeled 4 in both EGFR portnodes on the left-hand side are connected to the ports also labeled 4 in the right-hand
side. These specific edges allow to restore the state of the node and its connections after rewriting (used mostly for
19
Porgy Documentation, Release 1.2
20
Chapter 2. Porgy data structure
Porgy Documentation, Release 1.2
ports in the not used state or with an arity greater than zero). All connections between the left-hand side and the
right-hand side must go through a port of the bridge.
Some additional properties are required to define a rule:
• Arity: Arity of a port in the left-hand side of the rule. Sometimes a port needs to be connected to some other
ports in the graph which are not part of the left-hand side of the rule. This property is used to indicate the number
of connections.
• Rule_side: For each component (nodes and edges), identify the part of the rule. There are four possible values:
left, right, bridge and bridge_port. The value bridge is used to indicate which node is the center of the bridge.
It is also used for the edges on either side of the bridge. The value bridge_port is used to identify the ports of
the bridge.
• saveId: Only useful on the right-hand side. Used to save the initial Tulip id of nodes and edges before rewriting.
This property needs to be set before applying the rewrite algorithm.
• M: if an element of the right-hand side of the rule has its M property set to true, then it is added to the current P
position of the newly generated graph during rewriting.
2.2. Rules
21
Porgy Documentation, Release 1.2
2.3 Graphs
The graphs have some additional properties to keep a trace of each transformation: * new: Boolean property set to
true if the edge or the portnode is new, i.e. it has been created or modified by the last transformation.
The subgraphs of each graphs which represent the instantiation of the left-hand side of a rule, use some specific
properties:
• tag: Tulip id of the corresponding node or edge in the left-hand side of the rule.
• P: This property is used to define a subgraph of a graph m. This subgraph can be used to restrict the search of
the instances of the left-hand rl side of a rule r in a graph m. When one tries to find the instances I of rl in m, at
least one node of each I must be in P. It is possible to define more than one P.
2.4 Derivation trees
The nodes of the derivation tree are metanodes associated to each generated graphs. There is a black edge between
two metanodes a and b if the application of a rule transforms a source graph a into a destination graph b. The label
of the metanodes (on the left side of each node) is the name of the graph. The result of a strategy is represented by a
green edge between the source graph and the results of the strategy.
If the result of the application of a rule or a strategy is a red node the rule or the strategy application ends on a failure.
22
Chapter 2. Porgy data structure
CHAPTER
THREE
BUILDING THE DERIVATION TREE
In Porgy there is two way to build a derivation tree:
• Applying rules
• Applying strategy
3.1 Applying rules
The application of a rule to a given graph consists in two phases: find at least one instance of the left-hand side of the
rule inside the graph, then replace this instance by the right-hand side of the rule. Each instance of the left hand-side
is computed as a subgraph of the corresponding graph.
3.2 Strategies
A strategy is a small script language created to improve the rule rewriting possibilities.
3.2.1 Grammar
3.2.2 Strategy operators
23