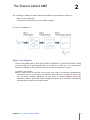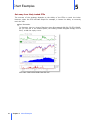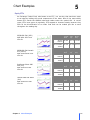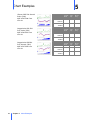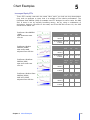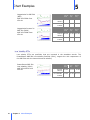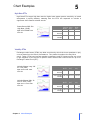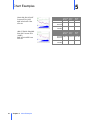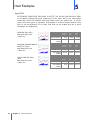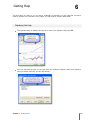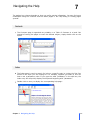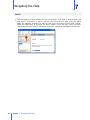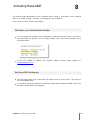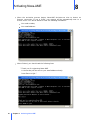
1
User's Guide
NoxaAME for
NeuroShell Trader
© <2012> <Noxa Analytics, Inc.>
Contents
Chapter 1
1 Welcome to AME
Chapter 2
3 The Science behind AME
Chapter 3
5 Quick-start Tutorials
5 Inserting An Expert Advisor to a chart
8 Setting the Output Flag
10 Setting the Window Parameter
13 Setting the Negative Flag
15 Building a Trading Strategy from scratch
Chapter 4
24 Setting the Parameters
Chapter 5
27 Chart Examples
27 Timing the Volatility Index®
39 Timing the S&P 500 index®
2
Chapter 6
45 Getting Help
Chapter 7
47 Navigating the Help
Chapter 8
49 Activating Noxa-AME
Chapter 9
52 How to Buy Noxa-AME
Chapter 10
53 Disclaimer/ License Agreement
Chapter 11
56 Contact Information
Welcome to AME
1
Next-Generation Technology for New markets
Noxa AME (Adaptive Mixture of Experts) is an Expert
Advisor that runs as an add-on to Ward System Group's
NeuroShell Trader®.
Adaptive: Markets are not static. They are dynamic and
susceptible to quick changes, even more so with the
influx of High Frequency Trading. Adaptive strategies
should be able to adjust to not just changing market
conditions, but changes in the fundamental way the
market works.
Mixture: Mixtures combine the beliefs of several expert
algorithms into a single prediction. They are capable of
greater predictive performance than any of their individual
experts.
Experts: It is possible for price patterns to develop with
different outcomes; they often run contrary to each
other. Most often we are pretty useless at making sense
of it all. One possible explanation is that we naturally
zoom out on the patterns; we don’t have a good idea
about the details. Expert algorithms however can
deconstruct a pattern into low level features and look at
how they progress through time in various contextual
scenarios.
Chapter 1 Welcome to AME
1
Welcome to AME
1
Important Notes
You must have NeuroShell Trader® v6.2 and above to use this product.
You must have internet access during installation.
The Expert Advisor does not "peek" into the future, making it suitable for trading.
This manual is provided
accompanying add-on. It
instruments, but rather a
The techniques presented
risk inherent in trading.
to instruct you on using NeuroShell Trader® and the
is not a recommendation to buy or sell exchange-traded
guideline to using the Expert Advisor within the software.
here should only be used by investors who are aware of the
Getting started
You can find a gentle description of the product in the Science behind AME section.
Run through the Quick-Start Tutorials to familiarize yourself with the basics of the
Expert Advisor.
You can jump directly to the Setting the Parameters section.
There is nothing better than Chart Examples.
2
Chapter 1 Welcome to AME
The Science behind AME
2
The challenge in making an Expert Advisor like AME lies in developing its ability to:
Detect price formations,
Track patterns of behavior as the market changes.
Let see how AME does it:
Step1: Price Patterns
The first thing AME does is parse price data into patterns of various time-scales. During
this early stage of the process AME does not know how to trade yet. So it increases its
chances by looking at many different options of what the patterns could be.
Multiple Time-Scales
Price patterns can be intricate to the point they lead to conflicting interpretations.
Fortunately price can be broken at different time-scales into constituent parts that
can be better handled separately. At this point, a Causal Singular Spectrum
Analysis (CSSA) is performed. CSSA recognizes whether price should be decomposed
and determines how best to break it down.
Chapter 2 The Science behind AME
3
The Science behind AME
2
Step2: Trading Policies
Of course it’s not enough for AME to just identify patterns. It has to know how to exploit
them. So it solicits the help of Expert Algorithms with different areas of expertise on
trading policies. Hundreds of algorithms work in parallel to test each and every one of
the patterns identified. At this point quantity trumps accuracy. It is more important for
AME to choose from a large number of policies and narrow down from there.
Adaptive
The Expert Algorithms are not told what they should do in any particular situation. So
they must learn by themselves how the market works. Reinforcement Learning is
used as the learning method; it is a technique that borrows from biology, where the
behavior of an agent adapts on the fly from the amount of positive stimuli, or
reinforcement, it receives.
Risk Adjusted Returns
The change in Sharpe ratio constitutes the reinforcement signal for the Expert
Algorithms; it is a measure of performance versus risk:
Sp = change of ( Rp /
where
Rp = return
= standard deviation of return also commonly called "volatility risk"
A low Sharpe ratio indicates either that a trading policy is not getting returns in
proportion to the risk involved, or that the risk involved is excessive by any
reasonable standard. It is important for the Expert Algorithms to make that distinction
so that they properly compensate for the amount of risk undertaken.
Step3: The No-Regret Games
Different trading policies are better than others at different times. AME has to know how
to quickly shift emphasis from one policy to another. So just like a person learns from
practice, AME puts all policies to work through practice games between the experts and
the market. These games are then combined together in such a way that "regret" is
minimized to produce the final ratings for the current trade. The term “regret” refers to
how sorry we are in retrospect, for not having followed the best system available to us.
This way we do well no matter what the market does.
4
Chapter 2 The Science behind AME
Quick-start Tutorials
3
The tutorials in this section provide a quick introduction to using AME. They are intentionally
kept brief so that you can start experimenting quickly.
Inserting An Expert Advisor to a chart
With a chart open, choose Insert > New Indicator:
The Indicator Wizard opens. Scroll down the list until you see the Noxa entry. Click
Next:
Chapter 3 Quick-start Tutorials
5
Quick-start Tutorials
3
A list of available indicators is given. Scroll down the list until you see Noxa AMEExpert. Click Next:
The indicator property dialog opens. Click Finished:
6
Chapter 3 Quick-start Tutorials
Quick-start Tutorials
3
You now have successfully added an Expert Advisor to your chart:
(see chart "AME #1 Inserting an Expert Advisor to your chart.cht").
Chapter 3 Quick-start Tutorials
7
3
Quick-start Tutorials
Setting the Output Flag
Inputs description
Noxa AME-Expert(Input series, Window, Output Flag, Negative Flag)
Input
Values
Description
Input Series
OHLC, Adjusted
Close
Default = Close
Input series
Window
2 ~ 150 bars
Default = 50
Rolling time period for the Sharpe ratio calculation
Output Flag
0 or 1
Default = 1
Setting this flag will cause the Advisor to display
either the buy/sell signals or the Equity Curve:
1: buy/sell signals
0: Equity Curve
Negative
Flag
0 or 1
Default = 0
Setting this flag to 1 will cause the Advisor to trade
the opposite rule. This is useful in a trading strategy
for which the Advisor has been set to produce a
down-trending Equity Curve:
0: signals are left unchanged
1: signals are inverted
Setting the Output Flag will cause the Expert Advisor to display either the buy/sell
signals or the Equity Curve. By default, it is set to display the buy/sell signals. To display
the Equity Curve, set the Output Flag to 0 as described below:
Double click on the title bar of the Expert Advisor:
8
Chapter 3 Quick-start Tutorials
Quick-start Tutorials
3
The properties dialog box opens. Set the Output Flag value to 0. Click Finished:
The Equity Curve from the Expert Advisor is now displayed:
(see chart "AME #2 Setting the Output Flag.cht").
Note on the Equity Curve
The Equity Curve provides a quick analysis of how an Expert Advisor has performed. It
is a graphical representation of the cumulated profit realized at the current bar.
With AME, an Equity Curve with a consistently positive slope, or negative for that
matter, indicates that the Expert Advisor is profitable. You can set the Negative Flag
to accommodate for the sign of the Equity Curve.
Chapter 3 Quick-start Tutorials
9
3
Quick-start Tutorials
Setting the Window Parameter
Inputs description
Noxa AME-Expert(Input series, Window, Output Flag, Negative Flag)
Input
Values
Description
Input Series
OHLC, Adjusted
Close
Default = Close
Input series
Window
2 ~ 150 bars
Default = 50
Rolling time period for the Sharpe ratio calculation
Output Flag
0 or 1
Default = 1
Setting this flag will cause the Advisor to display
either the buy/sell signals or the Equity Curve:
1: buy/sell signals
0: Equity Curve
Negative
Flag
0 or 1
Default = 0
Setting this flag to 1 will cause the Advisor to trade
the opposite rule. This is useful in a trading strategy
for which the Advisor has been set to produce a
down-trending Equity Curve:
0: signals are left unchanged
1: signals are inverted
The Window is a rolling time period that the Expert Algorithms use to calculate their
Sharpe ratio from. The Equity Curve obtained by default is probably mediocre. The
Window size needs to be set to a more optimal value:
Set the Output Flag to 0 to display the Equity Curve.
Double click on the title bar of the Expert Advisor:
10
Chapter 3 Quick-start Tutorials
3
Quick-start Tutorials
The properties dialog box opens. Set the Window to the value of your choice. Click
Finished:
Details on setting the Window parameter
An Equity Curve with a consistently positive or negative slope indicates that the
Expert is profitable. Up or down-trending curves are equally valid.
A typical range for the Window size is 2 to 100 bars.
Set the Window size which produces the best up or down-trending Equity Curve
as shown below:
Case of an up-trending Equity Curve,
Window = 33
Chapter 3 Quick-start Tutorials
11
3
Quick-start Tutorials
Case of a down-trending Equity Curve,
Window = 30
(see chart "AME #3 Setting the Window parameter.cht").
12
Chapter 3 Quick-start Tutorials
3
Quick-start Tutorials
Setting the Negative Flag
Inputs description
Noxa AME-Expert(Input series, Window, Output Flag, Negative Flag)
Input
Values
Description
Input Series
OHLC, Adjusted
Close
Default = Close
Input series
Window
2 ~ 150 bars
Default = 50
Rolling time period for the Sharpe ratio calculation
Output Flag
0 or 1
Default = 1
Setting this flag will cause the Advisor to display
either the buy/sell signals or the Equity Curve:
1: buy/sell signals
0: Equity Curve
Negative
Flag
0 or 1
Default = 0
Setting this flag to 1 will cause the Advisor to trade
the opposite rule. This is useful in a trading strategy
for which the Advisor has been set to produce a
down-trending Equity Curve:
0: signals are left unchanged
1: signals are inverted
This flag can be set to invert the buy/sell signals. This is particularly useful in a trading
strategy for which the Expert Advisor has been set to produce a down-trending Equity
Curve. In this case you can let NeuroShell Trader set the Negative Flag for you. You
can read more here on how it is done.
You can also set the Negative Flag manually as shown below:
Double click on the title bar of the Expert Advisor:
Chapter 3 Quick-start Tutorials
13
Quick-start Tutorials
3
The properties dialog box opens. Set the Negative Flag value to 1. Click Finished:
The Equity Curve for the Expert is now shown inverted:
(see chart "AME #4 Setting the Negative Flag.cht").
14
Chapter 3 Quick-start Tutorials
Quick-start Tutorials
3
Building a Trading Strategy from scratch
Insert an Expert Advisor and set the parameters as described in the previous sections.
In the example below (iPath S&P 500 VIX MT Futures ETN (VXZ End Of Day)), the
Equity Curve of the expert happens to be down-trending:
Select Insert> New Trading Strategy… The Trading Strategy Wizard opens with a
list of Templates available for use,
Select (No Template) located at the top of the list, click Next:
Chapter 3 Quick-start Tutorials
15
Quick-start Tutorials
Select the Long Entry tab to specify the rule for when to buy,
Press the Add Condition(s) button:
The Long Entry condition(s) dialog box opens,
Press the Indicator... button:
16
Chapter 3 Quick-start Tutorials
3
Quick-start Tutorials
3
The Indicator Category dialog box opens,
Scroll down the list until you see Crossover & Breakout Identification. Click Next:
A full list of available indicators is given.
Scroll down the list to the Crossover Above indicator. Click Next:
Chapter 3 Quick-start Tutorials
17
Quick-start Tutorials
3
The wizard for the Crossover Above indicator opens,
Select (double click) the Time Series #1 entry:
The Edit Parameter dialog box opens,
Scroll down the list of data series available until you see the Expert Advisor that was
inserted in the chart, Click OK:
18
Chapter 3 Quick-start Tutorials
Quick-start Tutorials
3
You are back to the wizard for the Crossover Above indicator,
Select (double click) the second input Time Series #2:
Enter the numeric value 0, Click OK:
The long Entry is now set; a buy long order will be placed each time the signal from
the Expert Advisor crosses over above the zero line. Click Finished.
Make sure you set the Output Flag to 1 so that the Expert displays the buy/sell
signals,
Chapter 3 Quick-start Tutorials
19
Quick-start Tutorials
3
Set the lock icons located to the left of the inputs so that only the Negative Flag is
optimized:
You don’t want to set a Long Exit in this trading strategy. The Long Exit signals will be
automatically triggered by the short entries. So, uncheck the "Generate a sell long"
check box for the Long Exit as shown below:
20
Chapter 3 Quick-start Tutorials
Quick-start Tutorials
3
Repeat the previous steps to set the Short Entry conditions (Short Entry tab). This
time, choose and set the Crossover Below indicator in order to place a sell short
order each time the signal from the Expert Advisor crosses over below the zero line,
Make sure you set the Output Flag to 1 and let only the Negative Flag to be
optimized,
Click Next:
The trading strategy is now added to your chart:
Chapter 3 Quick-start Tutorials
21
3
Quick-start Tutorials
The "Close" is not needed anymore. To hide it, select Format> Hide/Unhide Data...
Unselect the sub-graph corresponding to the Close and click OK:
You can now add the system Equity to your chart; Go to Insert Menu> new
indicator,
In the Indicator Wizard, select the
category, click Next:
22
Chapter 3 Quick-start Tutorials
Trading Strategy, System Information
Quick-start Tutorials
3
A list of available indicators is given. Choose the first indicator in the list, System
Equity (All trades), click Next:
The property dialog box opens. Click Finished:
Chapter 3 Quick-start Tutorials
23
Quick-start Tutorials
You now have successfully built a trading strategy:
(see chart "AME #5 Building a Trading Strategy from scratch.cht").
24
Chapter 3 Quick-start Tutorials
3
Setting the Parameters
4
AME is as easy to set as setting up a Moving Average
There is only one parameter to set, the Window parameter. The other two entries are
just flags. You can read more about setting these flags in the Quick-Start tutorials
section.
Noxa AME-Expert( Input series, Window, Output Flag, Negative Flag )
Input
Values
Description
Input Series
OHLC, Adjusted
Close
Default = Close
Input series
Window
2 ~ 150 bars
Default = 50
Rolling time period for the Sharpe ratio calculation
Output Flag
0 or 1
Default = 1
Setting this flag will cause the Advisor to display
either the buy/sell signals or the Equity Curve:
0: Equity Curve
1: buy/sell signals
Negative
Flag
0 or 1
Default = 0
Setting this flag to 1 will cause the Advisor to
trade the opposite rule. This is useful in a trading
strategy for which the Advisor has been set to
produce a down-trending Equity Curve:
0: signals are left unchanged
1: signals are inverted
Chapter 4 Setting the Parameters
25
Setting the Parameters
4
In some cases, only a few settings stand out, so it is important to go through all values
in the 2 to 50 range at least.
To illustrate, the graph below shows some candidates for FedEx Corporation (FDX).
See chart "AME #100 Setting FDX.cht".
AME is easier to set than setting up a Moving Average
Read about "Proxy" trading by timing an index. These strategies are almost parameterless!
26
Chapter 4 Setting the Parameters
Chart Examples
5
We have included several screen shots of example charts with commentary. The charts
were reduced to a bare minimum for the sake of clarity. They do not use hindsight or
forward reference making them suitable for trading. The returns reported do not account for
transaction costs or slippage, but because of how infrequently the models trade and how
liquid the instruments traded are, transaction costs and slippage should be minimal assuming
a decent sized account.
The charts can be found in the NeuroShell Trader 6\charts\Noxa\Noxa AME folder.
Timing the Volatility Index®
For the uninitiated, the CBOE Volatility Index®, or VIX, is a measure of risk based on the
S&P 500. It is an annualized number that represents what traders think the movements in
the S&P 500 are going to be in the near term. For example, a reading of 50 means that 50
/12 = 4.2% is about the range traders are anticipating the S&P 500 to trade in over the
next 30-day period.
The Rationale
The VIX forms mean-reverting patterns that are highly predictable,
The VIX index can't be traded directly but there are Exchange-Traded Products or ETPs
available that are designed to track the VIX and that can be traded throughout the day
just like a stock,
The VIX and ETPs are so well correlated that what works on one works on the other.
The Strategy
Take short-term positions (long/short) in S&P 500 ETPs by timing the VIX.
Buy/short at the next open when AME applied to the VIX crosses above or below the
zero line:
Buy long:
Chapter 5 Chart Examples
27
Chart Examples
5
Sell short:
Note three things:
The Input Series is set to the VIX meaning that the buy/sell signals are obtained
from the VIX itself as opposed to the instrument being traded.
The Window parameter has been set to 16 during a Calibration step. A description
of this step is given later in this section.
The Negative Flag has to be set to 0 or 1 whether there is positive or negative
correlation between the instrument being traded and the VIX.
See illustration
Case of a positive correlation: set Negative Flag to 0
Case of a negative correlation: set Negative Flag to 1
Note the strong correlation between the ETPs and the index.
28
Chapter 5 Chart Examples
Chart Examples
5
The calibration step
The Window parameter is set during this calibration step.
In the graph above we have assumed we could buy/short the VIX index at the next
open when AME crosses above or below the zero line. As you can see in the bottom
panel, this strategy would have put up impressive numbers: an hypothetical 66.5%
profitable trades with about 1 trade per week over the entire 5-year test period (see
chart "AME #300 Timing the VIX index.cht").
See details
The entry rules
Buy long:
Sell short:
Note that the Window parameter is set to optimize to the same value for
both the long and short rules.
Chapter 5 Chart Examples
29
5
Chart Examples
Paper Trading
Five years of data are hold out for testing purpose
The return on Trades is maximized
Results
The optimized value for the Window parameter can be found in the Trading
Strategy Analysis wizard under the "Trading Rules" tab as shown below:
Zooming in on the buy/sell signals:
Detailed Analysis (averaged out over 5 years paper trading):
Long & Short
Annual Return
30
Short only
Long only
209%
118.7%
90.3%
% Profitable Trades
66.5%
62.4%
70.7%
Average Trade Span
5 bars
6 bars
5 bars
Chapter 5 Chart Examples
Chart Examples
5
Maintenance
Maintenance should be minimal. Window = 16 has been a good value since 1994; AME
was able to produce consistent returns over the entire 5-year test period and did an
excellent job at sidestepping the 2008 bear market. More importantly, AME handled well
the VIX new formulation that took place in 2003, so we expect it to persist.
However it is a good idea to check once in a while how the system equity curve behaves.
Ultimately, if it starts leveling out, you will need to recalibrate. Then you will have to
reset the Window to its new value in the trading rules.
See details
You can recalibrate by simply re-optimizing the chart "AME #300 Timing the VIX
index.cht":
In the next window that opens, click No to start optimizing from the beginning:
Chapter 5 Chart Examples
31
Chart Examples
5
Get away from thinly traded ETPs
The success of the strategy depends on the ability of the ETPs to track the index.
However, when the ETP becomes illiquid for example, it looses it's ability to correctly
track the VIX.
See illustration
To illustrate, here is a chart of Barclays Long B Leveraged S&P 500 TR ETN (BXUB).
As you can see in the bottom panel, the trading volume dropped sharply end of
2011, so did the equity curve.
See chart "AME #320 BXUB from VIX.cht".
32
Chapter 5 Chart Examples
5
Chart Examples
Equity ETFs
An Exchange Traded Fund, also known as an ETF, is a security that tracks an asset
or an index by holding the actual components of the index. One of the most widely
known ETFs tracks the S&P500 index and trades under the symbol SPY. In recent
years, ETFs have grown in popularity. ETFs appeal to investors mostly because they
offer all the diversification of an index fund and can be traded just like a stock
throughout the trading day.
SPDR S&P 500 (SPY)
AME $301 SPY from
VIX.cht
Long & Long
Short
only
Annual 28.8% 15.1%
Return
% Profitable
Trades
SPDR S&P 500 Growth
ETF (SPYG)
AME #302 SPYG from
VIX.cht
ProShares Short S&P
500 (SH)
AME #303 SH from
VIX.cht
iShares S&P 500 Index
(IVV)
AME #304 IVV from
VIX.cht
Long & Long
Short
only
Short
only
6.7%
62.6% 67.9%
57.4%
Long & Long
Short
only
Short
only
9.4%
17.8%
62.3% 55.3%
69.3%
Long & Long
Short
only
Short
only
Annual 28.8% 15.1%
Return
% Profitable
Trades
Chapter 5 Chart Examples
57.1%
Annual 27.3%
Return
% Profitable
Trades
13.8%
63.3% 69.3%
Annual 18.5% 11.8%
Return
% Profitable
Trades
Short
only
63% 68.7%
13.7%
57.4%
33
5
Chart Examples
iShares S&P 500 Growth
Index (IVW)
AME #305 IVW from
VIX.cht
Long & Long
Short
only
Annual 26.6% 15.5%
Return
% Profitable
Trades
Guggenheim S&P 500
Pure Value (RPV)
AME #306 RPV from
VIX.cht
Guggenheim S&P500
Pure Growth (RPG)
AME #307 RPG from
VIX.cht
34
Chapter 5 Chart Examples
11.1%
64.4% 69.3%
59.6%
Long & Long
Short
only
Short
only
Annual 29.4% 16.5%
Return
% Profitable
Trades
Short
only
12.9%
55.8% 60.7%
50.9%
Long & Long
Short
only
Short
only
Annual
Return
21% 14.2%
6.8%
% Profitable
Trades
60.6% 65.5%
55.8%
5
Chart Examples
Leveraged Equity ETFs
These ETFs usually come with the name “Ultra” and if you look into their descriptions
they seek to generate a return that is a multiple of the index's performance. The
ProShares Ultra S&P500 (SSO) for example is an ETF designed to return twice the S&P
500. It does it not by actually borrowing money, but by using a combination of
derivatives. However, the effect is the same, and if the S&P 500 returns 1%, the SSO
should return about 2%.
ProShares Ultra S&P500
(SSO)
AME #308 SSO from
VIX.cht
Long & Long
Short
only
Annual 52.4% 26.7%
Return
% Profitable
Trades
ProShares UltraPro
S&P500 (UPRO)
AME #309 UPRO
adjusted from VIX.cht
Long & Long
Short
only
Annual 71.6% 58.9%
Return
% Profitable
Trades
ProShares UltraShort
S&P500 (SDS)
AME #310 SDS from
VIX.cht
Annual
Return
57% 19.9%
63.7%
56%
Long & Long
Short
only
Annual 73.3%
Return
% Profitable
Trades
Chapter 5 Chart Examples
65.3% 75.6%
Long & Long
Short
only
% Profitable
Trades
ProShares UltraPro Short
S&P500 (SPXU)
AME #311 SPXU
adjusted from VIX.cht
62.3% 67.9%
Short
only
25.7%
56.7%
Short
only
12.7%
55.2%
Short
only
37.1%
71.4%
Short
only
8.3%
65.1%
64.7% 50.6%
79.1%
35
5
Chart Examples
Guggenheim 2x S&P 500
(RSU)
AME #312 RSU from
VIX.cht
Long & Long
Short
only
Annual 50.8% 26.2%
Return
% Profitable
Trades
Guggenheim Inverse 2x
S&P 500 (RSW)
AME #313 RSW from
VIX.cht
64.1% 67.9%
Long & Long
Short
only
Annual 60.8% 23.4%
Return
% Profitable
Trades
64.1% 58.8%
Short
only
24.6%
60.3%
Short
only
37.4%
69.5%
Low Volatility ETFs
Low volatity ETFs are portfolios that are invested in the steadiest stocks. The
PowerShares S&P 500 Low Volatility Portfolio (SPLV), targets the 100 components of
the S&P 500 with the lowest historical volatility.
PowerShares S&P 500
Low Volatility (SPLV)
AME #314 SPLV from
VIX.cht
36
Chapter 5 Chart Examples
Long & Long
Short
only
Short
only
Annual
Return
22.5% 17.1%
5.4%
% Profitable
Trades
67.6% 74.3%
61.1%
5
Chart Examples
High Beta ETFs
High Beta ETFs target high beta stocks. Higher beta means greater sensitivity to broad
movements in equity markets, meaning that the ETFs are expected to include a
significant shift towards volatile stocks.
PowerShares S&P 500
High Beta (SPHB)
AME #315 SPHB from
VIX.cht
Long & Long
Short
only
Short
only
Annual
Return
83% 35.6%
47.4%
% Profitable
Trades
74.6% 77.1%
72.2%
Volatility ETNs
Exchange-traded notes (ETNs) are debt securities by which the issuer promises to pay
a return based on the index’s performance. They trade throughout the day like a
stock. Today, ETNs have become popular investment tools for investors who are trying
to get exposure to the returns of specific asset classes that could not be set up in an
Exchange Traded Fund (ETF).
VelocityShares Long VIX
ST ETN (VIIX)
AME #316 VIIX from
VIX.cht
VelocityShares Daily 2x
VIX ST ETN (TVIX)
AME #317 TVIX from
VIX.cht
Chapter 5 Chart Examples
Long & Long
Short
only
Short
only
Annual
Return
81.3% 11.7%
69.5%
% Profitable
Trades
63.3% 51.1%
75.6%
Long & Long
Short
only
Short
only
Annual
Return
218.3 50.1%
%
168.2
%
% Profitable
Trades
65.6% 53.3%
77.8%
37
5
Chart Examples
iPath S&P 500 VIX MT
Futures ETN (VXZ)
AME #318 VXZ from
VIX.cht
Long & Long
Short
only
Annual
Return
% Profitable
Trades
UBS E-TRACS 5Mo S&P
500 VIX Futures ETN
(VXEE)
AME #319 VXEE from
VIX.cht
Chapter 5 Chart Examples
7.1%
29.2%
59.7% 53.5%
66%
Long & Long
Short
only
Annual
Return
% Profitable
Trades
38
36.3%
Short
only
65.1% 13.7%
44%
40%
Short
only
51.3%
48%
Chart Examples
5
Timing the S&P 500 index®
The S&P 500 (^GSPC) is an index of 500 leading stocks chosen to reflect the risk/return
characteristics of the large-cap US equities market.
The Rationale
Indexes such as the S&P 500 are groups of similar stocks that represent a particular
segment of the market. The similarities make returns more predictable and stable than
the constituent stocks taken individually,
There are Exchange-Traded Products or ETPs available that track the index well and
that can be traded just like a stock.
The S&P 500 and ETPs are so well correlated that what works on one works on the
other.
The Strategy
Take short-term positions (long/short) in S&P 500 ETPs by timing the S&P 500 index.
Buy/short at the next open when AME applied to ^GSPC crosses above or below the zero
line:
Buy long:
Chapter 5 Chart Examples
39
Chart Examples
5
Sell short:
Note three things:
The Input Series is set to the ^GSPC meaning that the buy/sell signals are obtained
from the S&P 500 index itself as opposed to the instrument being traded.
The Window parameter has been set to 14 during a Calibration step. A description
of this step is given later in this section.
The Negative Flag has to be set to 0 or 1 whether there is positive or negative
correlation between the instrument being traded and the index.
See illustration
Case of a positive correlation: set Negative Flag to 0
Case of a negative correlation: set Negative Flag to 1
40
Chapter 5 Chart Examples
Chart Examples
5
The calibration step
The Window parameter is set during this calibration step.
In the graph above we have assumed we could buy/short ^GSPC index at the next
open when AME crosses above or below the zero line. This strategy would have put
up good numbers: an hypothetical 59.8% profitable trades with less than 1 trade per
week over the entire 5-year test period (see chart "AME #400 Timing the S&P500
index.cht").
See details
The entry rules
Buy long:
Sell short:
Note that the parameters are set to optimize to the same values for both
the long and short rules.
Chapter 5 Chart Examples
41
5
Chart Examples
Paper trading
Five years of data are hold out for testing purpose:
Net Profit is maximized:
Results
The optimized value for the Window parameter can be found in the Trading
Strategy Analysis wizard under the "Trading Rules" tab as shown below:
Zooming in on the buy/sell signals:
Detailed Analysis (averaged out over 5 years out-of-sample):
Long &
Short
42
Long only
Short only
Annual Return
21.8%
11.3%
10.5%
% Profitable Trades
59.8%
66.3%
53.3%
Average Trade Span
8 bars
10 bars
6 bars
Chapter 5 Chart Examples
Chart Examples
5
Maintenance
Maintenance should be minimal. Window = 14 has been a good value since 1992; AME
was able to produce consistent returns over the entire 5-year test period and fared well
during times of real market stress, like 2008. We expect it to continue moving forward.
However it is a good idea to check once in a while how the equity curve behaves.
Ultimately, if it starts leveling out, you will need to recalibrate. Then you will have to
reset the Window to its new value in the trading rules.
See details
You can recalibrate by simply re-optimizing the chart "AME #400 Timing the S&P500
index.cht":
In the next window that opens, click No to start optimizing from the beginning:
Chapter 5 Chart Examples
43
5
Chart Examples
Equity ETFs
An Exchange Traded Fund, also known as an ETF, is a security that tracks an asset
or an index by holding the actual components of the index. One of the most widely
known ETFs tracks the S&P500 index and trades under the symbol SPY. In recent
years, ETFs have grown in popularity. ETFs appeal to investors mostly because they
offer all the diversification of an index fund and can be traded just like a stock
throughout the trading day.
SPDR S&P 500 (SPY)
AME #401 SPY from
^GSPC.cht
Vanguard Extended Market
Index ETF (VXF)
AME #402 VXF from
^GSPC.cht
iShares S&P 500 Index
(IVV)
AME #403 IVV from
^GSPC.cht
44
Chapter 5 Chart Examples
Long &
Short
Long
only
Short
only
Annual Return
16%
8.5%
7.5%
% Profitable
Trades
57.5%
64%
51.1%
Long &
Short
Long
only
Short
only
Annual Return
23.6%
14.6%
9%
% Profitable
Trades
55.9%
59.6%
52.2%
Long &
Short
Long
only
Short
only
Annual Return
14.5%
7.8%
6.7%
% Profitable
Trades
57%
62.9%
61.1%
Getting Help
6
The first place to check if you run into a challenge or question is in this Help file. We have
tried to provide every answer in this pages you will need to operate Noxa-AME.
Displaying the Help
The quickest way to display the Help is to select the indicator and press F1:
You can also have access to the Help from the Indicator Wizard; select the indicator
with the mouse and click on the Help button:
Chapter 6 Getting Help
45
Getting Help
6
Contacting Noxa Support
If you find that you need more help, you can contact Noxa's technical support via email
at: [email protected]
46
Chapter 6 Getting Help
Navigating the Help
7
The method you choose depends on how you prefer getting information. You may feel more
comfortable using the Contents and the Index pages in the Help dialog or Finding pages
yourself.
Contents
The Contents page is organized very similarly to a Table of Contents in a book. But
instead of turning the pages to reach the desired subject, simply double-click on the
topics:
Index
The Index page is used to search for help on a specific topic by typing the first few
letters of the topic you are looking for. For example, suppose you want to find out
how to set a parameter value. If you type the word “parameter” in the edit box, the
index entry list will quickly display the keywords beginning with “parameter”.
Double-click an entry to display the corresponding help page:
Chapter 7 Navigating the Help
47
Navigating the Help
7
Search
The Find page is used to search for every occurrence of a word or phrase within the
help topics. This search is more extensive yet less selective than using the Index
page. For example, suppose you want to find every occurrence of the word “expert”
within the help topics. If you type the word “expert” in the edit box, every help topic
containing the word “expert” will appear in the list, and will be highlighted in the topic:
48
Chapter 7 Navigating the Help
8
Activating Noxa-AME
You must activate Noxa-AME on your computer before using it. Activation is also required
before you swap, change, reformat, or reconfigure your hard drive.
Here is how you do it in three easy steps...
Write down your Purchase Order Number
You can locate this number in the confirmation e-mail that has been sent to you after
you purchased the product. It is an 8-digit number next to the "Order Number" entry
as shown below:
If you are unable to identify this number,
[email protected]
please
contact
Noxa
support
at
Run Noxa-AME Activate.exe
Click the Start Menu icon in the lower left hand corner of your screen. Then click on
the All Programs menu.
In the menu listing that appears, look for the folder named Noxa\Noxa AME. Then click
the Noxa-AME Activate.exe program.
Chapter 8 Activating Noxa-AME
49
Activating Noxa-AME
8
When the activation process begins, Noxa-AME Activate.exe tries to detect an
Internet connection. If one is found, your request will be automatically sent to a
license server. You will be asked to enter the following information:
Your order number,
Your email address:
When finished, you should read the following lines:
" Thank you for registering Noxa-AME.
A License Key will be sent to your email address shortly.
Press Enter to Quit "
50
Chapter 8 Activating Noxa-AME
Activating Noxa-AME
8
Copy the License Key to your System
Check your email; you should have received a confirmation email with the license key
attached,
Detach the NoxaAMELicenseKey.dat file,
Save the file to the C:\NeuroShell Trader 6\Noxa folder.
Congratulations! Your Noxa-AME package is now permanently activated on your
computer.
Any Problem with the Activation?
You get the following error message: "Application failed in sending request (error#
104)!" This issue occurs because Noxa-AME Activate.exe did not find a working
internet connection.
Resolution:
Verify that your Internet connection is functional and try again,
Ultimately you could send us your request by email at [email protected] with
your Activation Request Key attached (NoxaAMEActivationRequest_000xxx.dat).
You can find this file in the C:\NeuroShell Trader 6\Noxa\Noxa AME directory.
Any other problem with the activation process? Contact our Support Team at
[email protected] and we’ll be glad to help you out.
Chapter 8 Activating Noxa-AME
51
How to Buy Noxa-AME
9
You can buy Noxa-AME directly online worldwide with your credit card. As soon as your
transaction is completed you will be able to download and install the add-on right away.
Direct order link
Buy License
52
Chapter 9 How to Buy Noxa-AME
Disclaimer/ License Agreement
10
Disclaimer
This information provided by Noxa Analytics, Inc. is strictly for informational purposes and
is not to be construed as advice or solicitation to buy or sell any security. Noxa
Analytics, Inc. will not be held responsible for any losses accrued as a result of any
content in this file.
License Agreement
This End User License Agreement (the "AGREEMENT") is a legal agreement between you
and Noxa Analytics, Inc. (“Noxa Analytics") regarding your use of Noxa Analytics’
software and service entitled which may include user documentation provided in "online"
or electronic form. BEFORE YOU CLICK ON THE "I AGREE" BUTTON AT THE END OF THIS
DOCUMENT, CAREFULLY READ THE TERMS AND CONDITIONS OF THIS AGREEMENT. BY
CLICKING ON THE "ACCEPT" BUTTON, YOU ARE CONSENTING TO BE BOUND BY AND ARE
BECOMING A PARTY TO THIS AGREEMENT. IF YOU DO NOT AGREE TO ALL OF THE TERMS
OF THIS AGREEMENT, CLICK THE "DO NOT ACCEPT" BUTTON AND THE SOFTWARE WILL
NOT BE DOWNLOADED TO YOUR COMPUTER.
TERMS AND DEFINITIONS
(a) “LICENSEE” is the party (either an individual or an entity) who has purchased the
license rights to use the Developed Program solely for his own personal use. LICENSEE
shall include such affiliates, subsidiaries, divisions and business units that are under
financial and/or managerial control of LICENSEE.
(b) “Virtual Private Server” (VPS, also referred to as Virtual Dedicated Server or VDS) is a
method of dividing underlying hardware server resources into virtual servers, where
resources can be allocated in a way that does not directly reflect the underlying
hardware. Each virtual server can run its own full-fledged operating system, applications
and each virtual server is an independent environment that can be independently
rebooted, stopped, or started.
(c) “Licensed Computer” is the personal computer or Virtual Private Server designated by
LICENSEE to operate the Software licensed to LICENSEE pursuant to the terms of this
Agreement and upon registration of such computer with Noxa Analytics.
(d) “SIGNALS” include any messages, information generated by the Software and
generated for and in conjunction with LICENSEE’s personal and individual use of the
Software.
(e) “SOFTWARE” is Noxa Analytics’ proprietary Adaptive Mixture of Experts (Noxa-AME)
computer software program, including SIGNALS generated by the software and services
provided by Noxa Analytics and update or upgrade of Noxa-AME; the program’s related
Chapter 10 Disclaimer/ License Agreement
53
Disclaimer/ License Agreement
10
materials including user manuals, documentation, and software release notes; and such
updates, modifications or new releases of the software program and documentation as
may be provided by Noxa Analytics to LICENSEE.
LICENSE GRANT AND RESTRICTIONS
(a) Grant of License: During the term of LICENSEE’s subscription license, subject to the
payment of the applicable fees and LICENSEE’s compliance with the terms of this
AGREEMENT, this AGREEMENT permits LICENSEE to use one (1) copy of the specified
version of the SOFTWARE, for internal purposes only, on only one (1) Licensed Computer
or Virtual Private Server, and only by one (1) user, at a time.
(b) Scope of use: LICENSEE must obtain a separate registration and identification for
each Licensed Computer from Noxa Analytics. The SOFTWARE is "in use" on the Licensed
Computer when it is loaded into the temporary memory (i.e. RAM) or Installed Into the
permanent memory (e.g. hard disk, CD-ROM or other storage device) of that Licensed
Computer. We reserve all rights not expressly granted in this AGREEMENT.
(c) Restrictions: You may not rent, lease, or loan the SOFTWARE, but you may transfer
your rights under this AGREEMENT permanently, provided you transfer this AGREEMENT,
the SOFTWARE and all accompanying printed materials, retain no copies, and the
recipient agrees to the terms of this AGREEMENT. LICENSEE is not authorized to modify,
adapt, translate, or create derivative works based upon, in whole or in part the Software
or the SIGNALS it generates, or to reverse compile or disassemble the Software and/or
its SIGNALS. The rights granted LICENSEE hereunder are restricted exclusively to
LICENSEE. All rights not expressly granted to LICENSEE by this Agreement are exclusively
reserved to and by Noxa Analytics.
LICENSEE MAY NOT DISTRIBUTE, CONVEY, SELL, USE OR TRADE ANY SIGNAL OR OTHER
INFORMATION GENERATED BY THE SOFTWARE TO ANY PERSON OR GROUP.
SUCH
PROHIBITED GROUPS INCLUDE, BUT ARE NOT LIMITED TO, ANY POOL, FUND OR INVESTOR
GROUPS, WHICH POOL FUNDS TOGETHER AND PAYS COMMISSIONS OR INCENTIVE FEES
TO LICENSEE.
(d) Use on other computers; Noxa Analytics reserves the right that upon multiple or
repeated requests for re-installation and/or transfer of licenses for any reason, to
withhold registration and license, unless LICENSEE pays a new License Fee or upon
establishing to Noxa Analytics’ satisfaction that LICENSEE is not installing the Software
on more than one (1) personal computer.
(e) Transfer of License Grant: The Software may not be assigned, sub-leased, sublicensed, sold or otherwise transferred, except as provided herein. Upon written consent
from Noxa Analytics, LICENSEE may transfer the license granted herein to another party
and such license shall only become effective upon the party receiving the license
consenting to and assuming, in writing, all terms of this Agreement. LICENSEE must pay
Noxa Analytics a fee for the transfer, and must also remove the Software Program from
the initially Licensed Computer to Noxa Analytics’ satisfaction.
54
Chapter 10 Disclaimer/ License Agreement
Disclaimer/ License Agreement
10
(f) Copyright: The SOFTWARE is owned by Noxa Analytics or its suppliers or licensors
and is protected by United States and Canadian copyright laws and international treaty
provisions. We (and our suppliers) own and retain all right title and interest in and to the
SOFTWARE, including patents, trademarks, copyrights, trade secrets and other
intellectual property rights embodied or contained therein. Therefore, LICENSEE may not
use, copy or distribute the SOFTWARE without authorization. LICENSEE may (a) make
one (1) copy of the SOFTWARE solely for backup or archival purposes, or (b) transfer the
SOFTWARE to a single hard disk provided LICENSEE keeps the original solely for backup or
archival purposes. LICENSEE may not copy the printed materials accompanying the
SOFTWARE, if any, nor print copies of any user documentation provided in "online" or
electronic form.
NO WARRANTIES
THE SOFTWARE IS PROVIDED "AS IS" WITHOUT ANY WARRANTY WHATSOEVER. YOU
ASSUME ALL RISKS AND RESPONSABLITIES FOR SELECTION OF THE SOFTWARE TO
ACHIEVE YOUR INTENDED RESULTS, AND FOR THE INSTALLATION OF, USE OF AND
RESULTS OBTAINED FROM THE SOFTWARE. NOXA ANALYTICS MAKES NO WARRANTY
THAT THE SOFTWARE WILL BE ERROR FREE OR FREE FROM INTERRUPTION OR FAILURE.
TO THE MAXIMUM EXTENT PERMITTED BY APPLICABLE LAW, NOXA ANALYTICS
DISCLAIMS ALL WARRANTIES, EITHER EXPRESS OR IMPLIED, INCLUDING BUT NOT
LIMITED TO IMPLIED WARRANTIES AND CONDITIONS OF MERCHANTABILITY, FITNESS
FOR A PARTICULAR PURPOSE, AND NONINFRINGEMENT WITH RESPECT TO THE
SOFTWARE AND THE ACCOMPANYING WRITTEN MATERIALS. SOME STATES DO NOT
ALLOW LIMITATIONS ON IMPLIED WARRANTIES, SO THE ABOVE LIMITATION MAY NOT
APPLY TO YOU. YOU ACKNOWLEDGE THAT THE SOFTWARE MAY NOT BE OR BECOME
AVAILABE DUE TO ANY NUMBER OF FACTORS INCLUDING WITHOUT LIMITATION PERIODIC
SYSTEM MAINTENANCE, SCHEDULED OR UNSCHEDULED, ACTS OF GOD, TECHNICAL
FAILURE OF
THE SOFTWARE, TELECOMMUNICATIONS INFRA¬STRUCTURE,
OR
DISRUPTION ATTRIBUTABLE TO THE TURN OF THE MILLENIUM. THEREFORE NOXA
ANALYTICS EXPRESSLY DISCLAIMS ANY EXPRESS OR IMPLIED WARRANTY REGARDING
SYSTEM AND/OR SOFTWARE AVAILABILITY, ACCESSABILITY, OR PERFORMANCE.
LIMITED LIABILITY
NO LIABILITY FOR CONSEQUENTIAL DAMAGES. YOU ASSUME THE ENTIRE COST OF ANY
DAMAGE RESULTING FROM YOUR USE OF THE SOFTWARE AND THE INFORMATION
CONTAINED IN OR COMPILED BY THE SOFTWARE. TO THE MAXIMUM EXTENT PERMITTED
BY APPLICABLE LAW, IN NO EVENT WILL NOXA ANALYTICS OR ITS SUPPLIERS OR
LICENSORS BE LIABLE FOR ANY DAMAGES WHATSOEVER (INCLUDING, WITHOUT
LIMITATION, DAMAGES FOR LOSS OF BUSINESS PROFITS, BUSINESS INTERRUPTION,
LOSS OF BUSINESS INFORMATION, LOSS OF GOODWILL; WORK STOPPAGE; HARDWARE
OR SOFTWARE FAILURE, OR OTHER PECUNIARY LOSS) ARISING OUT OF THE USE OR
INABILITY TO USE THE SOFTWARE, EVEN IF SUCH PARTY HAS BEEN ADVISED OF THE
POSSIBILITY OF SUCH DAMAGES. IN NO EVENT WILL NOXA ANALYTICS' TOTAL LIABILITY
TO YOU FOR ALL DAMAGES IN ANY ONE OR MORE CAUSE OF ACTION, WHETHER IN
CONTRACT, TORT OR OTHERWISE. EXCEED THE AMOUNT PAID BY YOU FOR THE
SOFTWARE. BECAUSE SOME STATES DO NOT ALLOW THE EXCLUSION OR LIMITATION OF
LIABILITY FOR CONSEQUENTIAL OR INCIDENTAL DAMAGES, THE ABOVE LIMITATION MAY
Chapter 10 Disclaimer/ License Agreement
55
Disclaimer/ License Agreement
10
NOT APPLY TO YOU.
GENERAL
This AGREEMENT is governed by the laws of the Province of Ontario, without reference
to conflict of laws principles. The application of the United Nations Convention of
Contracts for the International Sale of Goods is expressly excluded. This AGREEMENT
shall not be subject to the Uniform Commercial Code. Any dispute between you and Noxa
Analytics regarding this AGREEMENT will be subject to the exclusive venue of the
provincial courts of Ontario, Canada. This AGREEMENT is the entire agreement between
you and Noxa Analytics and supersedes any other communications or advertising with
respect to the SOFTWARE and documentation. If any provision of this AGREEMENT is held
invalid, the remainder of this AGREEMENT will continue in full force and effect No
provision of this AGREEMENT shall be deemed waived or modified except in a written
addendum signed by an authorized representative of Noxa Analytics.
Contact Information
Should you have any questions concerning this AGREEMENT, or if you desire to contact
Noxa Analytics for any reason, please call (613) 599-7844, or write: Noxa Analytics, Inc.,
75 Spruce Meadows Drive, Kanata, Ontario K2M2K4.
Noxa Analytics, Inc.
75 Spruce Meadows Dr.
Kanata, K2M2K4 Ontario
Canada
Technical support for this product is available through email at:
[email protected]
Suggestions for product improvements can be emailed to the same address.
Visit us on the World Wide Web at:
www.noxapredict.com
56
Chapter 10 Disclaimer/ License Agreement
© © <2012> <Noxa Analytics, Inc.>.
All rights reserved.
Product and company names mentioned in this
manual may be trademarks or registered
trademarks of their respective companies.
Mention of third-party products is for
informational purposes only and constitutes
neither an endorsement nor a recommendation.
The author assumes no responsibility w ith
regard to the performance or use of these
products. All understandings, agreements, or
w arranties, if any, take place directly betw een
the vendors and the prospective users. Every
effort has been made to ensure that the
information in this manual is accurate. The author
is not responsible for printing or clerical errors.
The product described in this manual
incorporates copyright protection technology that
is protected by
method claims of certain U.S. patents and other
intellectual property rights.
This user manual w as created w ith Help &
Manual.
Index
Index
E
Expert Algorithms
58
4