1
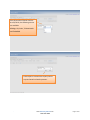
SCANalytics
SCANalytics: Manual v2.0
Table of Contents
Investments (Step 1 of 5)
Adding/Finding Assets by Name or Ticker ......................................................................................................................................................... page 4
Asset List ...................................................................................................................................................................................................... pages 5-6
Screening for Assets ................................................................................................................................................................................... pages 6-14
Copy ................................................................................................................................................................................................................ page 14
Combine ................................................................................................................................................................................................... pages 15-17
Excel Import ............................................................................................................................................................................................. pages 18-19
Allocation (Step 2 of 5)
Hypothetical Type: Individual or Portfolio ....................................................................................................................................................... page 20
Value: Type: Dollar, Share or Percentage ........................................................................................................................................................ page 20
Distribution Reinvestment, Performance Horizon and Rebalancing ........................................................................................................ pages 20-23
Fees (Step 3 of 5)
Asset Based and Sales Charges ...................................................................................................................................................................... pages 24
Global Settings ......................................................................................................................................................................................... pages 25-26
Family Discounts and Breakpoints................................................................................................................................................................... page 26
Cash Flows (Step 4 of 5)
Entry and Description ................................................................................................................................................................................ page 27-29
Reports (Step 5 of 5)
Clients and Taxes ...................................................................................................................................................................................... pages 30-31
Hypothetical Parameters................................................................................................................................................................................. page 33
Blended Benchmarks ................................................................................................................................................................................ pages 34-35
HoldingScan Parameters ................................................................................................................................................................................. page 36
CompariScan Proposal Parameters .......................................................................................................................................................... pages 37-39
Detailed Analytics Parameters ................................................................................................................................................................. pages 40-48
Detailed Analytics Returns Based Style Analysis .............................................................................................................................................. page 45
Detailed Analytics Monte Carlo Simulation .............................................................................................................................................. pages 45-46
Detailed Analytics Correlation .................................................................................................................................................................. pages 47-48
Fact Sheet Parameters .............................................................................................................................................................................. page 49-50
Model Performance ................................................................................................................................................................................. pages 50-54
Cover Page Parameters ............................................................................................................................................................................ pages 55-56
Model Dashboard
Select, View, Edit and Analyze a Model .................................................................................................................................................... pages 57-59
Model Properties, Performance Import and 3rd Party Integration ........................................................................................................... pages 60-61
Optimize Portfolio .................................................................................................................................................................................... pages 62-66
3rd Party Import (Client, Account and Positions)
Source Selection .............................................................................................................................................................................................. page 67
Client and Account Selection ........................................................................................................................................................................... page 68
Security Mapping ..................................................................................................................................................................................... pages 69-71
User Defined Assets and Folders
Add/Edit Folders.............................................................................................................................................................................................. page 72
Add/Edit Assets ........................................................................................................................................................................................ pages 73-77
Import Asset Performance ....................................................................................................................................................................... pages 74-76
Import Asset Company Fact Sheets ................................................................................................................................................................. page 76
My Info
Personal Settings and Branding ................................................................................................................................................................ pages 78-79
System Settings
Internet Explorer Settings ........................................................................................................................................................................ pages 80-85
Adobe Reader Settings ............................................................................................................................................................................. pages 86-87
SCANalytics Manual v2.0
www.AdvisoryWorld.com
1-800-480-3888
Page 2 of 87
The Hypothetical List page is the “Home
Page” of the Application.
Create a New Hypothetical by Pressing
“New Hypothetical”
Step 1. Investments
Select the Investments that you’d like to Analyze.
You may choose to Select these Investments by
Entering their Tickers or Names, Finding them in a
List or by Importing them from Excel.
SCANalytics Manual v2.0
www.AdvisoryWorld.com
1-800-480-3888
Page 3 of 87
Enter Multiple Tickers and/or Names separated by commas
then Press Find: (e.g. PTTRX,AAPL,SPY)
Review the resulting this and Select which of the Investments
that you’d like to include in your analysis then press Add.
SCANalytics Manual v2.0
www.AdvisoryWorld.com
1-800-480-3888
Page 4 of 87
Notice that Assets have been
Selected. You may remove
any of them by Clicking on
Delete.
Enter a Name for this Analysis (e.g. “Sample Analysis” then
press Next. Press Cancel to return to the Hypothetical List
page without saving any changes.
Press Asset List to Search and
Select Assets from Folders.
The Folders you see depend on
your entitlements.
Click on a Plus Sign to expand a
Folder and a Minus Sign to
contract a folder.
SCANalytics Manual v2.0
Asset Classes (Indices) and Stocks are placed in folders based on
their names (e.g. S&P 500 is under the “S” folders).
Closed End Funds, Mutual Funds and ETFs are placed in folders
based on their Management Company’s names (e.g. iShares
Barc 1-3 Trs Bd is under the Barclay’s Global Fund Advisors
folder which is under the “B” folder).
Variable Annuity Sub-accounts are placed in folders based on
www.AdvisoryWorld.com
1-800-480-3888
Page 5 of 87
Click on an Asset Name then
Press Add to Choose and
Asset.
Begin and End Dates refer to the
historical time horizon available for
hypothetical analysis of the given
assets. Closed End Funds, Mutual
Funds, ETFs and Stocks are updated
daily, Variable Annuity Sub-accounts
are updated weekly and Asset Classes
(indices) are updated monthly.
Click on a Chosen Asset Name
then Press Remove to Remove
an asset.
Press Save to Save your Asset
List and Close the Screen,
press Cancel to close the
screen without saving changes.
Click Screener to find assets based on
Criteria
Press Add Criteria then select a Criteria
Category and a Criteria (e.g. Basic
Information - Asset Type)
SCANalytics Manual v2.0
www.AdvisoryWorld.com
1-800-480-3888
Page 6 of 87
Press Add Criteria then
click on the Criteria
you’d like to Filter by.
After adding criteria, click to edit specific criteria where such links are present
Select value(s) by clicking on the available value then pressing the arrow to the right.
Remove a selected value by clicking on it then press the arrow to the left.
Press Save to save the value9s0 and press Cancel to close the window without saving.
SCANalytics Manual v2.0
www.AdvisoryWorld.com
1-800-480-3888
Page 7 of 87
Certain fields such as Inception required date entry. Either enter the date in a
mm/dd/yyyy format or select the date from the picker.
Certain criteria include operators such as <, < =, >, > =, =, on, on or after, on or
before. Select the operator by clicking in the given cell.
Enter Criteria values in the appropriate cell.
SCANalytics Manual v2.0
www.AdvisoryWorld.com
1-800-480-3888
Page 8 of 87
After entering all Criteria press Apply Criteria to filter
and return Results.
Press Load Criteria to load previously Saved Criteria.
Press Save Criteria to Save Criteria.
Press Save Criteria to save screening criteria
for future use. Enter a name the press Save to
save the criteria or Cancel to close the form
without saving.
SCANalytics Manual v2.0
www.AdvisoryWorld.com
1-800-480-3888
Page 9 of 87
Press Load Criteria to load previously saved criteria.
Select the criteria then press Load to load the criteria or
press Cancel to the close the form without loading
criteria.
SCANalytics Manual v2.0
www.AdvisoryWorld.com
1-800-480-3888
Page 10 of 87
The Screening Results will display all of the Criteria and the name and
ticker of the asset.
Sort any column by clicking on its column header (e.g. 3 Year Alpha)
Select and or all assets and:
Press Add to Hypo to add the assets to the analysis
Press Remove from List to remove the assets from the Screening Results
Press Save List to Save the Screening Results
Press Export to Save the resulting list in an Excel File
SCANalytics Manual v2.0
www.AdvisoryWorld.com
1-800-480-3888
Page 11 of 87
Press Load List to load previously saved asset result list.
Select the list then press Load to load the list or press
Cancel to the close the form without loading list.
Press Save List to save the asset result list for
future use. Enter a name the press Save to
save the list or Cancel to close the form
without saving.
SCANalytics Manual v2.0
www.AdvisoryWorld.com
1-800-480-3888
Page 12 of 87
Press Export to Save the asset
result list in Excel format.
Choose Open or Save depending on
your preference then Press OK
SCANalytics Manual v2.0
www.AdvisoryWorld.com
1-800-480-3888
Page 13 of 87
Notice the resulting list.
Press Copy Existing to add all
aspects of an existing analysis
including assets and their
weightings to a new
Hypothetical.
Select 1 Hypothetical then
press Copy to Save Changes
and close the screen or press
Cancel to close the screen
without saving changes.
SCANalytics Manual v2.0
www.AdvisoryWorld.com
1-800-480-3888
Page 14 of 87
Press Combine to aggregate
multiple Portfolios, Models
and/or Assets
SCANalytics Manual v2.0
www.AdvisoryWorld.com
1-800-480-3888
Page 15 of 87
Select the Portfolios, Models
and/or Assets that you'd like
to Combine then Press Next
SCANalytics Manual v2.0
www.AdvisoryWorld.com
1-800-480-3888
Page 16 of 87
By Default the 100% allocation is set for each of the selected Portfolios, Models and/or Assets.
Modify the default percentage if you'd like to distribute the allocation(s) differently than as set in
the original instances of the various Portfolios or Models.
For example, if you'd like to set 90% in Model 1 and 10% in Model 2, then enter 90% and 10%
respectively. Assets by default will take on a $10,000.00 value but can be set as a proportional
weight combined with Models or Portfolios with percentage allocations (e.g. 90% Model 1 and
10% Asset ABC).
After specifying the Percentage Allocation, press Ok or Cancel.
SCANalytics Manual v2.0
www.AdvisoryWorld.com
1-800-480-3888
Page 17 of 87
Press Import to import Assets
and their Weightings from an
Excel CSV file.
Click Download Template to
access the specially formatted
CSV file template.
IF IMPORTING FRM EXCEL YOU MUST
USE THIS TEMPLATE.
Choose Save File and Press OK
SCANalytics Manual v2.0
www.AdvisoryWorld.com
1-800-480-3888
Page 18 of 87
Enter TICKER(s) of Mutual Funds, Stocks, ETFs or Closed End Funds in Column A
Enter the corresponding, beginning number of SHARES allocated to each investment in
Column B and/or the corresponding, beginning VALUE allocated to each investment in Column
C and/or the corresponding, beginning PERCENTAGE in Column D. If you enter a Percentage
Allocation make sure that the values add up to 100%.
The Header row for Columns A, B, C and D must be present in the file in order for it to be
imported.
After filling in the appropriate columns, press Save.
SCANalytics Manual v2.0
www.AdvisoryWorld.com
1-800-480-3888
Page 19 of 87
Step 2. Allocation
Select a Hypothetical Type
Individual Investment(s): Analyze a Hypothetical of each investment(s) individually
Portfolio of Investments: Analyze a Hypothetical of a portfolio investments
Option available only for Hypothetical(s) consisting of 2 or more selected assets
Select Value Type either by Dollar or Share Value or As a Percentage of a Portfolio.
For Imported Values to display, Select By Dollar, Share or Percentage Value then select the appropriate Value Type.
Enter Values for each Investment.
Sort columns by clicking on their Header (e.g. Value)
Select whether or not to Reinvest Dividends and/or Capital Gains
Checking either column Assumes Reinvestment
Check and/or Uncheck all by Clicking on the Right Side of the Column Header
SCANalytics Manual v2.0
www.AdvisoryWorld.com
1-800-480-3888
Page 20 of 87
2.5 Time Horizon
Select a Standard Time Horizon or a Custom Horizon
To enter a custom horizon, choose Custom
then Press Edit
SCANalytics Manual v2.0
www.AdvisoryWorld.com
1-800-480-3888
Page 21 of 87
Notice that you can specify any Time
Horizon for any asset. Choose Custom to
Enter a Custom period.
After entering Custom Start and End Dates
for 1 asset you may click the Star to the
right of the asset to apply the same period
to all of the assets. Once complete, press
Save.
SCANalytics Manual v2.0
www.AdvisoryWorld.com
1-800-480-3888
Page 22 of 87
Users may rebalance Portfolios as long as
each of the assets shares a performance
horizon, standard or custom.
After completing Step 2 press Next to move
onto Step 3, Cancel to return to the list or
Back to return to Step 1.
SCANalytics Manual v2.0
www.AdvisoryWorld.com
1-800-480-3888
Page 23 of 87
Step 3. Fees
Asset Based Fees are fees payable based on Assets Under Management.
By Default, Apply Advisory Fees (as setup under My Info) is selected with a Quarterly, Fee
Frequency and a Payment Source of Out of Pocket. If applicable, deselect Apply Advisory Fees,
select an alternative Frequency and/or select a Sale of Shares as the Payment Source.
Adding Wrap-Fees (optional) will automatically deselect Apply Advisory Fees, Front End and
Apply Redemption/CDSC.
View Standard Front End Load or Redemption/CDSC schedule by clicking on the View icon for the
given investment.
The Custom Front End Load text box is only activated when selecting Custom as a Front End Load
type
Select whether or not to apply Standard Redemption/CDSC charges for a given investment.
If applicable, select a Transaction
Fee Type of $ Per Trade or $ Per
Share and enter the respective Fee
Value.
Press Next to Save and Continue to
Step 4 or Press Back to Save and go
back to Step 2.
SCANalytics Manual v2.0
www.AdvisoryWorld.com
1-800-480-3888
Page 24 of 87
Press Apply Global Settings to access, view and edit global fee settings.
Enter specific values then press Apply to update the Hypothetical or Cancel to close
without changes.
Access previously saved settings by pressing Load Saved Settings. Save Settings by
pressing Save Settings As.
Press Save Setting As , enter a Name then Press Save to save changes or Cancel to
close the screen without saving.
SCANalytics Manual v2.0
www.AdvisoryWorld.com
1-800-480-3888
Page 25 of 87
Modifying Household Discounts will affect Front End Load breakpoints.
Press Adjust Household Discounts to apply Household Discounts to the
Hypothetical. Choose a Fund Family, enter a description (e.g. Some
401k), enter a value and a historical average Annual Growth Rate and
then press Save to update the hypothetical or Cancel to close without
saving any changes.
SCANalytics Manual v2.0
www.AdvisoryWorld.com
1-800-480-3888
Page 26 of 87
Step 4. Cash Flows
Press Add New Cash Flow to enter a
historical Cash Flow.
Enter a Description for the Cash Flow
Select a Cash Flow Type
$ Contribution: Dollar amount added to an investment or distributed to a
portfolio of investments
Share Contribution: Purchase shares of an investment
Gross $ Withdrawal: Dollar amount withdrawn from an investment or
distributed from a portfolio of investments Not including all non-reinvested
income and capital gain distributions
e.g. Gross $ Withdrawal = $500/month, Income and Capital Gains are not
Reinvested and Income + Capital Gains during the month = $125… $500 is
withdrawn from the Hypothetical (total income for the month=$625).
Net $ Withdrawal: Dollar amount withdrawn from an investment or a
portfolio of investments
Including all non-reinvested income and capital gain distributions
e.g. Gross $ Withdrawal = $500/month, Income and Capital Gains are not
Reinvested and Income + Capital Gains during the month = $125… $375 is
withdrawn from the Hypothetical (total income for the month=$500).
% Withdrawal: Percentage of assets withdrawn from an investment or a
portfolio of investments
Share Withdrawal: Sell shares of an investment
SCANalytics Manual v2.0
www.AdvisoryWorld.com
1-800-480-3888
Page 27 of 87
Enter a Value of the Cash Flow
Choose a Source of the Cash Flow
Portfolio Evenly Split: Evenly split the Cash Flow to or from the
Portfolio on an evenly weighted basis
e.g. 2 investments in a portfolio 50% to or from each
Does not display for Share Contribution or Share Withdrawal Cash
Flow Type(s)
Portfolio Pro-Rata Split: Split the Cash Flow to or from the Portfolio
based on the weights specified in Step 2. Allocation.
e.g. Step 2. Allocation investments split 60%:40%, Cash Flow applied
to or from each using the same weighting
If Dollar Value or Share Value entered in Step 2 then the ratio will be
calculated by the application according to the weightings of the
assets in their first common start date.
Investment Ticker: Apply the Cash Flow to or from the investment
Select the Frequency of the Cash Flow
SCANalytics Manual v2.0
www.AdvisoryWorld.com
1-800-480-3888
Page 28 of 87
Either manually enter the Begin Date and End Date for the Cash Flow or
select it from the Calendar.
Date must be in the mm/dd/yyyy format.
End Date must be after the Begin Date
Select whether or not to Apply Inflation
Historical CPI applies actual, historical inflation figures as provided by the United States
Department of Labor Statistics Bureau.
The Inflation Rate text box is only activated when Custom Inflation is Applied.
Delete a Cash Flow row by clicking the Delete hyperlink
Press Next to Save and Continue to Step 5 or Press Back to Save and go back to Step 3.
SCANalytics Manual v2.0
www.AdvisoryWorld.com
1-800-480-3888
Page 29 of 87
Step 5. Reports
Build a generic hypothetical by leaving the drop-down blank or select a
client name from the drop-down.
Press New Client to add a new client.
Enter a Name and Filing Status
SCANalytics Manual v2.0
www.AdvisoryWorld.com
1-800-480-3888
Page 30 of 87
After entering Taxable Income and a State of Residence, Tax Rates will be prepopulated based on Federal and State Tax Tables.
Make any changes to these default rates then press Save to save the new client or
Cancel to close without saving.
After Selecting a Client/Prospect, choose to Apply Tax Rates
Choose the Account Type1
Non-Qualified: All realized gains and distributions taxed as income and/or capital gains depending on
purchase date
FIFO assumption
Qualified: All withdrawals taxed as income
SCANalytics Manual v2.0
www.AdvisoryWorld.com
1-800-480-3888
Page 31 of 87
Select the reports that you'd like to Build
Hypothetical Performance: Displays historical hypothetical performance of the Investment or
Portfolio of Investments including annual and cumulative metrics plus principal, capital gain and
income accumulation.
Investment Reports: Include Standard & Poor’s investment fact sheets for each of the investments in
the hypothetical.
HoldingScan: Displays asset allocation, performance, risk vs. return, aggregate/average expense,
equity and bond metrics and underlying sector, country on holding allocations.
CompariScan: Compare 2 portfolios, models or investments side-by-side with quantitative analysis
covering all of the same items as the HoldingScan.
Detailed Analytics: Investment performance vs. peer groups, year over year performance, detailed
MPT Statistical Analysis, Returns Based Style Analysis and Monte Carlo simulation.
Fact Sheets: 1 Page Portfolio and/or Investment Fact Sheets covering performance and holding
information along with fee and management information.
Allocation Report: Landscape Orientation. Displays large format asset allocation, performance, risk
vs. return, aggregate/average expense, equity and bond metrics and underlying sector, country on
holding allocations.
Company Fact Sheets: Include company provided PDF investment fact sheets for each of the
investments in the hypothetical.
Cover Page: Add a cover page to the report
SCANalytics Manual v2.0
www.AdvisoryWorld.com
1-800-480-3888
Page 32 of 87
Clicking on Parameters next to the Hypothetical Performance report opens the Hypothetical
parameters form.
Display Investment(s) Individually: If a Portfolio of Investments is selected, the investments within the
Hypothetical may be analyzed as well as the portfolio. Click the Hyperlink to select which
Investment(s) to analyze.
Compare Investments Individually: Display performance of the investments in an aggregate graph as
well as displaying the investments individually.
Investment/Portfolio by Asset Class: Compare the Investment or Portfolio of Investments to the Asset
Class or Blend of Asset Classes.
e.g. Portfolio of Investments consisting of 50% Investment A (whose asset class is Large Cap Growth) and 50% Investment B (whose asset
class is Municipal Bonds), Portfolio by Asset Class is 50% Russell 1000 Growth and 50% Barclays Municipal Bond Index.
S&P 500: Compare the Hypothetical to the S&P 500
Select Benchmarks: Click Hyperlink and choose from a series of commonly used Benchmarks or
Blended Benchmarks
Select Comparative Hypotheticals: Click Hyperlink and choose from any of your previously Saved
hypothetical illustrations.
Selecting Apply CF applies the same Cash Flows of the primary hypothetical to the comparison
benchmarks or hypotheticals.
SCANalytics Manual v2.0
www.AdvisoryWorld.com
1-800-480-3888
Page 33 of 87
After selecting and clicking on
Display Investment(s) Individually,
choose which investments to
include in the analysis then press
Save to save changes or Cancel to
close the window without saving.
After selecting and Select
Benchmarks, choose which
benchmarks to include in the
analysis then press Save to save
changes or Cancel to close the
window without saving. You may
also create New Blended
Benchmarks by pressing the
appropriately titled button.
SCANalytics Manual v2.0
www.AdvisoryWorld.com
1-800-480-3888
Page 34 of 87
Enter a name for the Blended
Benchmark then enter percentage
values to each of the various
benchmarks summing to 100%.
Press Save to save changes or
Cancel to close the window without
saving.
After selecting and clicking on Select
Comparative Hypotheticals, choose
which Hypothetical to include in the
analysis then press Save to save
changes or Cancel to close the
window without saving.
SCANalytics Manual v2.0
www.AdvisoryWorld.com
1-800-480-3888
Page 35 of 87
Clicking on Parameters next to the HoldingScan report opens the HoldingScan parameters form.
By Default the Weighted Asset Class Benchmark is used for comparative purposes (i.e. historical
performance, risk return matrix and MPT statistics). Choose any other Benchmark or a Blended
Benchmark for comparative purposes then press Save to save changes or Cancel to close the window
without saving. You may also create New Blended Benchmarks by pressing the appropriately titled
button.
SCANalytics Manual v2.0
www.AdvisoryWorld.com
1-800-480-3888
Page 36 of 87
Clicking on Parameters next to the CompariScan report opens the CompariScan parameters form.
To Display the Name of the Hypothetical in the report check Display Name, otherwise only the Status
will display.
Choose a Status for the primary hypothetical (e.g. Current). This Status will display on the report.
Choose to display Benchmark performance (i.e. on line graphs and scatter graphs).
SCANalytics Manual v2.0
www.AdvisoryWorld.com
1-800-480-3888
Page 37 of 87
Click Select from List to choose a comparative hypothetical.
You may select:
a model (if provided)
a previously saved Portfolio
-orany Investment (find investments by pressing Search and entering a
name or ticker) or by using the List option.
After selecting the comparison hypothetical press OK to save changes
or Cancel to close the window without saving.
SCANalytics Manual v2.0
www.AdvisoryWorld.com
1-800-480-3888
Page 38 of 87
Click Select Benchmark to choose the benchmark for the given
hypothetical.
By Default the Weighted Asset Class Benchmark is used for
comparative purposes (i.e. historical performance, risk return matrix
and MPT statistics). Choose any other Benchmark or a Blended
Benchmark for comparative purposes then press Save to save
changes or Cancel to close the window without saving. You may also
create New Blended Benchmarks by pressing the appropriately titled
button.
To Display the Name of the Hypothetical in the report check Display Name, otherwise only the
Status will display.
Choose a Status for the primary hypothetical (e.g. Model). This Status will display on the report.
Choose to display Benchmark performance (i.e. on line graphs and scatter graphs).
Click Select Benchmark to choose the benchmark for the given hypothetical (note that if you
choose Display and Use the same benchmark for both hypotheticals, the lines and markers will
overlap one another).
SCANalytics Manual v2.0
www.AdvisoryWorld.com
1-800-480-3888
Page 39 of 87
Clicking on Parameters next to the Detailed Analytics report opens the Detailed Analytics
parameters form.
To Display the Name of the Hypothetical in the report check Display Name, otherwise only the
Status will display.
Choose a Status for the primary hypothetical (e.g. Current). This Status will display on the report.
Click Select Benchmark to choose a benchmark for comparative performance purposes (i.e. on
line graphs and scatter graphs). By Default the Weighted Asset Class Benchmark will be used.
Select Comparison Portfolios using the same methods as described in the CompariScan
parameters section found on page 39 of this manual.
SCANalytics Manual v2.0
www.AdvisoryWorld.com
1-800-480-3888
Page 40 of 87
The Investment Performance table by default displays Trailing Returns, Standard Deviation and
Alpha of Investments, the Portfolio(s) and their respective benchmarks.
Deselect Display Section to hide the Investment Performance table.
Hide any of the sections for the Investments or Benchmarks by deselecting the option.
Use Common Start and End Date is selected by default. By deselecting either of these options
each investment's time horizon will be independent of the other assets in the portfolio.
Display alternative columns in the investment performance table by clicking Custom Table Fields.
Clicking on Custom Table Fields popsup the Custom Table Fields
Parameters form. Select up to 13
custom fields (i.e. columns in the
table) then press OK to save your
changes or Cancel to close the form
without saving.
SCANalytics Manual v2.0
www.AdvisoryWorld.com
1-800-480-3888
Page 41 of 87
Select or Deselect
Display Section to
hide/show the
Trailing Performance
Graph and Table.
Select or Deselect to
show or hide the
Primary Benchmark
for comparison
purposes.
Add Additional
Benchmarks by
selecting the option
and clicking
Select/Edit.
Select or Deselect Display Section to hide/show the Risk Analysis Graphs and Tables.
Select or Deselect Risk vs. Return Matrix to hide/show the scatter graph. Choose a Time
Horizon for return and standard deviation display in the XY Scatter graph (default Entire Time
Horizon since common inception).
Add Additional Benchmarks by selecting the option and clicking Select Benchmarks.
Select or Deselect Advanced MPT Graph to hide/show the dual-axis line graph.
Choose a rolling 1, 3 or 5 year Time Horizon for the MPT Statistics. Select one or
more MPT statistics.
Note: Alpha is plotted on the left Y-axis whereas Beta, R2 and Sharpe Ratio are
plotted on the right Y-axis.
SCANalytics Manual v2.0
www.AdvisoryWorld.com
1-800-480-3888
Page 42 of 87
Select or Deselect Risk Analysis Report to hide/show the Risk Analysis Report’s Tables and Graphics.
Optionally choose to display the Modern Portfolio Analysis Table.
An Inflation Rate % and a Min. Purchase Power Loss % may be specified; these entries affect calculations
in the Modern Portfolio Analysis Table. In addition, the Confidence Level (90%, 95% or 99%) and the
Period affect the Minimum and Maximum Boundary of Returns. i.e. The higher the Confidence Interval
the wider the range of returns from Minimum to Maximum.
Choose to display Normal Distribution of Returns Graphic (bell curve) along with its Confidence Interval.
Hypothetical Performance Graph Risk vs. Return Matrix and a Statistics Table are also optional.
SCANalytics Manual v2.0
www.AdvisoryWorld.com
1-800-480-3888
Page 43 of 87
Select or Deselect Display Section to hide/show the
Allocation Graphs and Tables.
Select or deselect any component to hide/show the
given component (e.g. Asset Pie Chart).
Choose to display Asset Classes, Investments,
Categories or Subcategories by selecting the respective
option in the Asset Pie Chart drop-down.
Select or Deselect Display Section to hide/show the
Style Analysis graph and table.
Click Select/Edit Style benchmarks to choose
benchmarks for style regression.
Choose a Rolling Observation period for Style Analysis
(3 Year Rolling Observation Period default and
suggested).
SCANalytics Manual v2.0
www.AdvisoryWorld.com
1-800-480-3888
Page 44 of 87
Clicking on Select/Edit Style benchmarks pops-up the Select/Edit Style
benchmarks Parameters form. Select up to 12 benchmarks then press Save to
save your changes or Cancel to close the form without saving.
Select or Deselect Display Section to hide/show the Monte Carlo simulation
graphs and tables.
Enter a Beginning Value and the End Date for the analysis.
Click Return and Cash Flow Assumptions to view and edit Performance
information and Goals.
SCANalytics Manual v2.0
www.AdvisoryWorld.com
1-800-480-3888
Page 45 of 87
Clicking on Return and Cash Flow Assumptions pops-up the Return and Cash
Flow Assumptions form.
Choose the time horizon for an Average Rate of Return and Standard Deviation
(default Entire Time Horizon since inception).
Select Custom to enter a user defined estimated return (i.e. CAPM).
Press Add New Cash Flow to add forward looking contributions or withdrawals
(i.e. goals).
Enter a Description, choose a Type, enter a Value, choose a Frequency, enter
Begin and End Dates and choose whether or not to apply inflation.
Note that by choosing Simulated inflation, historical performance of the CPI is
used to determine probable forward-looking inflation.
See Cash Flows for more detail on entry of cash flows.
SCANalytics Manual v2.0
www.AdvisoryWorld.com
1-800-480-3888
Page 46 of 87
Press Correlation Report to generate
a Correlation Analysis report for the
given portfolio.
Choose a Calculation Period for the analysis and
specify whether you’d like to include Portfolio Assets
and/or Asset Classes in the report (e.g. ABC Large
Cap Growth and/or Lipper Large Cap Growth Index).
Additionally you may add Benchmarks (e.g. S&P 500
Reinvested) and/or other Hypotheticals/Models.
When finished, press Build.
SCANalytics Manual v2.0
www.AdvisoryWorld.com
1-800-480-3888
Page 47 of 87
Press OK.
Notice the Resulting Report is generated
in Excel Format.
SCANalytics Manual v2.0
www.AdvisoryWorld.com
1-800-480-3888
Page 48 of 87
Clicking on Parameters next to the Fact Sheets report opens the Fact
Sheets parameters form.
Choose the portfolio (if applicable) and any or all assets for analysis.
Click the DOWN ARROW to
Select or Deselect All.
SCANalytics Manual v2.0
www.AdvisoryWorld.com
1-800-480-3888
Page 49 of 87
Select/Edit under
the Benchmark
header to choose
an alternative
benchmark (than
the default
classification).
If you are entitled, Click on Performance Settings to select a Model Asset
for Performance purposes. For example, if provided and applicable
users may display actual model performance vs. or rather than
Hypothetical performance.
Note that in this instance the asset allocation, equity and fixed income
metrics and various other "drill-down" analysis will be based on the
model allocation rather than the Model Asset.
SCANalytics Manual v2.0
www.AdvisoryWorld.com
1-800-480-3888
Page 50 of 87
Click Select/Edit
SCANalytics Manual v2.0
www.AdvisoryWorld.com
1-800-480-3888
Page 51 of 87
Select the Model Asset either by choosing
from the Asset tree or by searching by
ticker or name.
SCANalytics Manual v2.0
www.AdvisoryWorld.com
1-800-480-3888
Page 52 of 87
Specify the Weight to be allocated to the
given Asset then press OK
SCANalytics Manual v2.0
www.AdvisoryWorld.com
1-800-480-3888
Page 53 of 87
Select to display Hypothetical and/or
Model Performance
Enter a Model Fee if Applicable
Choose a Model Fee Frequency
Press OK
Notice that Model Performance (i.e.
actual) is displayed in addition to or in
place of Hypothetical Performance.
SCANalytics Manual v2.0
www.AdvisoryWorld.com
1-800-480-3888
Page 54 of 87
Clicking on Parameters next to the Cover Page opens the Cover Page parameters form.
Report Title: Enter a Report Title or use the Default naming conventions (e.g. Hypothetical Illustration
with Portfolio Report)
Display Date: Include a date on the Cover Page
Display Page Numbers Report: Include Page Numbers throughout the Report
Investment Reports do not include sequential page numbers
Display Advisor Name Report: Include the advisors name on the Cover Page
Display Advisor Logo Report: Include the advisors logo on the Cover Page
Press Change Logo to upload a JPEG or GIF logo
SCANalytics Manual v2.0
www.AdvisoryWorld.com
1-800-480-3888
Page 55 of 87
Click on the Browse button to select
a logo on your local machine or
network then press Upload.
Notice that the logo must be in
JPEG or GIF format.
The Save Confirmation window
displays when leaving a particular
Hypothetical form. Choose Yes to
Save changes, No to leave the page
without saving changes, Cancel to
remain on the page and Save As to
save the hypothetical as new.
SCANalytics Manual v2.0
www.AdvisoryWorld.com
1-800-480-3888
Page 56 of 87
Click on Model Dashboard then choose an Objective
Model Objectives are firm specific and may vary depending on
your firm affiliation.
Choose the Custodian with whom the model can be held..
Model Custodians are firm specific and may vary depencing on
your firm affiliation.
Note that the investments which may be held in models may
be limited based on the specified custodian.
SCANalytics Manual v2.0
www.AdvisoryWorld.com
1-800-480-3888
Page 57 of 87
Choose an appropriate model then press
Load/Restore Model.
Notice that the model allocation
including Categories such as Equities,
Subcategories such as General Equity
and assets such as the S&P 500 SPDR
ETF are displayed.
Press Search to search for additional
assets by name or ticker.
Press List to search for additional
assets by tree.
Press Screener to search for additional
assets by filtering based on criteria.
Press import to import an Excel CSV
file containing assets and their
weightings.
Press Opimize to build an efficient
frontier for the given assets.
Click Delete to remove any Category
along with its Subcategory(s) and
Asset(s), any Subcategory(s) and
Asset(s) or any Asset(s)
SCANalytics Manual v2.0
www.AdvisoryWorld.com
1-800-480-3888
Page 58 of 87
When clicking on Search, List or Screener at the
Category or Subcategory level, default filters will be
applied.
Specify Time Horizon & Rebalancing Rate for
reporting purposes. Select any report(s), specify
related parameters then press Build Report to
generate a report.
Press Properties to specify Model Properties.
SCANalytics Manual v2.0
www.AdvisoryWorld.com
1-800-480-3888
Page 59 of 87
External Source can be any alpha numeric descriptor for the source of the model. For example, ORION
users should enter an External Source of ORION in order to import models from this source.
External Key can be any alpha numeric identifier for the model. For example, ORION users should enter
an External Key equal to the ModelID in order to import models from this source. Note that the
External Key equates to a ticker for the given model.
Automatically Update Model Allocations Select this option to update the given model allocations from
the External Source automatically on the 5th of every month. Press Import Now to import the model
allocations from the External Source.
Feature only available for ORION users as of Q1 2012.
Automatically Update Model Performance Select this option to update the given model historical
monthly returns from the External Source automatically on the 5th of every month. Press Import Now
to import the model performance from the External Source.
Feature only available for ORION users as of 1/1/2012.
SCANalytics Manual v2.0
www.AdvisoryWorld.com
1-800-480-3888
Page 60 of 87
Import Model Performance from CSV: select a CSV file containing
historical monthly performance for the given model. Click Download
CSV Template to download the required file format. After entering
data into the template, select the file location then press Import Now
to import the values from the CSV file.
Press OK to Save Changes and close the form or Press Cancel to close
the form without saving changes.
SCANalytics Manual v2.0
www.AdvisoryWorld.com
1-800-480-3888
Page 61 of 87
Press Optimize to build an efficient
frontier consisting of theoretically
optimal portfolio allocations.
The Efficient Frontier consists of a series of portfolios plotted against annualized return (y-axis) and
standard deviation (x-axis).
All Blue Dots are theoretically efficient portfolios. By default the portfolio with the highest Sharpe
ratio is selected and highlighted in a light blue color.
The beginning portfolio allocation (current or other) is highlighted in Red.
SCANalytics Manual v2.0
www.AdvisoryWorld.com
1-800-480-3888
Page 62 of 87
Click on any portfolio to view its
MPT Statistics and Allocation.
When optimizing portfolios you may place constraints on various investment
categories, sub categories and investments themselves. Selecting "Static" holds
the Current allocation constant in all optimal portfolios (e.g. client will always
hold 5% AAPL no more, no less).
Notice that Min(imum) and Max(imum) constraints can be set forth as well (e.g.
a maximum of 25% International Equity and a Minimum of 1% Cash).
After setting constraints, press Recalculate to apply the constraints and rebuild
the efficient frontier.
SCANalytics Manual v2.0
www.AdvisoryWorld.com
1-800-480-3888
Page 63 of 87
The Current and Optimal Portfolios are displayed
side-by-side in the Analysis Table and pie charts.
Critical MPT Statistics such as Annualized Return,
Standard Deviation, Minimum ROR at 90%
Confidence and Sharpe Ratio demonstrate the
benefits of using an optimal solution.
By default Asset Returns are used for calculation purposes. You may
select to use Benchmark Returns or Estimated Returns (i.e. CAPM
Assumptions) to calculate the efficient frontier. Further, and by
default, the default Time Horizon for Asset or Benchmark returns is
Earliest Common Start date however you may choose a different time
horizon for calculation purposes.
After modifying return assumptions, press Recalculate to apply the
return series and rebuild the efficient frontier.
SCANalytics Manual v2.0
www.AdvisoryWorld.com
1-800-480-3888
Page 64 of 87
Clicking Estimated Returns launches the Asset Subcategory Annualized
Estimates form. Enter an Estimated Return and/or Standard Deviation
for any or all of the Subcategories in the portfolio. Leaving either
Estimated Return or Standard Deviation field blank will default to use
historical performance of the given Subcategory. Press View/Edit All
Subcategories to view and edit subcategory performance for all
subcategories regardless of whether or not they are in the given
portfolio.
Press Save to save Subcategory estimates or Cancel to close the
window without saving. Note: All correlation matrices are defined
based on historical performance and cannot be modified.
SCANalytics Manual v2.0
www.AdvisoryWorld.com
1-800-480-3888
Page 65 of 87
Press Save to update the current portfolio with the optimal allocation,
press Save As to save the Optimal portfolio as a new portfolio or press
Cancel to close the window without saving.
SCANalytics Manual v2.0
www.AdvisoryWorld.com
1-800-480-3888
Page 66 of 87
Press Import then Choose a Source:
As of Q1 2012, the following sources
are available:
Albridge, LPL, Orion, TD Ameritrade
and TradePMR.
Press Import to continue the import process
or press Cancel to close the process.
SCANalytics Manual v2.0
www.AdvisoryWorld.com
1-800-480-3888
Page 67 of 87
Select the Client(s) for import.
20 clients are listed per page, use the Page options to navigate across
multiple pages of clients if applicable. Sort client data by clicking on any of
the column headers.
Select the Account(s) for import.
20 accounts are listed per page, use the Page
options to navigate across multiple pages of
accounts if applicable. Sort account data by
clicking on any of the column headers.
SCANalytics Manual v2.0
www.AdvisoryWorld.com
1-800-480-3888
Page 68 of 87
If any assets are not recognized during the
report generation, this Notice form will display.
Press Yes.
To Map non-recognized assets either click on Click View/Select Closest Matches (if Available) or
Click View/Select Asset from List
After mapping unrecognized assets press Save to save your changes and Import press Cancel to
close the form.
SCANalytics Manual v2.0
www.AdvisoryWorld.com
1-800-480-3888
Page 69 of 87
Closest Matches are those assets in the
AdvisoryWorld database that most
closely resemble the names and types of
the unrecognized assets. Asset Matches
display in order of closest match to least
close match.
Select an Asset and Press OK or Press
Cancel to close without saving your
changes.
List displays all assets available in the
AdvisoryWorld database and allows users to
select any for mapping purposes.
Assets are grouped based on type: Asset
Class, Mutual Funds, Closed End Funds, ETFs,
Stocks, Variable Annuities, Underlying
Funds, Separate Account Managers and
Individual Bonds.
Click on any folder to expand and find the
assets for mapping purposes.
Choose an asset and press Select or press
Cancel to close the window without
selecting an asset.
SCANalytics Manual v2.0
www.AdvisoryWorld.com
1-800-480-3888
Page 70 of 87
After completing the mapping routine,
press Save Changes & Import
Press OK
SCANalytics Manual v2.0
www.AdvisoryWorld.com
1-800-480-3888
Page 71 of 87
Click on a folder name then press New and
Choose Folder or Asset
If a New Folder is chosen, enter a name for the Folder
and press Save to save the folder name and close the
form or Cancel to close the form without saving.
SCANalytics Manual v2.0
www.AdvisoryWorld.com
1-800-480-3888
Page 72 of 87
If a New Asset is chosen, enter
the following:
Name: Name of the Asset
Ticker: alpha numeric identifier
of the asset
Type: Asset Class (i.e.
benchmark index) or
Investment
Classification: If the Type =
Investment then you must
select an Classification from the
Asset List (such as S&P 500
Reinvested for Large Cap Blend)
Select Asset Classification from the Asset Class tree
(indices listed by name)
SCANalytics Manual v2.0
www.AdvisoryWorld.com
1-800-480-3888
Page 73 of 87
Historical Performance: select a CSV file containing historical monthly
performance for the given asset. Click Download CSV Template to download
the required file format. After entering data into the template, select the file
location then press Import Now to import the values from the CSV file.
Choose Save File and Press OK
SCANalytics Manual v2.0
www.AdvisoryWorld.com
1-800-480-3888
Page 74 of 87
Enter the asset ticker in column A, the end of the month Date of the
given monthly return in column B and the monthly return in column C.
Note that the column headers must remain intact.
Select Save As and enter a name. Choose Yes.
Browse to and Select the file you Previously Saved for
Import. Asset Returns will be imported on Save of the
Asset.
SCANalytics Manual v2.0
www.AdvisoryWorld.com
1-800-480-3888
Page 75 of 87
Choose Yes
User Defined Fact Sheets are supported within the application.
Browse to and Import PDF files for any asset.
Select the PDF file and press Open
SCANalytics Manual v2.0
www.AdvisoryWorld.com
1-800-480-3888
Page 76 of 87
Press Save and the Asset will be saved to the database,
monthly performance and fact sheets will be imported if
provided.
SCANalytics Manual v2.0
www.AdvisoryWorld.com
1-800-480-3888
Page 77 of 87
My Info
Enter User Information
First Name, Last name and Email Address fields are required
Cover Page Logo (displays on the cover page of reports)
Header Logo (displays in the header of all report pages)
Press Upload Logo to import a JPEG or GIF logo
File Name will display the stored, imported file
Password Information can be disregarded for Standard & Poor's users as all users are logged in
seamlessly.
Press Add New Fee to add a tier to the (Advisory) Fee Schedule
Add Account and Fee Value the added fee tier
Advisory Fees are calculated as follows: Apply the first tier Fee Value to $0.00 to Fee Tier 2 Account
Value ($99,999.99) etc.
The Account Value of the first row of the Fee Schedule is always $0.00
Select the Frequency with which to apply the Advisory Fees
SCANalytics Manual v2.0
www.AdvisoryWorld.com
1-800-480-3888
Page 78 of 87
You may adjust the colors within the report
by clicking on Edit Report Branding.
Header Text and Background colors affect
the table column Header Background and
the Text within them.
Chart Colors affect the Line and Pie Charts
and Bar Chart Colors affect the Bar Charts.
After Clicking on a Color, either click on a
color or using your mouse or enter RGB
values then press Pick Color.
SCANalytics Manual v2.0
www.AdvisoryWorld.com
1-800-480-3888
Page 79 of 87
System Configuration
Internet Explorer
Click on Tools-Internet Options
While backwards compatibility is supported, it is
recommended to use the latest version of Internet
Explorer and/or latest version updates to the version
residing on your local computer.
SCANalytics Manual v2.0
www.AdvisoryWorld.com
1-800-480-3888
Page 80 of 87
Security-Trusted Sites then press Sites.
Make sure that “Allowed levels for this zone” is
Medium or less.
SCANalytics Manual v2.0
www.AdvisoryWorld.com
1-800-480-3888
Page 81 of 87
Enter https://*.advisoryworld.com then press
Add.
Press Close
When finished, press Apply on the Internet
Options page.
SCANalytics Manual v2.0
www.AdvisoryWorld.com
1-800-480-3888
Page 82 of 87
Click on Privacy then press Sites
SCANalytics Manual v2.0
www.AdvisoryWorld.com
1-800-480-3888
Page 83 of 87
Type *.advisoryworld.com in the Address of
website then press Allow then press OK.
SCANalytics Manual v2.0
www.AdvisoryWorld.com
1-800-480-3888
Page 84 of 87
Click on Pop-up Blocker Settings
Type *.advisoryworld.com in the Address of
website then press Add then press Close
SCANalytics Manual v2.0
www.AdvisoryWorld.com
1-800-480-3888
Page 85 of 87
System Configuration
Adobe Reader
Click on EditPreferences
While backwards compatibility is supported, it is
recommended to use the latest version of Adobe
Reader and/or latest version updates to the version
residing on your local computer.
SCANalytics Manual v2.0
www.AdvisoryWorld.com
1-800-480-3888
Page 86 of 87
Click on Internet and make sure that Display PDF
in Browser is selected, then press OK
SCANalytics Manual v2.0
www.AdvisoryWorld.com
1-800-480-3888
Page 87 of 87