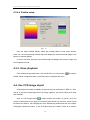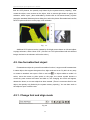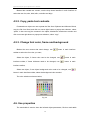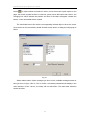
1
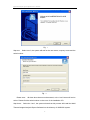
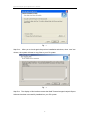
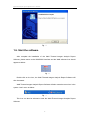
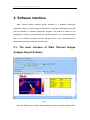
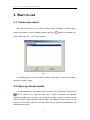
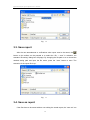
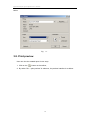
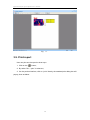
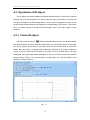
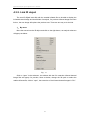
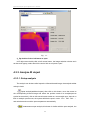
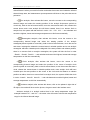
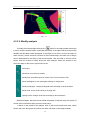
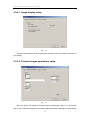
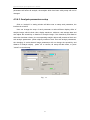
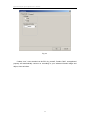
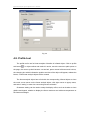
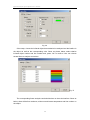
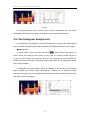
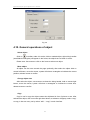
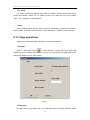
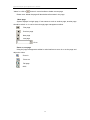
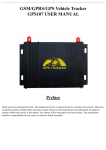
Thermal Images Analysis Report Software
User’s Manual
Wahl reserves the right to change this manual without prior notice
© 2011 Wahl
Infrared analysis report software-User ’manual
Contents
1. Introduction .................................................................................................................................1
1.1. Copyright ...........................................................................................................................1
1.2. Liability..............................................................................................................................1
1.3. Quality Assurance ..............................................................................................................1
1.4. System requirements ..........................................................................................................2
1.4.1. Recommend hardware configuration ...............................................................2
1.4.2. Operating system ................................................................................................2
1.5. Software installation...........................................................................................................2
1.6. Start the software................................................................................................................5
2. Software interface ......................................................................................................................6
2.1. The main interface of Wahl Thermal Images Analysis Report Software ...........................6
2.2. Menu bar ............................................................................................................................7
2.2.1. File menu ..............................................................................................................7
2.2.2. Edit menu..............................................................................................................8
2.2.3. View menu ............................................................................................................8
2.2.4. Drawing menu......................................................................................................8
2.2.5. Windows menu ....................................................................................................9
2.2.6. Help menu ............................................................................................................9
2.3. Toolbar ...............................................................................................................................9
2.3.1. Common Toolbar .................................................................................................9
2.3.2. Drawing toolbar....................................................................................................9
2.3.3. Pattern toolbar .....................................................................................................9
2.3.4. Analysis toolbar....................................................................................................9
2.3.5. Page toolbar .........................................................................................................9
2.3.6. Objects toolbar...................................................................................................10
3. Start to use ................................................................................................................................ 11
3.1. Create new report ............................................................................................................. 11
3.2. Open up saved reports...................................................................................................... 11
3.3. Save report .......................................................................................................................12
3.4. Save as report ...................................................................................................................12
3.5. Save as templates .............................................................................................................13
3.6. Export the report as WORD file.......................................................................................13
3.7. Print setup ........................................................................................................................13
3.8. Print preview ....................................................................................................................14
3.9. Print report .......................................................................................................................15
3.10. Batch process .................................................................................................................16
3.11. Exit .................................................................................................................................18
4. Use report .................................................................................................................................19
4.1. System interface ...............................................................................................................19
4.2. Composing of report contents ..........................................................................................19
4.3. Operations of IR object ....................................................................................................20
4.3.1. Create IR object.................................................................................................20
I
Infrared analysis report software-User ’manual
4.3.2. Link IR object .....................................................................................................21
4.3.3. Analyze IR object...............................................................................................22
4.3.3.1. Setup analysis.............................................................................................22
4.3.3.2. Modify analysis ..........................................................................................24
4.3.3.3. Delete analyze ............................................................................................25
4.3.4. Infrared image parameters setup....................................................................25
4.3.4.1. Image display setup....................................................................................26
4.3.4.2. Thermal images parameters setup ..............................................................26
4.3.4.3. Analysis parameters setup ..........................................................................27
4.3.4.4. Palette setup ...............................................................................................28
4.3.5. Voice playback ...................................................................................................28
4.4. Use CCD image object.....................................................................................................28
4.5. Use formatted text object .................................................................................................29
4.5.1. Change font and align mode............................................................................29
4.5.2. Copy, paste text contents .................................................................................30
4.5.3. Change font color, frame and background ....................................................30
4.6. Use properties ..................................................................................................................30
4.7. Use table tool ...................................................................................................................32
4.8. Profile tool........................................................................................................................34
4.9. Use histogram analytic tool..............................................................................................36
4.10. General operations of object ..........................................................................................37
4.11. Page operations ..............................................................................................................38
II
Infrared analysis report software-User ’manual
1. Introduction
Welcome to Wahl Thermal Images Analysis Report Software!
We are confident that Wahl Thermal Images Analysis Report Software will become
the friend of you and your thermal image camera!
We have accumulated more than ten year experiences to participate in design and
create Wahl Thermal Images Analysis Report Software. Those experiences are our own
and also from the feed back of our customer.
Hope you enjoy the cheer of using Wahl Thermal Images Analysis Report Software
to create your inspection report and the merits of the unique functions of Wahl Thermal
Images Analysis Report Software.
1.1. Copyright
Wahl reserved all rights of Wahl Thermal Images Analysis Report Software. No parts
of the software may be reproduced or copied without the prior written permission of
Wahl.
1.2. Liability
Wahl does not guarantee the quality, performance and applicability of this software if
this PC software has been impliedly used in the circumstance other then Wahl has been
state out
This manual will be updated for upgrade of versions and other purposes
aperiodically. Wahl Technology reserve all rights of upgrade this manual without prior
notice.
1.3. Quality Assurance
The quality manage system under which the products are developed and
1
Infrared analysis report software-User ’manual
manufactured has been approved to be qualified for the ISO 9001 standard.
1.4. System requirements
The files which involved in the Wahl Thermal Images Analysis Report Software are
thermal images, CCD pictures and graphics. Those three kinds of files are far larger than
the ordinary file; therefore the PC system should have large enough memory capacity,
hard disc space and also the high processing capability and high screen resolution.
1.4.1. Recommend hardware configuration
·PENTIUM Ⅲ 1.4GHzT CPU or higher
·256 Mbytes or higher system memories
·20G or higher hard disc space
·1024×768 or higher for the screen resolution
1.4.2. Operating system
Wahl Thermal Images Analysis Report Software is compatible with Microsoft
Windows2000, Windows XP. The multi-language version software is under developing.
1.5. Software installation
Following is the step by step description of install the Wahl Thermal Images Analysis
Report Software into your PC and also the preparations before use the software.
Wahl Thermal Images Analysis Report Software is installed by using of Setup
programs. The Setup program will guide you through the installation process. When
install, please inset the CD-ROM into your PC, find and run the setup.exe in the CD
directory. The name of Wahl Thermal Images Analysis Report Software directory is
preset and can be changed during the installation.
Step one:Welcome interface after run Setup.EXE
2
Infrared analysis report software-User ’manual
Fig. 1
Step two: Select “next”, the system will ask for the user name, company name and the
serial number:
Fig. 2
Please note: All those three items must be entered, or the “next” button will not be
active. Please find the serial number on the cover of the installation CD.
Step three: Select the “next”, the system shows that this process will install the Wahl
Thermal Images Analysis Report Software into the directory of WINDOW system.
3
Infrared analysis report software-User ’manual
Fig. 3
Step four: Allow you to check again the previous installation selections, when “next” are
chosen, the system will start to copy files to your PC system.
Fig. 4
Step five: The display of this interface means the Wahl Thermal Images Analysis Report
Software has been successfully installed into your PC system.
4
Infrared analysis report software-User ’manual
Fig. 5
1.6. Start the software
After complete the installation of the Wahl Thermal Images Analysis Report
Software, please retune to the WINDOWS interface and the Wahl software icon should
appear as below:
Fig. 6
Double click on the icon; the Wahl Thermal Images Analysis Report Software will
then be started.
Wahl Thermal Images Analysis Report Software will also create the menu icon in the
system “start” menu as below:
Fig. 7
This icon can also be selected to start the Wahl Thermal Images Analysis Report
Software.
5
Infrared analysis report software-User ’manual
2. Software interface
Wahl Thermal Images Analysis Report Software is a standard WINDOWS
application program; it works under the Windows XP or Windows 2000 system and tally
with the operating of Windows application program. This manual is based on the
assumption of that you are familiar with the Windows system, if it is necessary please
refer to the Windows operation manual, although some of the characteristics for
Windows are also been explained in this manual.
2.1. The main interface of Wahl Thermal Images
Analysis Report Software
Fig. 8
When the Wahl Thermal Images Analysis Report Software has been started, the file
6
Infrared analysis report software-User ’manual
window of Wahl Thermal Images Analysis Report Software will also been opened up.
The window size, shape and toolbar position will open as it had when you last time exit
the program. The window of the Wahl Thermal Images Analysis Report Software could
be changed in size, minimize/maximize and move over.
The top of the Wahl Thermal Images Analysis Report Software interface is the title
bar, underneath that is the menu bar, at bottom of the Wahl Thermal Images Analysis
Report Software interface is the state bar, user can select to display or hide the state bar.
There are six toolbar underneath the menu bar. The area below the toolbar is the
working space; you can work on your report in this space.
2.2. Menu bar
2.2.1. File menu
7
Infrared analysis report software-User ’manual
2.2.2. Edit menu
2.2.3. View menu
2.2.4. Drawing menu
8
Infrared analysis report software-User ’manual
2.2.5. Windows menu
2.2.6. Help menu
2.3. Toolbar
2.3.1. Common Toolbar
2.3.2. Drawing toolbar
2.3.3. Pattern toolbar
2.3.4. Analysis toolbar
2.3.5. Page toolbar
9
Infrared analysis report software-User ’manual
2.3.6. Objects toolbar
10
Infrared analysis report software-User ’manual
3. Start to use
3.1. Create new report
After start the software, a new report has been setup by default. If another report
needs to be created, it can be created by directly press the
button in the toolbar and
also by select the “file → new” in the submenu.
Fig. 9
In this dialog space, user can choose to create a plain report or use the prior made
template to create a report.
3.2. Open up saved reports
If the amendments or verifications need to be done on saved reports, please press
icon on toolbar or by select file menu “file → open” in submenu, the standard
Windows file dialog box will popup. By change the file path or others to choose the file
required, and then press the open button to open. The extension of the report file is .rpt,
when the file has been opened, a new sub-window will be opened up automatically. The
window looks as below:
11
Infrared analysis report software-User ’manual
Fig. 10
3.3. Save report
After the new amendments or verifications when report need to be saved, the
button on the toolbar can be pressed or to select the “file → save” in submenu, the
standard “file saving” dialog box will popup. By changing the file path or so to choose the
needed saving path and input the file name, press the “save” button to save. The
extension of the report file is rpt..
Fig. 11
3.4. Save as report
If the flies have to be saved without over writing the saved report, the “save as” can
12
Infrared analysis report software-User ’manual
be used. By select “file → save as” in submenu, the standard “save as” dialog box will
popup. By selecting the file path to put in the file name you want, press the “save as”
button to save. If the new file name is same as the one of the saved file name, the system
will remind you. The extension of the report file is rpt..
3.5. Save as templates
The system is capable of save any report as a template; the function of the template
is to save the same or similar report contents. When a new similar report is needed, the
corresponding template can be used. On the base of the templates, to create a new report
will be more efficient. The detail operate process is, select “file → save as” in submenu,
the standard file “save as” dialog box will popup. By changing the file path or so to choose
the saving path needed and input the file name, press the “save” button to save. If the new
file name is same as the one of the saved file name, the system will remind you. The
extension of the report file is rpt..
3.6. Export the report as WORD file
The system can convert the current operating pager into WORD file, select the “file
→ export” in current pager into WORD submenu, the standard file “save” Windows
dialog box will popup. By changing the file path or so to choose the saving path needed
and input the file name, press the “save” button to save.
After the WORD file been converted, system will automatically popup the enquire
dialog Windows, If “yes” is chosen, the system will open up the converted WORD file.
Annotate:
If you want to use this function, the Microsoft Word software should been installed in
your PC.
The system convert the infrared images analysis report into WORD file, because of
the operate system, there might be some different of typesets and fonts and those will
need adjusted by user.
3.7. Print setup
The user can change the size of the pager to suit your needs, select “file → print
setup” in submenu, the standard Windows print setup dialog box will popup, such as
13
Infrared analysis report software-User ’manual
below:
Fig. 12
3.8. Print preview
User can view the created report in two ways:
1、Click on the
button on the toolbar;
2、By select “file → print preview” in submenu, the preview interface is as below.
14
Infrared analysis report software-User ’manual
Fig. 13
3.9. Print report
User can print out the report in three ways:
1、Click on the
button;
2、By select “file → print” in submenu;
3、On the preview interface, click on “print” directly, the standard print dialog box will
popup, show as below.
15
Infrared analysis report software-User ’manual
Fig. 14
3.10. Batch process
The system can process a serial of images if the requirements are similar, and based
on a template to create a batch of same type of reports. This will improve the work efficient
enormously.
By select “file → batch” in submenu, the dialog box will appear, such as below.
Fig. 15
By select “report” or “picture”, a batch setting dialog box will appear, show as below.
16
Infrared analysis report software-User ’manual
Fig. 16
A saving path or pictures that need to process can be selected.
If “picture” is selected, click on “next”, the picture setting dialog will appear, such as
below.
Fig. 17
The “Palette” or “No palette” is selectable for pictures and also the palette type is
17
Infrared analysis report software-User ’manual
selectable. Click on “OK” to confirm, this will automatically create the pictures that has
been set.
If the “report” has been selected, click on “next”, the “select template path” dialog box
will appear, such as below.
Fig. 18
After the template has been selected, click on “OK”, the corresponding report will be
automatically created according to the selected template.
3.11. Exit
By select “file → exit” in submenu, the system will popup the confirming dialog box,
click on “OK” to exit from the system.
18
Infrared analysis report software-User ’manual
4. Use report
4.1. System interface
The main system interface is showed in the picture as below, on the top it contains
main menu, common operate toolbar, page toolbar, word processing toolbar, objects
toolbar and analysis toolbar. The plain space in the interspaces is report working area.
The best resolution for this software is 1024X768.
Fig. 19
4.2. Composing of report contents
The report mainly compose of infrared thermal images and analysis, CCD pictures,
formatted text, result lists, tables and objects image linear analysis, histograms and
decorate frames. The design of this report is also aimed on arrange the operations of
those contents. Those contents will explain one by one here under.
19
Infrared analysis report software-User ’manual
4.3. Operations of IR object
The IR object are used to display the infrared thermal pictures, it also can be used to
analyze and show the temperature of spots, lines and area (rectangular and circle) and
data such as highest or lowest temperature. It can be used to playback the voice on the
saved infrared thermal images and display the corresponding CCD pictures. The system
focus on create reports for infrared thermal images. This is the main subject of this
software.
4.3.1. Create IR object
Use the mouse to click on
infrared thermal image button in the objects toolbar
and allow the button in active, draw the mouse and move it to the plain space on the page,
the mouse symbol will become a cross-hair, click the left mouse button and held the
button, draw the mouse, a changing size rectangular will show on the page, release the
mouse, a new IR object will be created on the page. Such as showed below, the large
rectangular with eight black small rectangular is the new IR object without the infrared
thermal image. (There is no amounts limit to create object, but it will be limited by the
capacity of system memory).
Fig. 20
20
Infrared analysis report software-User ’manual
4.3.2. Link IR object
The new IR object must link with the needed infrared files to be able to display the
infrared thermal image and do all kinds of analysis, if a previous infrared image has been
link on, the new image will replace the previous one. There are two way to do the link.
1、 By menu
Move the mouse into the IR object and click on the right button, an analysis submenu
will popup as below.
Fig. 21
Click on “open” in the submenu, the window with the DLI extension infrared thermal
image files will popup for preview, show as below, change the file path or select the
relative infrared file, click on “open”, the extension of the infrared thermal images is “DLI”.
21
Infrared analysis report software-User ’manual
Fig. 22
2、By double click on left button to open
In IR object area double click on left mouse button, the image selection window such
as above will popup, select file which need to link on and press “open”.
4.3.3. Analyze IR object
4.3.3.1. Setup analysis
The analysis can be done after import the infrared thermal image, the analysis toolbar
mainly include:
1,
Spots analysis(additional spots); after click on this button, move the mouse to
the corresponding thermal image and select the position need to be analysis(mouse
symbol as cross-hair), click on left mouse button to add on a new analytic spot, there is no
limit on analytic spot amount, the system will title the spot in order(P01,P02,P03…)
and calculate and record the spot temperature automatically.
2,
Instantaneous spot analysis; this button is similar with the spot analysis, the
22
Infrared analysis report software-User ’manual
main different is when you use this function and make the mouse move inside the infrared
thermal image area, the instantaneous spot temperature will show on the point that mouse
pointed to.
3,
Line analysis; after activate this button, move the mouse to the corresponding
thermal image and select the starting position of the analytic line(mouse symbol as
cross-hair), hold on the left mouse button, move the mouse and draw a line, release the
mouse button and a new analytic line will been created, there is no amount limit on
analytic line, the system will title the line in order(L01,L02,L03…)and calculate and
record the highest, lowest and average temperature on this line automatically.
4,
Rectangular analysis; after activate this button, move the mouse to the
corresponding thermal image and select the starting position of the analytic
rectangular(mouse symbol as cross-hair), hold on the left mouse button, move the mouse
and draw a rectangular, release the mouse button in suitable position and a new analytic
rectangular will been created upon the diagonal of the start position and release position,
there is no amount limit on analytic rectangular, the system will title the line in order
(Rect01,Rect02,Rect03…)and calculate and record the highest, lowest and average
temperature on this line automatically.
5,
Circle analysis; after activate this button, move the mouse to the
corresponding thermal image and select the position of the centre of analytic circle
(mouse symbol as cross-hair), hold on the left mouse button, move the mouse and draw a
circle, release the mouse button in suitable position and a new analytic circle will been
created upon the start position as the centre of the circle and the distance to release
position as radius, there is no amount limit for analytic circle, the system will title the circle
in order(Area01,Area 02,Area 03…)and calculate and record the highest, lowest and
average temperature on this line automatically.
6,
Isotherm analysis; after activate this button, click on the palette in right side of
IR object, the results will show as the picture, the green area is the isotherm area.
Isotherm analysis is a analytic method that in the setup temperature range (for
example between 10℃ and 30℃) the same color will used to show those temperature
range in the infrared thermal image.
23
Infrared analysis report software-User ’manual
Fig. 23
4.3.3.2. Modify analysis
To modify the infrared object analysis, the
button in the object toolbar must keep
in active, and the infrared object is activated (the frame of the object will have eight sizing
handles look like black small rectangular. If the object is not active, click on the object to
make it active.). Move around the mouse on the infrared image, the state of the change
can be determined by the sharp of the mouse symbol, click and held on the left mouse
button, draw the mouse to modify and move each analysis. When the analysis in the
active the sharp of the mouse symbol will sort as:
Move spot
Move line: move the line entirely
Modify line: set another spot as centre of the circle to rotate or flex
Move rectangular: move rectangular entirely or change size
Modify rectangular: change rectangular size according to arrow direction
Move circle: move circle entirely or change size
Change circle: change circle size according to arrow direction
Isotherm analysis: Move the mouse inside the palette of isotherm area, the symbol of
mouse shows in different sharp, there are three ways:
1, Mouse in the middle of the palette, hold on left mouse button and draw, whole
section will move along with the mouse, the effect will show on the image instantly.
24
Infrared analysis report software-User ’manual
2, Mouse in the top of the palette, hold on left mouse button and draw, whole section
will move along with the mouse, the palette will change the upper position.
3, Mouse in the bottom of the palette, hold on left mouse button and draw, whole
section will move along with the mouse, the palette will change the lower position.
4.3.3.3. Delete analyze
To delete the corresponding infrared object analysis, the
button in analysis
toolbar must be in active, the infrared object is in active as well, use mouse to move
around the infrared image. When the mouse symbol change into
sharp, this analysis
can then be deleted, click on left mouse button to delete. After delete operation system will
update the analyze result and linear analysis object automatically.
Delete isotherm analysis: click
button in analysis toolbar, move mouse to the
isotherm area of palette, click on cursor to make symbol become
, click on left mouse
button to delete.
Clear all analyses: move mouse to corresponding infrared image, click on mouse
right button to popup infrared image analysis submenu, select the “remove analysis”, this
will clear all the analyses one-off (does not delete isotherm analysis), after this operation
system will update the analyze result and linear analysis object automatically.
4.3.4. Infrared image parameters setup
The system allow user setup their own entirely parameters of relative infrared object,
such as emmisivity, ambient temperature, distance and humility. It also allows user to
setup the individual analytic parameters such as emmisivity, distance and pattern of
display. Move mouse to corresponding infrared image, click on mouse right button to
popup infrared image analysis submenu, select the “setting”, this will allow user get into
the parameters setting window. There are Image, Object Parameters, Analysis, Palette
settings.
25
Infrared analysis report software-User ’manual
4.3.4.1. Image display setup
Fig. 24
There are three selections for image display as above; user can select it according to
your needs.
4.3.4.2. Thermal images parameters setup
Fig. 25
Show as above, the setup for thermal images parameters setup is for all images
one-off, if the individual images do not has the individual setup, changing of thermal image
26
Infrared analysis report software-User ’manual
parameters will effect all analysis, the analysis which has been solely setup will not be
changed.
4.3.4.3. Analysis parameters setup
Click on “analysis” in setting window will allow user to setup each parameter, the
interface is as below.
User can change the setup of each parameter to select different display effect of
analytic image, which include color, display maximum, minimum, and average date and
also adjust the emmisivity or distance of analytic image. If the emmisivity and distance
select box has been chosen, the corresponding analytic objects will possess of their own
sole analytic parameters. (When objects possess of their own sole analytic parameters,
the changing of entire thermal image parameters will not change the emmisivity and
distance of analytic object) , press “ok” to confirm, all setup will take effect, or press
“cancel” to cancel setup.
Fig. 26
27
Infrared analysis report software-User ’manual
4.3.4.4. Palette setup
Fig. 27
User can select suitable palette. Select the needed palette in drop down window,
press “ok”, the corresponding infrared object will display the infrared thermal image in the
pattern of selected palette.
If “invert” has been selected, the infrared image will display the reverse of high and
low temperature mode.
4.3.5. Voice playback
If the selected image object has a voice involved in, the voice button
in analysis
toolbar will be in implement state, press this button to playback the voice.
4.4. Use CCD image object
CCD images are mainly for display the pictures and can be display in “BMP” or “JPG”
format, by put the infrared image and CCD image together, your report will be more clear
and aesthetic.
Click on CCD image button
in object toolbar and make it in active, move the
mouse to plain space on the page, the mouse symbol become a cross-hair, press mouse
left button and hold on, the changing box which indicate the position and size of the object
will appear, release the button, a new CCD picture will be created. (There is no amount
28
Infrared analysis report software-User ’manual
limit for CCD pictures, the quantity only limited by the system memory capacity.). After
create the object, move mouse on the object, click on mouse right button to popup the
submenu, select “open”, (also achievable by double click on left mouse button), system
popup the standard Windows picture dialog box, select the picture file needed and confirm,
the CCD picture will show on the page, such as below.
Fig. 28
Additional CCD picture can be created by click right mouse button on infrared object
to popup submenu, select “show CCD”. (If there is no CCD picture linked with this infrared
image, the item in the submenu will not be active.)
4.5. Use formatted text object
Formatted text object is a powerful text edition function, it support multi-formatted text
in same object, also support change text font, align mode and so on. By this it is very easy
to create an aesthetic text report. Click on text tool
in object toolbar to make it in
active, move the mouse to plain space on the page, the mouse symbol become a
cross-hair, press mouse left button and hold on, the changing box which will appear,
release the button, a new text object has been created. (There is no amount limit for text
object, the quantity only limited by the system memory capacity.). You can then work on
the object to input or edit the text.
4.5.1. Change font and align mode
Fig. 29
29
Infrared analysis report software-User ’manual
Blacked the needed text content, use the drop down interface in main interface to
select the text font, size, bold, italic, underline and align.
4.5.2. Copy, paste text contents
Formatted text object can use to paste the files from Clipboard and Microsoft Word,
copy the file from Word, and click on mouse right button to popup text submenu, select
“paste”. It also can copy the contents in the object, blacked the needed text content and
click on mouse right button to popup text submenu, select “copy”.
4.5.3. Change font color, frame and background
Blacked the text content that need change, use
button in main interface
toolbar to select the font color you want;
Select the object, if frame color need to be changed, use
button in main
interface toolbar; if frame thickness need to be changed, use
button in main
interface toolbar;
Select text object, if text object background color need to be changed, use
button in main interface toolbar; select the background color needed.
The color selections show as below;
Fig. 30
4.6. Use properties
The result table is used to show the infrared object parameters, Click on result table
30
Infrared analysis report software-User ’manual
button
in object toolbar and make it in active, move the mouse to plain space on the
page, the mouse symbol become a cross-hair, press mouse left button and hold on, the
changing box which indicate the position and size of the table will appear, release the
button, a new result table will be created.
The result table has to link with the corresponding infrared object to show the result,
move mouse on the result table, double click left mouse button, a dialog box will popup as
below.
Fig. 31
Select relative items, object message type show in left, available messages items for
this type show in right. Click on “OK” to confirm, the relative parameters will display in the
main interface. Press “cancel”, the setup will not take effect. The result after selection
shows as below.
31
Infrared analysis report software-User ’manual
Fig. 32
4.7. Use table tool
Click on table tool button in object toolbar and make it in active, move the mouse to
plain space on the page, the mouse symbol become a cross-hair, press mouse left button
and hold on, the changing box which indicate the position and size of the table will appear,
release the button, a new table will be created.
There are two ways to fill the contents in the table;
1, user fills in contents and text by themselves;
2, link with some infrared object parameters;
Click mouse right button in the table cell, a menu will popup as below, select
“properties”, a configuration dialog box will popup.
Fig. 33
In configuration dialog box, the cell type and background color can be affirmed, show
as below.
32
Infrared analysis report software-User ’manual
Fig. 34
If select “text”, a text needed can be fill in by yourself; if select “field”, an appointed
property will automatically connect on according to your selected infrared image and
object, show as below.
33
Infrared analysis report software-User ’manual
Fig. 35
4.8. Profile tool
The profile tool is use for linear analysis of beeline in infrared object. Click on profile
tool button
in object toolbar and make it in active, move the mouse to plain space on
the page, the mouse symbol become a cross-hair, press mouse left button and hold on,
the changing box which indicate the position and size of the object will appear, release the
button, a new linear analysis object will be created.
The linear analysis object has to link with the corresponding infrared object to show
the result, move mouse on the linear analysis object, click right mouse to popup menu,
and select “setting” to enter into connecting window as below.
Characters setting can be used to setup the display effect, such as whether to show
gridline and legend, whether to display the linear maximum and minimum temperature or
the instant messages.
34
Infrared analysis report software-User ’manual
Fig. 36
Color setup, choose the infrared object that needed to be analyzed and the beeline in
the object as well as the corresponding color. Show as picture below, select relative
infrared object number and line number and, press “Ok” to confirm. User can choose
several lines to analyze at one time.
Fig. 37
The corresponding linear analysis result should show on the main interface. Show as
below, there will be line maximum, minimum and instant temperature and line number on
the object.
35
Infrared analysis report software-User ’manual
Fig. 38
In the linear analytic result, move the green instant temperature line, the instant
temperature will change accordingly; the position of the point will also changed.
4.9. Use histogram analytic tool
The histogram tool is applies to analyze the histogram of beeline and measurement
area, it indicate the distributing of analytic beeline and measurement area more visually.
Method to use :
1, Create object: Click on profile tool button
in object toolbar and make it in
active, move the mouse to plain space on the page, the mouse symbol become a
cross-hair, press mouse left button and hold on, the changing box which indicate the
position and size of the object will appear, release the button, a new histogram analysis
object will be created.
2, Create link: The default linking object in histogram is the first line in first infrared
object. Double click mouse inside the histogram, a dialog box for histogram linking
selection will popup. User can change the infrared object number, choose the line number
and display color of histogram.
36
Infrared analysis report software-User ’manual
Fig. 39
4.10. General operations of object
Select object
Click on
in toolbar; make it in active; click on needed object; eight sizing handles
(small black rectangular) will appear in the frame; the object has now been in active.
Please note: Use mouse to click on the frame to select text object.
Move object
All object can be move around the page optionally; after select the object hold on
mouse left button; move the mouse; system will show a rectangular to indicate the current
position; release mouse to confirm.
Change object size
After select the object; use mouse to activate the sizing handel; hold on mouse right
button; move the mouse; system will show a rectangular to indicate the current size;
release mouse to confirm.
Copy
Copy is use for copy the object content into clipboard in form of picture or text. After
selected the object; click on mouse right hand button; a submenu will popup; select “copy”
to copy. It also can carry out by select “edit” – “copy” in main interface.
37
Infrared analysis report software-User ’manual
Cut, paste
Cut, paste is used as following: after select the object, click on mouse right button,
popup the submenu, select “cut” or “paste” to work out. It also can carry out by select
“edit” –“cut” or “paste” in main interface.
Delete
Used to delete object directly, click on mouse right button to popup the submenu,
select “delete” to delete. It also can carry out by select “edit” –“delete” in main interface.
4.11. Page operations
System can create new page optionally for multi-page operation.
Add page
Click on “Add page” button
in main interface, system will popup Add Page
dialog box, such as below. By settings in the box, user can make new page Add at last,
Add at first, Before current, After current.
Fig.40
Delete page
On plain space of the page click on mouse right button to popup submenu, select
38
Infrared analysis report software-User ’manual
“delete” or click on
button in control toolbar to delete current page.
Please note: delete the page will also delete all contents in the page.
Move page
System displays in single page, if user wants to work on another page, another page
should be switch on. It can be done through page management toolbar.
First page
Previous page
Next page
Last page
Go to
Zoom on, out page
Using the page management toolbar in main interface to zoom in or out the page and
adjust the vision.
Zoom in
Zoom out
Full page
100%
39