1
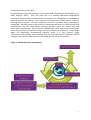
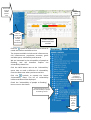
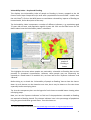
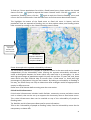
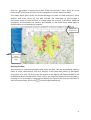
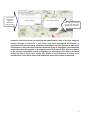
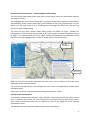
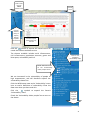
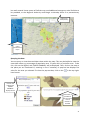
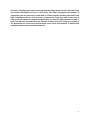
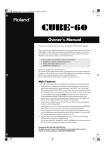
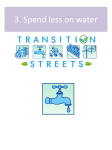
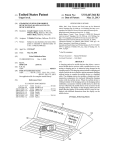
GRaBS Assessment Tool User Guidance
Richard Kingston & Gina Cavan
Centre for Urban and Regional Ecology
School of Environment & Development
University of Manchester
August 2011
http://www.ppgis.manchester.ac.uk/grabs/
The latest version of the user guidance can be found on-line.
Table of Contents
List of Figures
2
List of Tables
2
1.
Introduction
3
2.
What does the GRaBS Tool do?
6
3.
How can it be used?
9
3.1.
Exploring the Assessment Tool: European Level ........................................................ 10
3.1.1.
Basic functions ............................................................................................................ 10
3.1.2.
European themes ........................................................................................................ 11
3.2.
Adding your own data to the Assessment Tool .......................................................... 16
3.3.
Risk of flooding in the London Borough of Sutton ...................................................... 17
3.4.
Critical infrastructure protection in Styria .................................................................. 23
3.5.
Risk of high temperatures in Catania .......................................................................... 28
4.
Summary
34
5.
References
35
1
List of Figures
Figure 1: Collaborative Tool Development ................................................................................. 5
Figure 2: The Menu System...................................................................................................... 10
List of Tables
Table 1: Data types .................................................................................................................... 6
Document Control:
Version no.
Prepared/ Updated By
Date
1.0
Richard Kingston ([email protected])
12th August 2011
2
1. Introduction
Building on research originally carried out in the Centre for Urban and Regional Ecology at
The University of Manchester (UoM) a major aim of the GRaBS project was to develop an
innovative, cost effective and user friendly risk and vulnerability assessment tool, to aid the
strategic planning of climate change adaptation responses in towns, cities and regions across
Europe. The main aim of this document is to provide guidance on how to use the GRaBS
Assessment Tool (the Tool) and is divided in to five sections. We firstly introduce the GRaBS
project and the rationale for developing the Tool, which is followed by an explanation of
what the Tool can do (and what it cannot do) in section 2. We then explain how it can be
used to support the development of Climate Change Adaptation Action Plans (AAPs) through
the concept of a storyline.
The main aim of the GRaBS Assessment Tool was to assess current vulnerability of urban
areas to climate change impacts, with an additional assessment of relative spatial patterns
of risk where suitable data is available. The Tool is based on a Geographical Information
System (GIS) and was built on top of the Google Maps interface using a range of spatial data
for the whole of Europe, together with specific spatial data from project partners – in total
over 325 different map layers. From the start of the project there was a desire to develop a
Tool which would be easily accessible to a wide range of stakeholders involved in climate
change adaptation, including the general public. With eleven partners responsible for
developing Adaptation Action Plans, developing a tool which would meet the needs of all
project partners was quite a challenge.
At the heart of the GRaBS project is the understanding that climate change is a problem that
impacts on urban in different ways according to their specific exposure to climate and
weather hazards. Urban areas also have varying characteristics (e.g. population structures,
development patterns etc) that influence how they will be affected by climate change.
Improving understanding of these issues in an urban context can support adaptation
planning, and this is what the Assessment Tool aims to do. GRaBS also recognises that within
a European context, being able to understand that Europe’s climate is changing is important
in order to take a broader perspective of how climate change will influence its urban areas.
Associated climate impacts, such as flooding and heat waves have been experienced across
Europe over recent decades, and future projections highlight the magnitude of change likely
to be experienced over the coming decades. The GRaBS project looked in detail at the
potential impacts of climate change across Europe. This understanding helped to provide a
context for the Assessment Tool from the perspective of assessing vulnerability to climate
change in the partner cities and regions. Two key issues are:
•
•
Temperatures are projected to increase over Europe at levels higher than the global
average. Increases of between 2-6°C are expected depending on the greenhouse gas
emissions scenario considered. The north is projected to warm at a slightly faster pace
than the south.
Precipitation patterns are expected to change significantly. Recent seasonal and
geographic changes in rainfall are projected to intensify. Northern Europe has become
wetter over the last century, a trend that is likely to continue particularly over the winter.
However, Southern Europe has become drier with further reductions in summer
precipitation expected. Increases in precipitation extremes are also likely.
3
These changes in temperature and precipitation will generate impacts including:
•
•
•
•
•
•
Flooding events are expected to increase in frequency and magnitude, especially over
northern and western Europe during the winter months where river discharges are
projected to increase. Extreme rainfall events will increase the threat of flash floods
across most of Europe.
Lower rainfall and associated river discharge/aquifer recharge will increase drought risk,
particularly over southern and eastern Europe. The threat of longer dry spells is lower
in northern Europe.
Central and eastern Europe in particular are likely to experience summer heat waves of
increasing intensity and duration. By 2050, the Mediterranean could have an extra
month with days over 25°C.
During the 1990’s, the number of extreme weather events (floods, storms, droughts)
doubled. This increase in frequency has continued into the early 21st Century and is
projected to continue to do so. It is extreme events, not gradual changes in climate,
which cause the most significant impacts on human and natural systems.
Sea level rise is a key threat to coastal communities and ecosystems. Globally, increases
of 18-59cm are projected, with regional variations also likely. The prospect of more
significant increases cannot be ruled out, for example relating to the melting of the
polar ice caps.
Climate change is expected to bring with it changes in wind speeds, with significant
regional variation. Increases of 10-15% in average and extreme wind speeds are
possible over northern Europe, with a 10-15% decline in speeds in southern Europe. An
increase in storminess over Western Europe during the winter months is also possible.
Source: EEA, 2008.
The most up to date information on recent and projected future change to Europe’s climate
can be found in the European Environment Agency publication Impacts of Europe’s changing
climate - 2008 indicator-based assessment (EAA, 2008). With this overview setting the
context for the project and feeding into the requirements of the Tool, individual partners set
about assessing their own climate impact priorities and deciding what their own priorities
were within their own municipalities.
In the first 6 months of the project, a literature review was undertaken to explore the stateof-the-art on climate change adaptation and existing vulnerability/risk assessment tools,
with a particular emphasis on their relationship with the findings from the ASCCUE project
(Lindley, 2009). The literature review formed part of an overall strategy to develop the Tool
in collaboration with all GRaBS partners as outlined in Figure 1 below. This began by
undertaking a User Needs and Requirements Analysis (UNRA), which asked all partners
about the key climate change issues in their municipalities, what the important aspects that
the Tool should address were and extensive questions about data availability and copyright.
The combination of the literature review, the most appropriate available technology, which
could be used by twelve partners in eight countries, and the UNRA, led to the development
of an initial functional specification. Together with the GRaBS partners, the University
developed the specification for the planning and design of the Assessment Tool. An
interactive start up workshop at the first Thematic Seminar, organised by UoM, increased
understanding of the Assessment Tool amongst GRaBS partners and was used to review
partner roles and needs in the process of developing the Tool and to provide initial guidance
4
for the specification of the Tool.
Its development follows the principles of an on-line Public Participation GIS (Kingston et al,
2000; Kingston, 2007). Here, the main aim is to develop web-based Geographical
Information Systems (GIS) to enhance public involvement and participation in environmental
planning and decision making. These systems are referred to as PPGIS and are a form of
Planning Support System. The main objective is based on the belief that by providing all
stakeholders, including citizens, with access to information and data in the form of maps and
visualisations, they can make better informed decisions about the natural and built
environment around them. The nature of the GRaBS project with a pan-European user-base
meant that the Tool had to be built using a common map base for all partners. Using Google
Map’s API (Application Programming Interface) which is a ‘free’, generic, highly
customisable, and probably, most important from a user perspective, very simple to use and
navigate, meant that we were able to build a single generic tool for all partners.
Figure 1: Collaborative Tool Development
5
2. What does the GRaBS Tool do?
The main aim of the GRaBS Assessment Tool was to assess current vulnerability of urban
areas to climate change impacts, with an additional assessment of relative patterns of
spatial risk where suitable data is available. This helps to build the evidence base available
to decision makers and other stakeholders when developing adaptation plans and strategies.
Vulnerability relates to the susceptibility of elements at risk (e.g. people, buildings,
greenspace) to climate hazards such as heat stress or flooding. Vulnerability to climate
change impacts can be high where certain elements at risk, such as elderly people, zones of
high density development, or critical infrastructure, are exposed to climate hazards.
Identifying locations where vulnerability is high is central to the development of climate
change adaptation strategies. Adaptation strategies act to reduce vulnerability by lowering
exposure and increasing resilience of elements at risk from climate hazards. Where
vulnerability is lowered, the impacts of climate hazards can be significantly reduced. The
GRaBS Assessment Tool therefore focuses on highlighting vulnerability to climate change
impacts within the partner’s case study locations. In order to do so, we needed to obtain
spatial data on the location of a range of receptors that are potentially vulnerable to climate
hazards.
At the start of the project it was difficult to anticipate the amount and complexity of the
data layers which would be used in the Tool. Indeed we involved all partners in assessing
what were the key climate impact factors and climate-related issues in their areas so that
the tool was fit for purpose in each of the municipalities and regions across Europe. Thus
the project team embarked on a collaborative process of tool development with all the
partners, in order to shape the exact form and function of the final tool (see Figure 1).
Through the use of the UNRA, partners were asked to identify the types of functionality and
their anticipated requirements of the Tool; what their climate change impact priorities were;
a series of questions on the availability of data to input into the Assessment Tool; and the
origin and source of the spatial data and report any copyright issues on the data provided.
There are currently over 325 different spatial layers in the Tool, with partner level data
ranging from 7 to 50 layers (see table 1). This reflects the extent to which different
municipalities have been collecting relevant data and their ability to work across
departmental boundaries to obtain necessary data. In addition, at the EU level there are 32
spatial layers available.
Table 1: Data types
Partner Level
No. of layers
Social Infrastructure (schools, hospitals, emergency services, care homes, prisons etc.)
52
Civil Infrastructure (utility services, railway stations, roads at risk of flooding, waste disposal
facilities etc.)
Population Structure (population density, areas of deprivation)
49
14
Green & Blue space (parks, trees, playgrounds, sports fields, water bodies, cemeteries etc.)
54
Vulnerability (population ages over 75 and under 4, people with poor health, people on low
income, people vulnerable to high temperatures & to flooding, properties vulnerable to
flooding, population living on ground floor or basement and living on third floor or higher)
60
6
Hazards (flood zones, historic flooding events, surface water flooding, groundwater flooding,
sewer flood risk)
Urban Development (current and proposed residential and industrial development, historic
and cultural buildings)
European Level
39
Climate (including the 2080s IPCC A2 emissions scenarios 1961-1990 mean temperature &
precipitation from PRUDENCE)
Climate hazards (drought, extreme temperature, river flooding, forest fires, storm surge,
storm events) from ESPON
Civil Infrastructure (airports, mayor roads and railway lines)
15
Population Structure (density, growth, 0-14 and 60+ years)
4
Urban Development (degree of urbanisation, urban areas)
2
Green & Blue space (urban green space, blue space, protected areas)
3
7
5
3
To complement the UNRA a review of climate change vulnerability, risk and adaptation
assessment tools was undertaken (Lindley, 2009). This review concluded that a wide range
of on-line tools are available for risk assessment and risk management but that there was
debate surrounding what comprises such a tool in relation to climate adaptation. The
review also identified that there was no existing tool specifically for vulnerability
assessment, and there was a scarcity of tools specifically focused on cities and urban areas.
This was further enhanced by a review of the available technology, and at the time of
development, only the Google Maps platform provided what is called an API (Application
Programming Interface), allowing software developers to customise and build other tools on
top of a common map base. Given the popularity and familiarity of the Google Maps
interface, this was deemed a suitable platform to build the tool on. The combination of the
above aspects of the Tool’s development revealed that the Tool needed to:
•
•
•
•
•
•
•
•
•
•
•
allow map overlay to enable identification of priority areas for adaptation actions;
map vulnerability and risk (where data was available) to climate change hazards and
show spatial distributions;
to consider the possibility of a data upload element in the tool;
to house the GRaBS tool within a website which acts as a data/tool portal;
to place the tool within a clear risk management and adaptation assessment
framework/process;
generate a list of climate hazards and receptors;
identify relative patterns of risk in urban environments;
show the severity of the impacts;
inform preparation of planning documents to enable accounting of climate change
impacts on people, property, assets and infrastructure;
to be fully accessible to all stakeholders online, including residents, developers, local
business, utilities and councils;
to ensure that terminology is clear and full documentation is provided for users.
It is also important to stress that the Tool in its current form can only deal with current
vulnerability to climate change and not future vulnerability to climate. Future research will
7
investigate possibilities for adding ‘What if?’ capabilities to the Tool to allow modelling of
different scenarios over 5-, 10-, 15- and 20-year time horizons. This is a difficult task when
dealing with fine grain data at the neighbourhood scale and its relationship with climate
modelling outputs.
The availability of data across Europe was a limiting factor, since the availability of relevant
datasets is key in framing the issues, and therefore, the better the data available, the better
the story to be told. The experience of developing the Tool has highlighted the need for a
common approach throughout Europe on identifying and collecting datasets to enable a
more harmonised approach to spatial planning for adaptation to climate change. This
would also have cost benefits, after initial upfront costs invested in collecting the correct
data, to inform the evidence base for adapting to climate change – a key consideration in
the current financial climate. The use of the Tool is therefore only as good as the data it
contains, and therefore, at the partner level, it is dependent on the spatial data that each of
the partners provided.
In addition to the main Assessment Tool, further work was undertaken with one GRaBS
partners’ case study area to develop more tools to assist in climate change adaptation
planning, specifically, for assessing the potential of green infrastructure in adapting urban
areas to climate change. The STaR (Surface Temperature and Runoff) tools were developed
by The Mersey Forest, in collaboration with the University of Manchester, for Northwest
England. The STAR models are web-based, intuitive, and user friendly models that have been
developed to allow users to assess the potential of green infrastructure in adapting their
areas to climate change. In these tools, users can determine how surface temperatures and
runoff varies as they increase or decrease the proportion of green infrastructure, under
different climate scenarios. The STAR tools were a late addition to the GRaBS Assessment
Tool programme of work, and are currently being finalised, due for release in late August
2011. They will be available to use from the GRaBS Assessment Tool website and are
explained in more detail in a forthcoming document.
8
3. How can it be used?
This section is divided into five parts and uses the concept of a storyline to guide the user
through the application of the GRaBS Assessment Tool. In doing so, it introduces the Tool
and demonstrates its functionality, datasets and information available. Each storyline starts
with the same introduction exploring the Tool at the European Level. This is outlined in
section 3.1 below. Three storylines1 have been developed and offer typical examples of how
an individual or organisation might use the GRaBS web-based Tool to support climate
change adaptation policy and decision-making within their organisation.
The first storyline is based on the risk of river flooding to people in the London Borough of
Sutton as follows:
“The Flood Group wants to develop an emergency plan for areas exposed to
fluvial (riverine) flooding within their neighbourhoods. They need to know where
help is the most needed in cases of both emergency and recovery. Also, they
would like to look specifically at the current provision of social infrastructure and
where it could be enhanced.”
The second storyline helps to assess social infrastructure in the region of Styria, Austria as
follows:
“The Regional Authority are attempting to assess the vulnerability of key critical
infrastructure in the event of future incidences of flooding. They use the Tool to
map out where current social and civil infrastructure is located such as power
plants, sewerage treatment works, electricity transformer stations and hospitals,
and develop an action plan to inform decisions about where current facilities
need to be adapted and where new facilities should be sited in the future in
relationship to vulnerable locations across the region.”
The third storyline helps assess the risk of high temperatures to people in Catania as follows:
“The Regional Authority are attempting to coordinate a joint response to dealing
with heat waves and high temperatures, by investigating which parts of the city
are most susceptible to high temperatures. They use the Tool to map out were
the most vulnerable people live (old and young) and the relationships between
these locations, land cover characteristics, and social infrastructure such as
schools, hospitals, and community centres, and develop an action plan to put in
place appropriate facilities at key locations.”
We recommend that before exploring the Tool, users upgrade their web browser to the
latest version and have JavaScript turned on. This is usually ‘on’ by default on most web
browsers,
but
if
required,
instructions
can
be
found
here
http://activatejavascript.org/en/instructions.
The spatial data sets used in the Tool are predominantly in ESRI’s (www.esri.com) shp format
for vector data although some of the EU scale data is in raster format. The Tool uses the
open source web mapping platform called MapServer and converts proprietary spatial GIS
1
Individual storylines are on the GRaBS website @ http://www.ppgis.manchester.ac.uk/grabs/
9
data in to an image format (in this case png) which speeds up the map rendering process for
the user. This also means that the user of the Tool does not have access to the source GIS
data overcoming data access restrictions which might apply to some of the datasets
depending upon their source of origin.
Figure 2: The Menu System
This system is designed to be intuitive, easy to use
and can be updated fairly easily. Navigation of the
data layers is done using an expanding menu system
which is familiar to users of the Windows operating
system as can be seen here in Figure 2. Spatial layers
are turned on or off using a checkbox. The menu
system has been designed in such a way that it is
relatively straightforward for a GIS/web developer to
add new layers of data in the future. This is key to the
future use and adaptability of the Assessment Tool. It
is possible for a user to overlay their own spatial data
(using the kml/kmz file format) on the website to
advance their knowledge. A partner wishing to add
their own spatial layers which are not necessarily in
the Tool can export their own ESRI shp or any other
spatial data files into the kml format. This is
particularly useful for partners with sensitive or
restricted information that they do not want in the
public domain. See section 3.2 below.
3.1. Exploring the Assessment Tool: European Level
Please open a web browser such as FireFox or Internet Explorer, and navigate to the GRaBS
Assessment Tool portal: http://www.ppgis.manchester.ac.uk/grabs/
Click on ‘Assessment Tool’. The introductory page sets out the three stages involved in
working through the Tool. Click on START THE TOOL to navigate to the Assessment Tool. The
Assessment tool opens at the European level. The Terrain map of Europe is displayed as a
default. This background map shows major roads, cities and country borders.
3.1.1. Basic functions
Changing the display:
You can change the display to show a normal map, aerial photography or a combination of a
map and aerial photography by clicking on ‘Map’ ‘Satellite’ or ‘Hybrid’ in the top left hand
corner. The ‘Map’ option shows the administrative boundaries, cities, roads and railway
lines.
Navigating around the map:
To move around the map, either use the pan tools, or using the mouse: click in the map,
10
hold down the button and move the mouse. To reset the map to the default European view
at any time, click on the hand icon
in the centre of the pan tool.
Zooming in and out:
You can zoom in or out by clicking in the map and moving the wheel on your mouse, or by
using the scroll bar on the left of the display. Again, click on the hand icon
to re-set the
map to the default European view at any time.
Use pan tools to move
around or re-set map
Drag scroll bar to
zoom in or out
Click
here to
change
map
display
The European level of the Assessment Tool provides important contextual information for
the user regarding climate hazards at the European level. This provides users with some
useful information, including details of their baseline and projected future climate, climate
hazards, and population structure. It also allows them to put their area in a European
context, and to compare the characteristics of their city or region with the rest of Europe.
3.1.2. European themes
The menu is open at the European tab as a default. The information available at the
European level in the Tool is shown on the European menu. The first type of information
relates to the climate.
Displaying a theme on the map
The Baseline climate (1961-1990) can be displayed by clicking on the
symbol to expand
the menu. This indicates that the data for the baseline climate includes maximum
temperature, minimum temperature and precipitation. Click on the symbol again, next to
‘Precipitation’ to expand the menu as overleaf.
Turn on the Precipitation, ‘Winter’ theme by clicking in the check box. The mean winter
precipitation for 1961-1990 across Europe will be displayed in the map.
11
Click on the + to
expand Baseline
climate menu
Menu
expands
Click in box to
turn theme on
Query the map layer
To query the map layer, click the mouse inside the white legend box. ‘QUERY ENABLED’ is
then displayed above the legend box, and you then can click a location inside the map. This
provides the value of the indicator currently displayed on the map. This only works on
vector layers! If the legend covers the area that you are interested in, please move the map
or zoom out. If the query returns ‘undefined’, there is no information to display.
Setting the transparency of data
The transparency of the data can be altered by sliding the bar in the legend window (above).
This can be set anywhere between 0 to 100% (completely transparent to solid colour). It is
most effective to use this function when overlaying data i.e. when displaying more than one
theme.
Slide the bar to
set transparency
Click anywhere in the
white box to ‘enable’
the query option.
Click on the ‘Source’
button to display
Data source
12
Looking up the map details and source
A short description of the map display is provided in a ‘Data note’ which you can view by
clicking on the ‘INFO’ button next to the theme name on the menu. A pop-out box then
appears, and displays the Data note. It can also be opened by click on the ‘INFO’ button in
the legend as shown above. This pop-out box is moveable and collapsible. If it obscures the
data display, please move it around the screen by hovering over the corner and reducing it
with the arrow, or by grabbing it with the mouse curser to move it. Tip: You can also view the
Data note before displaying the theme.
Note: If you click in anywhere in the map,
the Data note minimises to the tray. Please
click the INFO button to display it again and
close it.
Click on the ‘Info’
button to display
Data note
Further information about the theme,
including links to obtain the actual data
displayed on the Assessment Tool platform,
is provided in the ‘Data Source’. This is
located on the legend. Click on the ‘Source’
button to view the Data source in a pop-out
box.
To close the pop-out box, click on the
the top right-hand corner.
Displaying the GRaBS
administrative boundaries
Data note is
displayed in a
moveable and
collapsible popout box
in
partner’s
You can display the GRaBS partner’s administrative boundaries from the ‘GRaBS partners’
menu item. Click on the check box next to ‘GRaBS partners boundaries’ to display these.
Navigating to a region/city/town:
Enter your location into the search box in the bottom left
corner of the map and then click on ‘Search’. Alternatively,
navigate to a place using the mouse and zooming in. To go
back to the default European view at any time, click on the
hand icon
in the centre of the pan tool.
Click on centre of
pan tool to re-set
map
Enter location here
Next, you can have a look at data showing what the future climate could be like
in your area.
First, close the current theme. Click in the ‘Baseline climate – Precipitation –
Winter’ box to uncheck the tick. This will close the current theme from the map
display. Please note that this theme can be left on (i.e. ‘ticked’) but the data
display is clearer if each theme is viewed separately. Please also re-set the map
using the
button.
13
Then, click on the symbol to expand the menu under the ‘Climate Projections 2080s Medhigh’ title. Click on the INFO button next to the menu item to read more about the climate
projections data. You can then repeat the stages above to view the themes for winter
precipitation, including the data note and data source information. Note that two future
projections are provided, the IPCC Med-high (A2) and Med-low (B2) emissions scenarios.
These projections offer two differing views of how the climate of Europe could change by
the end of this century based on different levels of greenhouse gas emissions.
NOTE: In order to find out more about the future climate projections data, please look at the
INFO of each menu item and data source of each theme for detailed information.
Climate hazards - flooding
In the example here we are interested in the issue of flood hazard. The European level of the
Assessment Tool has a river flood hazard theme. Please close any open themes. Find the
river flood hazard theme in the menu under ‘Climate hazards’ and turn it on to explore the
data.
If we compare the Sutton to this data, as we do in the first storyline, this indicates that
compared to the rest of Europe, Sutton has a moderate river flood hazard potential. The
Data source explains that this map is based on historical floods, recorded from 1987 to 2002,
and mapped at NUTS3 level (areas with a population of 150,000 - 800,0002).
Tip: If you are unsure of where Sutton is, type this into the Location search box at the top of
the menu. The map will then zoom to Sutton. Click in the centre of the pan tool to re-set
map to the view of Europe.
Un-check the ‘River flood hazard’ box to close the theme.
London Borough
of Sutton
Check
box to
turn
theme
on/off
2
River flood hazard
potential map
indicates Sutton has
‘moderate’ risk
For more information on NUTS levels, see http://www.ppgis.manchester.ac.uk/grabs/appendix3.html
14
Population structure
The population structure themes provide an overview of the characteristics of the
population on a European scale, including population density, growth and vulnerable
populations (those aged under 14 and over 603). Again comparing this data to Sutton these
themes provide an overview of the vulnerability of people to flood hazard in Sutton,
compared to the rest of Europe.
Turn on the ‘Population density’ theme. This indicates the relationship between levels of
population density compared to the rest of Europe.
Un-check the ‘Population density’ box to close the theme.
Please also explore the other population structure themes and read the Data notes
accessible from the INFO buttons for more information.
Check
box to
turn
theme
on/off
Population density
map indicates Sutton
has a very high
population density
Please use the functions above to explore the rest of the themes in the European level of
the Assessment Tool. For example, you may wish to look at different future climate change
scenarios, different climate change hazards (e.g. droughts and extreme temperature
events) and issues related to the location of critical infrastructure. Please note that it is
best to ‘uncheck’ each box before displaying the next theme so that the data display is
clearer.
3
At the GRaBS Partner level, vulnerable populations are defined as those aged between 0-4 years and 75+
years. Ideally, these age ranges would also be shown at the European level, but such data was not available so
broader age groups had to be used.
15
3.2. Adding your own data to the Assessment Tool
You can add your own data to the Tool via the ‘Add kml’ function. This is particularly useful if
you have sensitive data that you do not want to be in the public domain as this function only
allows the individual user to view the uploaded kml layer. This can be done by typing the
web address of where your kml file has been published online or by pasting it in to the kml
window. This can be done at the European scale or at the Partner level.
Enter the kml web address and
click Add KML. You can then
clear the KML when finished
KML data can be created by converting ESRI shp files and other GIS file formats to the KML
format using freely available software or functions within proprietary software such as
ArcGIS or MapInfo. It is a file format used by Google Earth and Google Maps for displaying
geo-referenced data and stands for Keyhole Mark-up Language. See here for a list of
programmes that can do this:
•
http://spatialnews.geocomm.com/articles/overviewofkmlconversionprograms/
If you are unfamiliar with kml files, this documentation will help:
•
http://code.google.com/apis/kml/
16
3.3. Risk of flooding in the London Borough of Sutton
Summary
The Flood Group wants to develop an emergency plan for areas exposed to fluvial (riverine)
flooding within their neighbourhoods. They need to know where help is the most needed in
cases of both emergency and recovery. Also, they would like to look specifically at the
current provision of social infrastructure and where it could be enhanced.
The Flood Group firstly explored the European level of the Assessment Tool (as in Section
3.2) and found that the future climate projections data indicates that precipitation in winter
is likely to increase. The current impact of flooding from rivers in Sutton is significant on a
European scale, and the population density is very high compared to other regions across
Europe. Therefore, with more rainfall in winter, the risk of flooding is likely to increase
further, and the potential number of people exposed is high. Crucially, where population
density and flood risk are high, this presents a significant issue for organisations involved in
developing emergency responses to flood events to consider. The Flood Group now explore
the London Borough of Sutton in more detail at the GRaBS partner level of the Assessment
Tool.
Exploring the Assessment Tool at the Partner level
The partner level of the Tool can be reached by clicking on the ‘GRaBS Partners’ tab at the
top of the Tool menu. This changes the menu from the European level to the GRaBS Partner
areas. To choose a partner, click on the name. For this storyline, we will select ‘Sutton’.
A pop-out box opens with details of a Climate Impacts Assessment for the London Borough
of Sutton. This provides the Flood Group with an introduction to the characteristics of their
area, the GRaBS partner, and climate impacts in their area.
This indicates that the GRaBS partner consider the probability and severity of flooding from
rivers in Sutton to be of moderate significance (a score of 3). The elements identified to be at
risk from flooding from rivers include people, residential property and community
infrastructure.
Click on the ‘Close’ button in the pop-out box to close it and reveal the Terrain map of
Sutton.
17
Click on tab
to go to
GRaBS
partner
area
Click to
close
Click on
‘Sutton, UK’
to display
Climate
Impacts
Assessment
Climate Impacts
Assessment popout box
Click the
symbol to expand the Sutton menu to
reveal the themes available to view.
The themes available include social infrastructure,
civil infrastructure, population structure, green
and blue space, vulnerability and hazards.
We are interested in the vulnerability of people to
flooding, and will therefore explore the
vulnerability theme first.
Click the INFO button next to the ‘Vulnerability’
menu item to read a definition of vulnerability.
Close the Data note when you have read this.
Click the
symbols to expand the Sutton
‘Vulnerability’ menu. The list of vulnerability
indices available will be displayed.
Click on + to
navigate to
vulnerability of
people to flooding
Check the ‘Vulnerability of people to flooding’
box to turn on the theme.
Check the box to turn on
the ‘Vulnerability of people
to flooding’ theme
Use the
scroll bar
to view
the
whole
menu
18
Vulnerability index – People and Flooding
This displays the Vulnerability index of people to flooding in Sutton, mapped at the UK
Census Lower Super Output Area (an area with a population of around 1500 – smaller than
the LAU2 level4). Click on the INFO button to read about vulnerability, impacts of flooding on
human health, and a description of the map.
The Vulnerability index incorporates a number of different indicators, e.g. population aged
75 years old and over, and population aged 0-4 years old. Click on the Data source for full
details about how the Vulnerability index is calculated.
Data note
Vulnerability of
people to
flooding in
Sutton
This highlights the areas where people are particularly vulnerable to flooding due to their
personal or situational circumstances. However, these people may not necessarily be
exposed to a flood hazard. To establish this, we must look at the ‘Exposure indicators’ and
‘Hazards’.
Before doing so, un-check the ‘Vulnerability of people to flooding’ box to close the theme.
Note: Up to 6 themes can be viewed at one time, but it may be clearer to first view them
separately before overlaying them.
Tip: Use the transparency bars on the legend of each theme to enable better viewing when
overlaying maps.
Next, turn on the ‘Exposure indicators’ to find out if the populations vulnerable to flooding
are exposed to flooding hazard. The relevant indicator here is the percentage of population
living on ground and lower-ground floors. Turn this theme on.
4
For more information on LAU levels, see http://www.ppgis.manchester.ac.uk/grabs/appendix3.html
19
To find out if these populations live within a flood hazard zone, please explore the hazard
theme. Click the
symbol to expand the Sutton ‘Hazards’ menu. Click the
symbol to
expand the ‘Flooding’ menu, click the
again to reach the ‘Riverine flooding’ menu, and
turn on the first three themes. View the Data notes to find out more about these themes.
This highlights the extent of the flood zones or flood risk areas in Sutton, and the
populations that are exposed to flooding. You can also explore where past flooding events
have occurred by turning on the ‘Historic flooding events’ theme.
Turn on the
exposure
indicator and
hazard themes
Hazard and
Exposure indicators
for vulnerability of
people to flooding
Please also explore the separate vulnerability indicators.
The vulnerability indicators are mapped as separate themes in the menu and can be viewed
independently of the Vulnerability index. Viewing the separate vulnerability indicators is
useful to distinguish between the areas which may need help in an emergency i.e. those
with high percentages of populations aged 0-4 years old and over 75 years old; and, those
areas which may need financial help to recover after a flood event i.e. those with high
percentages of populations living on low incomes. By looking at vulnerability to flooding in
this way, the Flood Group can help to determine what strategies would be appropriate to
employ in different areas.
Please turn off all themes before moving onto the next section.
Critical Social Infrastructure
Critical social infrastructure includes: health facilities, community centres and other centres
such as schools, that can be set up to support the community when a flood event occurs.
This critical infrastructure data can be overlaid on top of the vulnerability of people to
flooding index.
Tip: Read the social infrastructure Data note for more information.
Turn on the ‘Vulnerability of people to flooding’ index, from the Vulnerability menu. Set the
transparency to about 40%.
20
Click the
symbols to expand the Sutton ‘Social infrastructure’ menu. Check all of the
boxes to turn on all of the themes. Set the transparency of these themes to 100%.
This shows which areas within the London Borough of Sutton are well-covered by social
facilities, and areas which are less well covered. The south-west of the borough is
particularly sparse of social facilities. If a flood event was to occur in this area, additional
emergency social facilities may need to be provided, or the Flood Group could begin to
develop these as a precautionary measure.
Adjust map
transparency
Turn on all the
social
infrastructure
layers
Querying the data
You can query or view the actual data values within the map. This may be helpful to view the
name of social infrastructure, such as a hospital, or the exact data value e.g. pensioners
living alone in an area. To do this, click the mouse on the legend, and ‘QUERY ENABLED’ will
be displayed above the legend box. Then, click on the map at the place you are interested in,
zooming in first if necessary. A pop-out box displays the value for the area you selected. To
close the pop-out box, click on the
in the top right-hand corner.
21
Click on the
legend until
‘QUERY
ENABLED’
displays above
Information is provided
in a pop-out when area
of interest is selected
Summary: The Flood Group has explored the GRaBS Partner level of the Tool using the
London Borough of Sutton as a case study. They have investigated the location of
populations that are particularly vulnerable to flooding due to their personal or situational
circumstances. They have then looked at the hazard layers to investigate if the vulnerable
populations have the potential to be exposed to the flood hazard. Also, they have looked
at the separate vulnerability indices to highlight the populations who require assistance
during and after a flood event. Finally, they looked at the distribution of critical social
infrastructure across the LB Sutton and established where these should be enhanced.
22
3.4. Critical infrastructure protection in Styria
Summary
The Regional Authority are attempting to assess the vulnerability of key critical
infrastructure in the event of future incidences of flooding. They use the Tool to map out
where current social and civil infrastructure is located such as power plants, sewerage
treatment works, electricity transformer stations and hospitals, and develop an action plan
to inform decisions about where current facilities need to be adapted and where new
facilities should be sited in the future in relationship to vulnerable locations across the
region.
The Regional Authority has explored the European level of the Assessment Tool (in section
3.2) and has found that the future climate projections data indicates that precipitation in
winter is likely to increase. The current impact of flooding from rivers in Styria is less
significant on a European scale than in other partner areas e.g. Sutton, and the population
density is low to medium compared to other regions across Europe. Whilst this may be the
case on a Europe-wide scale the Regional Authority are aware of anecdotal evidence that
indicates that this is not always the case and feel that flood risk is significant in their region.
They now explore the Region of Styria in more detail at the GRaBS partner level of the
Assessment Tool.
Exploring the Assessment Tool at the Partner level
The partner level of the Tool can be reached by clicking on the ‘GRaBS Partners’ tab at the
top of the Tool menu. This changes the menu from the European level to the GRaBS Partner
areas. To choose a partner, click on the name. For this storyline, we will select ‘Styria,
Austria’. A pop-out box opens with details of a Climate Impacts Assessment for Styria. This
provides the Regional Authority with an introduction to the characteristics of their area, the
GRaBS partner, and climate impacts in their area.
This indicates that the GRaBS partner consider the probability and severity of flooding from
rivers and urban flooding in Styria to be of high significance (a score of 4.5). The elements
identified to be at risk from flooding from rivers and urban flooding includes people,
residential property and social, community, industrial, commercial and transport
infrastructure.
Click on the ‘Close’ button
Styria.
in the pop-out box to close it and reveal the Terrain map of
23
Click the
view.
symbol to expand the Styria menu to reveal the themes available to
Click to
close
Click on tab to
go to GRaBS
partner area
Click on
‘Styria,
Austria’ to
display
Climate
Impacts
Climate Impacts
Assessment popout box
The themes available include social infrastructure,
civil infrastructure, population structure, green
and blue space, hazards and vulnerability.
We are interested in the risk of certain types of
infrastructure to flooding, and will therefore
explore the civil infrastructure theme first.
Click the INFO button next to the ‘Civil
Infrastructure’ menu item to read a definition of
elements at risk. Close the Data note when you
have read this. Check the ‘Power plant’ and
‘Electricity transformer station’ boxes to turn on
these two map layers.
Click on + to
navigate to civil
infrastructure
layers
Next click the
symbols to expand the Styria
‘Hazards’ menu. Two hazards are listed: flood risk
areas and flood control basins.
Check the ‘Flood risk areas’
box to turn on the theme.
Check the box to turn
on the ‘Flood risk areas’
theme
24
Risk to Critical Infrastructure – Power Supplies and Flooding
The Tool should now display three map layers: power plants, electricity transformer stations
and flood risk areas.
This highlights the areas where these types of critical infrastructure could be vulnerable to
flood hazards. At the current map scale it’s a bit difficult to see if any infrastructure is at risk.
Zoom in to the area south of Graz, following the A9 through the flood risk area until you
come to a town called Lebring.
The Tool will now show several power plants within the flood risk areas. Reduce the
transparency of the flood risk areas theme to 30 % and increase the two infrastructure layers
to 100%. It is now possible to see the spatial relationship between the infrastructure and
the flood risk areas highlighting a number of power plants in flood risk areas.
Set map
transparency
Data note
Note: Up to 6 themes can be viewed at one time, but it may be clearer to first view them
separately before overlaying them.
Tip: Use the transparency bars on the legend of each theme to enable better viewing when
overlaying maps.
Please turn off all the map layers before moving onto the next section.
Critical Social Infrastructure
Critical social infrastructure includes: health facilities, community centres and other centres
such as schools, that can be set up to support the community when a flood event occurs.
This critical infrastructure data can be overlaid on top of the flood risk areas and the
Vulnerability index.
Tip: Read the social infrastructure Data note for more information.
25
Click the
symbols to expand the Styria ‘Social infrastructure’ menu. Check the boxes to
turn on the ‘Hospitals’ theme. Set the transparency of this theme to 100%.
This shows which areas within the region of Styria that are well-covered by hospital facilities,
and areas which are less well covered. The area around Graz is well covered, but to the
south along the A9 this is less so. Certain types of climate impacts such as a flood event or
high temperature could put pressure on facilities in some areas of the region. Additional
emergency social facilities may need to be provided, or the Regional Authority could begin
to develop these as a precautionary measure.
Turn on the ‘Elements at risk: people -> Vulnerability index’ index, from the Vulnerability
menu. Set the transparency to about 40%.
Turn on the
hospitals in
the social
infrastructure
layers
Data note
Now add the ‘Flood risk areas’ theme again and look at the relationship between the
locations of hospitals and these areas. Experiment further with other social infrastructure
themes to see if any other types of social infrastructure are at risk from flooding.
Querying the data
You can query or view the actual data values within the map. This may be helpful to view the
name of social infrastructure, such as a hospital, or the exact data value e.g. the vulnerability
index value for a specific location. To do this, click on the Vulnerability index legend, and
‘QUERY ENABLED’ will be displayed above the legend. Then, click on the map at the place
you are interested in, zooming in first if necessary. A pop-out box displays the value for the
area you selected. To close the pop-out box, click on the
in the top right-hand corner.
Over the page there is a screenshot so you can see how this works.
26
Click on the
legend until
‘QUERY
ENABLED’
displays above
Information is provided
in pop-out when area
of interest is selected
Summary: The Regional Authority of Styria has explored the GRaBS Partner level of the
Tool using their region as a case study. They have investigated the location of civil
infrastructure that is particularly vulnerable to flooding due to their proximity to flood risk
areas. The Tool highlighted in particular where power plants were potentially vulnerable
to flooding. They then looked at various social infrastructure layers to investigate the
relationship between social infrastructure provision and vulnerable populations. Some
parts of the region, particularly south of Graz along the A9 appeared to lack access to
hospital facilities and also showed high levels of people vulnerable to climate hazards. This
analysis allowed the Regional Authority to establish where their critical infrastructure
should be enhanced.
27
3.5. Risk of high temperatures in Catania
Catania
Summary
The Regional Authority are attempting to coordinate a joint response to dealing with heat
waves and high temperatures, by investigating which parts of the city are most susceptible
to high temperatures. They use the Tool to map out were the most vulnerable people live
(old and young) and the relationships between these locations, land cover characteristics,
and social infrastructure such as schools, hospitals, and community centres, and develop an
action plan to put in place appropriate facilities at key locations.
The Regional Authority has explored the European level of the Assessment Tool and has
found that the future climate projections data indicates that high temperatures in summer
during both day and night-time are likely to increase. Catania’s population density is
relatively high compared to other regions across Europe. Therefore, with higher summer
temperatures, the risk of heat stress is likely to increase further, and the potential number of
people exposed is high. Crucially, where population density and risk of high temperatures
and heat waves are high, this presents a significant issue for organisations involved in
developing emergency responses to heat wave and high temperature events to consider. The
Regional Authority now explores the Catania Metropolitan area in more detail using the
GRaBS partner level of the Assessment Tool.
Exploring the Assessment Tool at the Partner level
The partner level of the Tool can be reached by clicking on the ‘GRaBS Partners’ tab at the
top of the Tool menu. This changes the menu from the European level to the GRaBS Partner
areas. To choose a partner, click on the name. For this storyline, we will select ‘Catania,
Sicily’.
A pop-out box opens with details of a Climate Impacts Assessment for Catania. This provides
the Regional Authority with an introduction to the characteristics of their area, the GRaBS
partner, and climate impacts in their area.
This indicates that the GRaBS partner consider the probability and severity of heat waves
and high temperatures in Catania to be of very high significance (a score of 5). The elements
identified to be at risk from heat waves and high temperatures include people, flora and
fauna and transport infrastructure.
Click on the ‘Close’ button in the pop-out box to close it and reveal the Terrain map of
Catania.
28
Click on tab
to go to
GRaBS
partner area
Click on
‘Catania,
Sicily’ to
display
Climate
Impacts
Assessment
Click to
close
Climate Impacts
Assessment popout box
Click the
symbol to expand the Catania menu to
reveal the themes available to view.
The themes available include social infrastructure,
civil infrastructure, population structure, green and
blue space, vulnerability and risk.
Click on + to
navigate to
Vulnerability index
Check the box to turn
on the ‘Vulnerability
index: people’ theme
We are interested in the vulnerability of people to
high temperatures, and will therefore explore the
vulnerability theme first.
Click the INFO button next to the ‘Vulnerability’ menu
item to read a definition of vulnerability. Close the
Data note when you have read this.
Click the
symbols to expand the Catania
‘Vulnerability’ menu.
Check the ‘Vulnerability index: people’ box to turn on
the theme.
Use the
scroll bar
to view
the whole
menu
29
Vulnerability index – People and high temperatures
This displays the Vulnerability index for people to climate hazards in Catania, mapped at the
Commune level (an area equivalent to the LAU2 level5). Click on the INFO button to read
about vulnerability, impacts of climate hazards on people, and a description of the map.
The Vulnerability index incorporates a number of different indicators, e.g. population aged
75 years and over, and population aged 0-4 years. Click on the Data source for details about
how the Vulnerability index is calculated.
Data
note
Vulnerability of
people to climate
hazards in Catania
This highlights the areas where people are particularly vulnerable to hazards such as high
temperatures due to their personal circumstances. However, these people may not
necessarily be exposed to high temperatures. To establish this, we must look at the
‘Hazards’.
Before doing so, un-check the ‘Vulnerability index’ box to close the theme. Note: Up to 6
themes can be viewed at one time, but it may be clearer to first view them separately before
overlaying them.
Tip: Use the transparency bars on the legend of each theme to enable better viewing when
overlaying maps.
Next, click the
symbol to expand the Catania ‘Hazard’ menu. Turn on the ‘High
temperature hazard’. This shows the high temperature hazard theme for three municipalities
of Catania. View the data note and source information to find out more about this theme.
Risk index – People and High temperatures
5
For more information on LAU levels, see http://www.ppgis.manchester.ac.uk/grabs/appendix3.html
30
To view the Risk index of high temperature to people, click on the ‘Risk index: people’ theme
from the ‘Risk’ menu item. This shows the risk index for three municipalities of Catania. This
index is a combined index of vulnerability, hazard and exposure. Click on the INFO button to
read about Risk and the Risk index.
Turn on the
Risk index:
people
Risk of high
temperatures to people
in 3 municipalities of
Catania
Please also explore the separate vulnerability indicators.
The separate vulnerability indicators are mapped as separate themes in the menu and can
be viewed independently of the Vulnerability index. Viewing the separate vulnerability
indicators is useful to distinguish between the areas which may need particular types of help
in an emergency e.g. areas with high percentages of populations aged 0-4 years may require
different emergency facilities to areas with high percentages of people over 75 years. By
looking at vulnerability to climate hazards in this way, the Regional Authority can help to
determine what strategies would be appropriate to employ in different areas.
Please turn off all themes before moving onto the next section.
Critical Social Infrastructure
Critical social infrastructure includes: health facilities, community centres and other centres
such as schools, that can be set up to support the community when a flood event occurs.
This critical infrastructure data can be overlaid on top of the Risk index.
Tip: Read the social infrastructure data note for more information.
Turn on the ‘Risk index: people’ theme, from the Vulnerability menu. Set the transparency to
about 40%.
Click the
symbols to expand the Catania ‘Social infrastructure’ menu. Check all of the
boxes to turn on all of the themes. Set the transparency of these themes to 100%.
This shows the social infrastructure for three municipalities in Catania. Within these
municipalities, it shows areas which are well-covered by social facilities, and areas which are
31
less well covered. Areas sparse of facilities may need additional emergency social facilities to
be provided, or the Regional Authority could begin to develop these as a precautionary
measure.
Adjust map
transparency
Turn on all the
social
infrastructure
layers
Querying the data
You can query or view the actual data values within the map. This may be helpful to view the
exact data value e.g. percentage of population over 75 years old in a particular area. To do
this, click on the legend, and ‘QUERY ENABLED’ will be displayed. Then, click on the map at
the place you are interested in, zooming in first if necessary. A pop-out box displays the
value for the area you selected. To close the pop-out box, click on the
in the top righthand corner.
Click on the
legend until
‘QUERY
ENABLED’
displays above
Information is
provided in
pop-out when
area of
interest is
selected
32
Summary: The Regional Authority has explored the GRaBS Partner level of the Tool using
the Catania metropolitan area as a case study. They have investigated the location of
populations that are particularly vulnerable to climate hazards, including heat waves and
high temperatures due to their personal circumstances. They have then looked at the
hazard and risk index to investigate the populations at risk from high temperatures due to
both their personal circumstances, and also due to where they live. Finally, they looked at
the distribution of critical social infrastructure across three municipalities in Catania and
established where these should be enhanced.
33
4. Summary
One of the main aims of the GRaBS project was to develop an innovative, cost effective and
user friendly risk and vulnerability Assessment Tool, to aid the strategic planning of climate
change adaptation responses. This has been achieved and has been used in different ways
by all 11 of the GRaBS partners responsible for developing Adaptation Action Plans.
Application of the Tool by GRaBS partners is reported in a separate document. Finally, this
document set the context in which the Tool can be used to support strategic climate change
adaptation responses and then works as a user manual to familiarise users with its
functionality following three storylines.
•
•
•
•
The GRaBS Tool is available on-line at http://www.ppgis.manchester.ac.uk/grabs/.
The European level of the tool uses data provided by the European Environment
Agency, ESPON, PRUDENCE and other sources.
At the partner level the Tool relies on data provided by the partner municipalities
and regions.
The Tool can only deal with current vulnerability to climate change and not future
vulnerability to climate.
In the future we hope to develop What-if? Modelling capabilities to deal with a combination
of different social, economic, climate and development scenarios over 5-, 10-, 15- and 20year time horizons. From September 2011 a Technical Annex will be available via the
website explaining how to set-up the Tool on your own web server. Municipalities not
involved in the GRaBS project can contact the author if they are interested in developing
their own version of the Tool.
34
5. References
Cavan, G. and Kingston, R. (forthcoming) Development of a climate change vulnerability and
risk Assessment Tool for urban areas. International Journal of Disaster Resilience in the
Built Environment.
EEA (2008) Impacts of Europe’s changing climate - 2008 indicator-based assessment.
Available from: http://www.eea.europa.eu/publications/eea_report_2008_4. Brussels:
EAA.
Kingston, R. (2007) Public participation in local policy decision-making: the role of webbased mapping. The Cartographic Journal, 44(2), 138-144.
Kingston, R., Carver, S., Evans, A. and Turton, I. (2000) Web-Based Public Participation
Geographical Information Systems: An Aid To Local Environmental Decision-Making.
Computers, Environment and Urban Systems, 24(2), 109-125.
Lindley, S. (2009) Literature Review of climate change vulnerability, risk and adaptation
assessment tools. University of Manchester, available from http://www.grabseu.org/downloads/GRaBS4-1_Literature_Review_August2009.pdf.
35