1
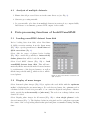
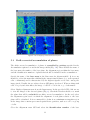
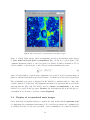
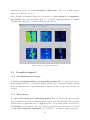
Look@NanoSIMS∗
User’s manual
Lubos Polerecky†
Max-Planck Institute for Marine Microbiology, Bremen, Germany
version 24-04-2012
http://www.microsen-wiki.net/lans
Summary
Look@NanoSIMS is a program for the analysis and processing of nanoSIMS and SIMS
data. It can be used freely for research purposes. It is an open-source program,
and can therefore be modified freely by anyone to meet their specific needs. We ask
users who make modifications to the program to share them with others by e-mailing
their improved code to the person in charge of the program maintenance, who will then
post the updated version on the program’s website (currently: LP). If you experience
problems with the execution of the program, discuss them first with your colleagues
that are experienced in using the program. If this does not solve your problem, contact
LP. In your e-mail, describe the problem and include in attachment the dataset for
which you experienced the problem as well as a screenshot of your Look@NanoSIMS
session, especially the Matlab’s command window with the error message. If you wish
to have new features added and don’t know how to do that, contact LP describing the
main idea. Since this program is at present being actively developed, there is a good
chance that your request will be rapidly fulfilled.
∗
Citation: L. Polerecky, B. Adam, J. Milucka, N. Musat, T. Vagner, M. M. M. Kuypers. (2012)
Look@NanoSIMS—a tool for the analysis of nanoSIMS data in environmental microbiology. Environmental Microbiology 14 (4): 1009–1023 (doi:10.1111/j.1462-2920.2011.02681.x)
†
[email protected]
1
Contents
1 Installation instructions
1.1 Installation under Microsoft Windows . . . . . . . . .
1.2 Installation under Linux . . . . . . . . . . . . . . . .
1.3 Installation under Mac OS X . . . . . . . . . . . . . .
1.4 Updating Look@NanoSIMS . . . . . . . . . . . . . .
1.5 Adjusting program appearance (obsolete from version
1.6 Adjusting graphical output appearance . . . . . . . .
1.7 The ”total number of scanned planes: 0” problem . .
. . . . . . .
. . . . . . .
. . . . . . .
. . . . . . .
24-04-2012)
. . . . . . .
. . . . . . .
.
.
.
.
.
.
.
.
.
.
.
.
.
.
.
.
.
.
.
.
.
.
.
.
.
.
.
.
3
3
3
4
4
4
5
5
2 Running Look@NanoSIMS
6
3 Organization of the input and output data
7
4 A typical data processing session
4.1 Analysis of a single dataset—“from scratch” . . . . . . . . . . . . . . . .
4.2 Analysis of a single dataset—continuation or modification of previous . .
4.3 Analysis of multiple datasets . . . . . . . . . . . . . . . . . . . . . . . . .
8
8
9
10
5 Data processing functions of Look@NanoSIMS
5.1 Loading nanoSIMS dataset from disk . . . . . . .
5.2 Display of mass images . . . . . . . . . . . . . . .
5.3 Drift-corrected accumulation of planes . . . . . .
5.4 Display of accumulated mass images . . . . . . .
5.5 Graphical output I . . . . . . . . . . . . . . . . .
5.5.1 Accumulated mass images . . . . . . . . .
5.5.2 Ratio images . . . . . . . . . . . . . . . .
5.5.3 Composite RGB images . . . . . . . . . .
5.5.4 EPS and PDF output . . . . . . . . . . .
5.6 ROI definition . . . . . . . . . . . . . . . . . . . .
5.6.1 ROI definition based on an external image
5.7 Text output . . . . . . . . . . . . . . . . . . . . .
5.8 Graphical output II . . . . . . . . . . . . . . . . .
5.8.1 Histograms . . . . . . . . . . . . . . . . .
5.8.2 Depth profiles . . . . . . . . . . . . . . . .
5.8.3 Lateral profiles . . . . . . . . . . . . . . .
5.8.4 Scatter plots . . . . . . . . . . . . . . . . .
5.8.5 PDF output . . . . . . . . . . . . . . . . .
5.9 ROI classification . . . . . . . . . . . . . . . . . .
5.10 Statistical comparison of ROIs and ROI classes .
5.11 Metafile processing . . . . . . . . . . . . . . . . .
10
10
10
11
12
13
13
13
15
16
16
18
20
21
21
22
22
23
23
24
25
27
2
.
.
.
.
.
.
.
.
.
.
.
.
.
.
.
.
.
.
.
.
.
.
.
.
.
.
.
.
.
.
.
.
.
.
.
.
.
.
.
.
.
.
.
.
.
.
.
.
.
.
.
.
.
.
.
.
.
.
.
.
.
.
.
.
.
.
.
.
.
.
.
.
.
.
.
.
.
.
.
.
.
.
.
.
.
.
.
.
.
.
.
.
.
.
.
.
.
.
.
.
.
.
.
.
.
.
.
.
.
.
.
.
.
.
.
.
.
.
.
.
.
.
.
.
.
.
.
.
.
.
.
.
.
.
.
.
.
.
.
.
.
.
.
.
.
.
.
.
.
.
.
.
.
.
.
.
.
.
.
.
.
.
.
.
.
.
.
.
.
.
.
.
.
.
.
.
.
.
.
.
.
.
.
.
.
.
.
.
.
.
.
.
.
.
.
.
.
.
.
.
.
.
.
.
.
.
.
.
.
.
.
.
.
.
.
.
.
.
.
.
.
.
.
.
.
.
.
.
.
.
.
.
.
.
.
.
.
.
.
.
.
.
.
.
.
.
.
.
.
.
.
.
.
.
.
.
.
.
.
.
.
.
.
.
.
.
.
.
.
.
.
.
.
1
Installation instructions
Look@NanoSIMS can be run on a variety of operating systems, including Linux,
Microsoft Windows and Mac OS X. It requires core Matlab installation and the accompanying Image Processing and Statistical Toolboxes (minimum version 7.11,
R2010b). Furthermore, to allow export of images and data in PDF format, it requires
installation of LATEX, a freely available text-processing program. To display EPS and
PDF output files generated by the program, it is recommended to use freeware programs
Ghostview and Acrobat Reader.
1.1
Installation under Microsoft Windows
1. Download the MikTeX distribution of TEX/LATEX from miktex.org/ and install it
on your computer.
2. Download Ghostscript and GSview from pages.cs.wisc.edu/~ghost/ and Adobe
Acrobat Reader from www.adobe.com, and install them on your computer.
3. Purchase Matlab together with the Image Processing and Statistical Toolboxes from
Mathworks (www.mathworks.com) and install them on your computer.
4. Download the Look@NanoSIMS distribution file from
http://www.microsen-wiki.net/doku.php?id=lans
and extract its content in a directory with read/write access rights (e.g.,
c:\programs\LANS\matlab).
1.2
Installation under Linux
1. Install the TEX/LATEX distribution for your Linux system.
2. Install Ghostscript and one of the common viewers of EPS and PDF files (e.g., gv,
acroread, evince).
3. Purchase Matlab together with the Image Processing and Statistical Toolboxes from
Mathworks (www.mathworks.com) and install them on your computer.
4. Download the Look@NanoSIMS distribution file from
http://www.microsen-wiki.net/doku.php?id=lans
and extract its content in a directory with read/write access rights (e.g.,
/home/user/programs/LANS/matlab).
3
1.3
Installation under Mac OS X
1. Install the TEX/LATEX distribution (www.tug.org/mactex/).
2. Install Ghostscript and one of the common viewers of EPS and PDF files (note that
these might be installed by default on your Mac).
3. Purchase Matlab together with the Image Processing and Statistical Toolboxes from
Mathworks (www.mathworks.com) and install them on your computer.
4. Download the Look@NanoSIMS distribution file from
http://www.microsen-wiki.net/doku.php?id=lans
and extract its content in a directory with read/write access rights (e.g.,
/home/user/programs/LANS/matlab).
5. Read the notes in the lookatnanosims.m file to modify system-specific settings
(e.g. paths to pdflatex and ghostscript).
1.4
Updating Look@NanoSIMS
When updating the Look@NanoSIMS program, all you need to do is to download the
updated distribution file (see Installation instructions above) and extract its content in the
same directory where you have your older version, overwriting the older files. Naturally,
it is wise to keep a back-up of the older version, just in case. This is especially true for
the lookatnanosims.m file under Mac OS X, which contains settings adjusted for your
system. Alternatively, you can join the lookatnanosims folder at www.dropbox.com and
have the files automatically updated by the Dropbox program. Please send an e-mail to
LP to be invited to join the folder.
1.5
Adjusting program appearance (obsolete from 24-04-2012)
The graphical user interface (GUI) does not appear the same on all platforms when
defined on one platform. For example, when defining a GUI (the file with extension
*.fig) under Linux, it will look quite different and often rather distorted when using it
under Windows. Thus, all GUI files are defined separately for each platform, and are
stored in separate sub-directories: figs win, figs lnx, figs lng sgd, figs mac. If you
wish to change anything in the layout of the GUI, you need to modify the *.fig file from
the directory corresponding to your platform, which can be done using the Matlab’s GUI
editor (menu: File -> New -> GUI).
4
1.6
Adjusting graphical output appearance
The appearance of the graphical output exported in the EPS and PDF format may also
depend on the platform or the Matlab version used. In particular, the size of the text
labels (e.g., axes labels, title text) relative to the size of the graph/image itself may
appear too large or too small. This can be adjusted by modifying the PaperPosition
property of the exported figures in the file fnc/print figure.m.
1.7
The ”total number of scanned planes: 0” problem
The mass counts on some (newer?) systems are stored as ushort (16-bit unsigned integer), whereas on some (older?) systems they are stored as uint8 (8-bit unsigned integers).
Perhaps this is because of the differences between the 32-bit and 64-bit operating systems
that run the Cameca instrument, but it is not sure. Therefore, if you experience problems
with loading a file, e.g. the program tells you that there are 0 planes in your file, it
may well be that this is the cause. In that case, open the file read im file.m in the
fnc directory and change if 1 to if 0 on line 12 (or so). Then save it and continue as
before. If this does not help, please contact LP.
5
2
Running Look@NanoSIMS
To run Look@NanoSIMS, start Matlab and change the current working directory to the
location of the lookatnanosims.m file. Depending on your operating system and where
you installed the program (see above), this can be done by clicking on the browse for
folder button and browsing through the file system to the correct folder, or by typing
>> cd c:\programs\LANS\matlab
or
>> cd /home/user/programs/LANS/matlab
in the Matlab’s command window. Subsequently, type
>> lookatnanosims
in the Matlab’s command window. This will open a main graphical user interface (GUI)
through which all functions of the program are executed (Fig. 1). Important messages
generated during program execution, including warnings and error messages, are displayed
in the Matlab’s command window. If an error occurs and you cannot fix it, please proceed
as described in the Summary on the first page of this document.
Figure 1: Main graphical user interface of the Look@NanoSIMS program.
6
3
Organization of the input and output data
To facilitate efficient data processing, especially through the metafile processing function,
datasets belonging to a given experiment, including the raw image stack files (files with
extension im) and the information files (files with extension chk im), need to be copied
to a single directory (Fig. 2A). The names of the directory and dataset files must not
contain spaces.
The processed information for a given dataset is stored in a directory of the same
name as the input file name. This directory is further structured into sub-directories
that contain exported information in the Matlab (mat), vector graphics (eps and pdf ),
bitmap (tif ) and text (dat, tests and tex) formats (Fig. 2B).
A
B
base directory
Directory with processed NanoSIMS dataset
directory with text-based data output
directory with vector graphical output
directory with matlab output
directory with vector graphical output
directory with text-based statistical output
directory with tex output
directory with bitmap graphical output
ROIs classification file
ROIs definition file
PDF summary output
calculation and display preferences
alignment file
Figure 2: Organization of the input and output data in Look@NanoSIMS.
Input data format
Each dataset must comprise two files, (i) the raw image stack (file with extension im)
and (ii) the information file (extension chk im). The first file contains the detected ion
counts stored in a binary format, whereas the second file contains information about
the structure of the binary file (names and masses of the detected ions, raster size, stage
position, etc.; Fig. 3). This information is essential for the Look@NanoSIMS program
to correctly load the binary file. Make sure with the operator of the Nanosims instrument
that this file is generated for each measurement.
7
Figure 3: Format of the chk im file containing essential information about the structure of the binary ion counts file.
4
A typical data processing session
This section describes steps of typical data processing sessions. The description is very
brief, to give you an idea about the data processing sequence. Refer to Sec. 5 for a more
detailed description of each implemented data processing function.
4.1
Analysis of a single dataset—“from scratch”
1. Define dead-time and QSA correction parameters. Usually, these corrections are
not necessary and this step can be skipped.
2. Load raw data from disk. Click on Ask for range of planes before loading if you
want to select specific planes when loading the raw data from disk.
3. Autoscale and display plane images for all masses. Decide which mass will be used
as a base mass for plane alignment during accumulation.
4. Display alignment mass. While viewing, deselect planes that should be excluded
from accumulation. At the end, define the alignment region.
5. Accumulate drift-corrected images. The alignment information will be stored in a
file xyalign.mat.
6. Autoscale and display the accumulated images to verify the alignment quality. If
not satisfied with the alignment, delete the xyalign.mat file, choose a different
alignment mass or alignment region and repeat steps 4+5.
7. Display accumulated masses via Output → Display masses.
8. Define expressions for ratio images. Display ratio images via Output → Display
ratios.
8
9. Define ROIs based on a template image (mass, ratio, RGB overlay, external). If an
external image is chosen as template, align it first with the nanoSIMS image. Save
the ROI file to disk (recommended file name cells.mat).
10. Export the image of ROI outlines. This will automatically assign a unique identification number to each ROI.
11. Display depth profiles of ratios in ROIs. Check whether ratios exhibit significant
trends with depth.
12. Display ratios as images (with ROI outlines), histograms, lateral profiles, scatter
plots or RGB images.
13. Classify ROIs. Save the ROI classification file to disk (recommended file name
cells.dat).
14. Export ratios in ROIs in graphical and text formats.
15. Perform statistical comparison of ROIs and ROI classes for the currently analyzed
dataset.
16. Export processing results in a PDF file.
17. Store settings of the current data processing session via Output → Store preferences
(recommended file name prefs.dat).
4.2
Analysis of a single dataset—continuation or modification
of previous analysis
1. Do steps 1+2 described in Sec. 4.1.
2. Load previously stored settings from disk (e.g. from the file prefs.mat) via Input
→ Load stored preferences.
3. Accumulate drift-corrected images. Alignment information stored in the xyalign.mat
file will be automatically applied.
4. Load ROIs from disk (e.g. from the file cells.mat).
5. Modify ROIs and ROI classification, if required.
6. Continue with steps 10–17 listed in Sec. 4.1.
9
4.3
Analysis of multiple datasets
1. Ensure that all processed data are in the same directory (see Fig. 2).
2. Generate processing metafile.
3. Process metafile: plot data from multiple datasets in scatter plots, compare ROIs,
ROI classes or treatments, generate PDF output of the results.
5
5.1
Data processing functions of Look@NanoSIMS
Loading nanoSIMS dataset from disk
Before loading data from disk, select Dead-time
& QSA correction settings from the Input menu
(Fig. 1B) to specify parameters for dead-time and
QSA corrections (Fig. 4).
Select Ask for range of planes before loading
(Fig. 1B) to enable the possibility to interactively
define planes that will be loaded from disk.
Select Load RAW dataset (Fig. 1B) to load
nanoSIMS dataset from disk. This will automatically fill the mass fields in the Detected masses
box with names of the detected masses, as well as
fill the images fields with [], which refers to all detected planes.
Figure 4: GUI for the definition of dead-time and
QSA corrections.
5.2
Display of mass images
Select Autoscale plane images (Fig. 1B) to update the scale fields with the optimum
scale for displaying the raw mass images. For each detected mass, the optimum scale is
calculated as the 0.1 and 99.9 percentile of ion counts in all pixels and planes. Alternatively, specify the scale manually as [min max]. The scale is not changed when a new
dataset is loaded.
Select Display plane images for all masses (Fig. 1B) to view single planes for the
detected masses (Fig. 5). The displayed value in each pixel and for each plane represents
the counts of the corresponding mass in that pixel and plane accumulated during dwelling
time.
10
Figure 5: GUI for displaying all detected masses and planes.
5.3
Drift-corrected accumulation of planes
The drift-corrected accumulation of planes is controlled by settings specified in the
Accumulation options box and in the images fields (Fig. 1A). These include the name of
the base mass, the number of the base plane, the alignment region within the base mass,
and the identification numbers of planes that should be included in the accumulation.
Specify the name of the base mass in the Base mass for alignment field. It is recommended to select the mass that exhibits high-contrast visual features (e.g., well separated
cells or filaments) and is characterized by the highest signal-to-noise ratio among the
image pixels. Usually, the secondary electron (SE) image is selected. When working with
cells on a polycarbonate filter, the image of 12 C14 N or 32 S is also a good alternative.
Select Display alignment mass from the Input menu. In the provided GUI, click arrows
to view the images of the detected planes (Fig. 6). Check the Deselect checkbox to mark
the plane that will be excluded from drift-corrected accumulation. At the end, select
the alignment region based on which the alignment of each plane relative to the base
plane will be calculated. It is recommended to define it as a minimum rectangular region
in the image that contains pronounced spatial heterogeneities, such as a cell or a group
of cells.
Close the Alignment mass GUI and select the identification number of the base
11
Figure 6: GUI for the selection of accumulated planes and alignment region.
plane, b. Check Align images when accumulating and select Accumulate plane images
to start drift-corrected plane accumulation (Fig. 1A–B). For a given plane l, the
l
optimum alignment relative to the base plane b is defined as such a translation Txy
by
a whole number of pixels in the x and y directions that minimizes the sum
N h
X
l
µbi − Txy
µl
i=1
i2
i
,
(1)
where N is the number of pixels in the alignment region, and µl is the base mass image in
plane l normalized such that its mean and variance over that region is 0 and 1, respectively.
The accumulation progress is displayed in the Matlab’s command window. After successful completion of this step, the alignment information is automatically stored in the
xyalign.mat file (Fig. 2B), and will be used for future accumulations of the same
dataset, if reopened in the program. Remove the xyalign.mat file from disk prior to
accumulation if you wish to generate a new alignment.
5.4
Display of accumulated mass images
Select Autoscale accumulated images to update the scale fields with the optimum scale
for displaying the accumulated mass images. For each detected mass, the optimum scale
is calculated as the 0.1 and 99.9 percentile of the accumulated ion counts in all pixels.
12
Alternatively, specify the scale manually as [min max]. The scale is not changed
when a new dataset is loaded.
Select Display accumulated images for all masses to view images of accumulated
ion counts for the detected masses (Fig. 7). Verify the alignment quality by visually
inspecting the sharpness of distinct features in the images.
Figure 7: Display of accumulated mass images.
5.5
5.5.1
Graphical output I
Accumulated mass images
To display accumulated masses with publishing quality (Fig. 8), deselect all options
in the Output options box except the Display images option, and select Display masses
from the Output menu. A particular mass is displayed if its corresponding checkbox is
checked.
5.5.2
Ratio images
To display ratio images with publishing quality (Fig. 9), deselect all options in the
Output options box except the Display images option, and select Display ratios from the
Output menu. A particular ratio is displayed if its corresponding checkbox is checked.
The formula for calculation of the ratio image is specified in the expression box. It can
be any valid arithmetic expression, e.g., 13C/12C to calculate a simple mass ratio,
13
19F
13C
0
5
10
15
20
25
0
log(12C15N)
12C14N
3 µm
3 µm
3 µm
3 µm
10
20
30
40
50
60
70
0
500
1000
1500
2000
2500
3000
0
0.5
1
1.5
2
Figure 8: Display of masses in publishing quality.
13C/(12C+13C) to calculate the natural abundance of 13 C, 1000*(13C/(12C+13C)-0.01)
to calculate the 13 C enrichment relative to a standard (here the natural abundance of
0.01) in per-mil, 32S/size to calculate the “concentration” of a specific mass in the ROI
(i.e., total counts normalized to the ROI size). The scale is specified by entering [min
max] in the corresponding scale field. When the scale is changed and enter is pressed,
the image is displayed immediately (i.e., without selecting Display ratios from the Output
menu) using the given scale, allowing rapid optimization.
Use the following additional options to customize the display of accumulated ion images
and ratio images: By checking the corresponding B/W checkbox, the image is exported as
a black-and-white TIF image. By checking the Log10-transform checkbox, the image
is displayed in a log10-transformed scale (in this case the minimum scale should not
be 0). By checking the Include ROI outlines, the outlines of defined regions of interest
(see Sec. 5.6) will be included in the image. The color of the ROI outline is specified
in the corresponding field (w for white, r for red, b for blue, g for green, k for black).
Additionally, the width of the ROI outline can be specified by adding the line-width
(in pixels) after the line color (e.g., w1.5 for a white outline of thickness 1.5 pt). By
checking Zero values outside ROIs, all pixels that do not belong to defined ROIs will be
displayed in black. Use this last option wisely and not to hide unwanted information!!!
By checking the Graph/image title checkbox, the title containing the file name and the
ratio string will be automatically added to the displayed image. If you wish to exclude
the file name from the title, type space in the title field.
14
13C/12C
log(12C15N/12C14N)
3 µm
0.01
19F/12C
3 µm
0.02
0.03
0.04
0.05 −2.4
3 µm
−2.2
−2
−1.8
−1.6
−1.4
0
0.02
0.04
0.06
0.08
0.1
Figure 9: Display of ratios in publishing quality.
5.5.3
Composite RGB images
Select Combine images as RGB to combine specific mass or ratio images in a composite RGB image (Fig. 10). The images that should be combined are specified by
entering their identification numbers in the corresponding fields for the R, G and B colors. When pixel by pixel is selected, the images are combined without modification,
whereas values averaged over each ROI are used when the option Averaged over
ROIs is selected. The contrast and saturation of each individual color can be modified by
changing the scale of the corresponding image. A specific color is not used if the corresponding field is left empty. If you want to combine mass image with ratio images, enter
the mass name into one of the expression fields and enter the corresponding identification
number in one of the color fields.
Figure 10: Display of ratios as composite RGB images.
15
5.5.4
EPS and PDF output
Select Export EPS/PDF graphics while displaying the mass or ratio images to export
the images as EPS and PDF graphics. Note that LATEX installation is required to enable
PDF export.
5.6
ROI definition
Type the name of the image that should be used as template for the definition of
regions of interest (ROIs) in the ROI definition template field. This can be any of
the accumulated mass images (e.g., 12C14N, 19F), a ratio image derived from the mass
images (e.g., 13C/12C, 19F/(12C+12C)), an RGB composite image constructed from the
ion (rgb1) or ratio (rgb2) images, or an external image (ext). The external image can be
any bitmap image stored in a common graphics format (e.g., TIF or PNG). Alignment
between the external and ion images is done as described in Sec. 5.6.1.
Figure 11: GUI for interactive ROI definition. In this case, a composite RGB image is used as template.
For all alternatives, the selected template image can optionally be smoothed before it is
used for ROI definition. Smoothing is done using a median filter with the two-dimensional
kernel size specified in the Smoothing kernel field (in pixels). This will result in generally
smoother ROI outlines when defined using the interactive thresholding method for ROI
definition (see below). If you do not wish to do image smoothing before ROI definition,
use [1 1] as the smoothing kernel.
16
Select INTERACTIVE ROIs definition tool from the ROIs menu to start a GUI dedicated
to ROI definition (Fig. 11). First, select the ROI file and ROI classification file, if these
have been previously created, or press Cancel if these files do not exist. Subsequently use
the Action menu to define ROIs.
The most basic way to define ROIs is to draw them freehand. This is done by selecting
Draw ROIs freehand from the Action menu. Draw the ROI outline with the cursor
while keeping the left mouse-button pressed. Release the button when finished drawing.
Optionally move the ROI outline in x and y directions using mouse. Double-click
on the ROI to confirm its final position. Afterwards, specify whether the ROI outline
should be defined as the (coarse) polygon drawn or as an ellipse that circumscribes this
polygon. To enable or disable questions about the type of ROI outline (polygon versus
circumscribed ellipse), check the relevant option in the Freehand ROI options menu.
An alternative to free-hand ROI drawing is to draw them as ellipses or rectangles,
which is done by selecting the corresponding item from the Action menu. After each
drawing, the ROI can be moved and resized before its final position is confirmed by
double-clicking.
When the contrast between the background and the signal used for ROI recognition is
high, interactive thresholding is the preferred method for ROI definition due to its
speed and reproducibility. After selecting Interactive thresholding from the menu,
click with the left mouse-button on the image to automatically select a ROI that extends
over pixels whose values do not fall below the value in the selected (clicked) pixel multiplied by a threshold value. The threshold value is 0.5 by default, but can be increased
or decreased interactively by pressing the ‘up’ or ‘down’ arrow key, respectively. If a new
pixel is selected, the ROI is automatically redrawn according to the current threshold,
allowing rapid optimization. This procedure leads to a ROI in the shape of a polygon. By
pressing the ‘left’ or ‘right’ arrow key, an ellipse circumscribing this polygon is drawn instead, and its axes can be decreased or increased by further pressing the respective arrow
key. Press Esc to cancel the current interactive ROI definition, or Enter to confirm ROI
position. Once confirmed, the ROI is defined as pixels that are inside the drawn polygon
(ellipse), including the edge. Note that every ROI drawing by interactive thresholding
must be terminated by pressing Esc or Enter, otherwise the program will proceed in
an unexpected way. When using an RGB image as template for ROI definition, the color
channel used for automatic ROI drawing can be changed to red, green or blue through
the Select interactive channel menu.
Any previously defined ROI can be split by a line that is drawn through the ROI, which
is done via Split ROIs by line in the Action menu. Any previously defined ROI can be
removed by selecting Remove ROI interactively. Use a left-mouse click on the ROI
to select it for removal and the right-mouse click to remove it. Select Remove multiple
ROIs from the menu to remove several ROIs at once, whereby the identification
17
numbers of the unwanted ROIs should be entered in the Matlab’s command window.
Select Combine multiple ROIs into one from the menu and enter ROI identification
numbers in the Matlab’s command window to combine specific ROIs into one. If the
most recently defined ROI overlaps with one or more of the ROIs defined previously,
the overlapping pixels will belong to the most recently defined ROI. Thus, to draw a
ROI with a “hole”, draw the bigger ROI first, followed by the drawing and removal of
the smaller ROI.
If the ROI classification file (see section 5.9) was defined and selected before ROI
definition, it is automatically updated upon every ROI addition or removal, provided
that the option Automatically update classification file is checked.
Select Display ROIs to display currently defined ROIs, and Save ROIs to save them to
disk. It is recommended to use the default file name cells.mat. This will facilitate rapid
post-processing of different datasets in a later stage of the analysis (see Sec. 5.11).
Interactive ROI definition is completed by quitting the GUI and exporting the ROI
outlines via Export ROIs image from the ROIs menu. This step will display and export ROI outlines together with automatically assigned identification numbers
(Fig. 12). These numbers will be used throughout the rest of the analysis for identification of each ROI. Previously defined and saved ROIs can at any time be loaded via Load
ROIs from disk.
To translate defined ROIs in x and y direction, specify the corresponding number of
pixels in the x and y fields below the Translate ROIs option, check the Translate ROIs
checkbox and select Translate ROIs by x and y from the ROIs menu.
Figure 12: Exported ROI outlines together with unique identification numbers.
5.6.1
ROI definition based on an external image
Type ext in the ROI definition template field to allow ROI definition based on an external
image as template. Before the ROI definition can proceed, the external image must
18
be aligned, which is done in a dedicated GUI (Fig. 13A) accessed via ROIs → Align
external template image (Fig. 1C).
A
B
D
C
Figure 13: Exported ROI outlines together with unique identification numbers.
First, select the external image via File → Load external image (Fig. 13B). This can
be a bitmap image in any common format, such as TIF, PNG, etc. Beforting importing
the external image, it is recommended to crop it in a third-party image processing program
such that it is slightly larger (but not too large) than the field of view captured in the
nanoSIMS image. If necessary, the cropped image can also be rotated by ±90 or 180
degrees to improve its resemblance to the nanoSIMS image.
Second, select the nanoSIMS image that will be used as template for alignment via
File → Load nanosims image (Fig. 13B). This can be any accumulated image that has
been stored in the Matlab format (extension mat, stored in the mat sub-directory)
during the previous steps of the analysis (see Sec. 5.5).
Subsequently, use the Action menu to define reference points that correspond to each
other in both images (Fig. 13C). Proceed by adding a point in the external image, followed
by the addition of the corresponding point in the nanoSIMS image. Use left-mouse click
to define the point’s position and right-mouse click to confirm it. If the reference points
were defined incorrectly, remove them before proceeding with another pair of points. Use
Action → Show alignment to visually inspect the alignment quality (Fig. 13D).
19
When satisfied with the alignment, save the list of reference points via File →
Save point list and export the aligned external image via Action → Export aligned
external. This will generate a TIF file of the aligned external image as well as of its
overlay with the nanoSIMS image. Both of these images can subsequently be used as
template for ROI definition, which proceeds as described above (Sec. 5.6).
5.7
Text output
Export of ion counts and ion ratios in ROIs in a tabulated format is done by selecting
Display masses and Display ratios in the Output menu, respectively, and selecting the
option Export ASCII data in the Output options box. With these settings, ion counts
accumulated over all ROI pixels and over all selected planes, as well as ratios derived
from these accumulated ion counts (see below), are saved in files with extension .dac in
the dat sub-directory. If the Display depth profiles in ROIs option is selected, the results
are additionally displayed as depth profiles and exported in files with extension -z.dat
(Fig. 2B).
When exporting depth profiles, ion counts in plane l and ROI k are calculated as
mkl
=
Pk
X
Mil ,
(2)
i=1
where Mil is the ion count per dwelling time for mass M in pixel i and plane l, and Pk is
the number of pixels in ROI k. The mean ratio (Fig. 14A) of masses M and N in plane
l and ROI k is calculated as
rlk = mkl /nkl ,
(3)
while the Poisson percentage and standard errors of the mass ratio are calculated
from
q
(4)
δ(rlk ) = 1/mkl + 1/nkl × 100%,
P E(rlk ) = rlk δ(rlk )/100%.
(5)
Poisson errors represent a theoretical precision of the mean, derived from the fact
that the count of ions detected during dwelling time is a random variable with Poisson
distribution (Cameca, WinImage User’s Guide v 2.0.8, p. 82).
The depth profile output additionally contains the result of a test for a significant
trend with depth (Fig. 14A). This is obtained by fitting the values of mkl (Eq. 2)
and rlk (Eq. 3) with a polynomial of order POL, and testing whether the variance of fit
residuals is significantly lower than the variance of the original values. Maximal tested
value of POL is 5. The significance testing is done using Levene’s test (default significance
level α = 0.05). POL > 0 indicates significant trend with depth, whereas POL = 0
indicates no significant trend with depth.
20
A
B
C
Figure 14: Examples of data files exported by Look@NanoSIMS. (A) Depth profiles of 13 C/12 C ratios. (B) Accumulated
ion counts. (C) 13 C/12 C ratios calculated from accumulated 13 C− and 12 C− ion counts.
12 C14 N−
When exporting values derived from total ion counts accumulated over all selected
planes, the ion counts in ROI k (Fig. 14B) are calculated as
mk =
L
X
mkl ,
(6)
l=1
where mkl is calculated by Eq. 2 and L is the number of selected planes. Furthermore,
the mean ratio of masses M and N in ROI k (Fig. 14C) is calculated as
rk = mk /nk ,
(7)
whereas the Poisson percentage and standard error are calculated as
k
δ(r ) =
q
1/mk + 1/nk × 100%,
P E(rk ) = rk δ(rk )/100%.
(8)
(9)
Additionally to these values, the exported dac file contains information about the ROI
position, size and shape (Fig. 14C). The size is given both as the amount of pixels in
the ROI and as the diameter of a circle (in µm) with the equivalent amount of pixels
as the ROI. The shape is expressed as the ratio between the long and short axes of the
ellipse circumscribing the ROI.
5.8
5.8.1
Graphical output II
Histograms
To display histograms of ion counts and ion ratios in pixels that belong to ROIs (Fig. 15,
left), check the Display histograms option and select Display masses and Display ratios
from the Output menu, respectively. If ROIs have been classified (see section 5.9), the
histograms are constructed separately for each ROI class (Fig. 15, right).
21
5.8.2
Depth profiles
To display depth profiles of ion counts (Eq. 2) and ratios (Eq. 3) for each defined ROI,
check the Display depth profiles in ROIs option and select Display masses and Display
ratios from the Output menu. The depth profiles are plotted together with error-bars
that correspond to the Poisson standard error (Eq. 5). Additionally, fitting polynomials are also displayed when a significant trend with depth is detected. Depth
profiles in multiple ROIs can be displayed and exported in a dedicated GUI (Fig. 16).
Figure 15: Examples of histograms of ratios in ROIs.
A
B
Figure 16: GUI for ploting depth profiles of masses (A) and ratios (B) in selected ROIs.
5.8.3
Lateral profiles
To display ion counts (Eq. 2) and ratios (Eq. 3) along a lateral profile, check the
Display lateral profiles option and select Display masses and Display ratios from the
Output menu. In the provided GUI (Fig. 17), define the profile by clicking Define lateral
profile and selecting the starting and ending points, and specify the width of the profile
(in pixels). Click on Display lateral profiles to display the profile for the selected mass
or ratio in a separate window or for all masses or ratios in a single window (Fig. 17). If
22
Figure 17: GUI for ploting lateral profiles of masses or ratios.
the profile width is greater than 1, the standard deviation of the values derived from the
pixel values over the profile width can also be displayed. The profiles can optionally be
exported in a text and graphical format by checking the Export lateral profile as ASCII
& EPS checkbox.
5.8.4
Scatter plots
To display scatter plots of ion ratios in ROIs (Eq. 7), check the Plot x-y-z graph option
and select Display ratios from the Output menu. The mean ratios in ROIs are displayed
together with error-bars that correspond to the Poisson standard error (Eq. 9). The
ratios that should be displayed are specified by entering their identification numbers in the
corresponding x, y and z fields in the Output options box. If ROIs have been classified,
the different classes are displayed with different symbols and colors (Fig. 18).
5.8.5
PDF output
Select Generate LaTeX + PDF output from the Output menu to generate a summary
of the results obtained during the analysis of a single nanoSIMS dataset. The graphical and text-based outputs are stored under default file names outputG.pdf and outputT.pdf, respectively. The types of images and graphs included in the graphical output are specified by selecting the corresponding Output options. Note that installation
of LATEX is required to enable this feature. An example of a PDF file generated by this
function can be downloaded from http://www.microsen-wiki.net/doku.php?id=lans.
23
Figure 18: Examples of 2D and 3D scatter plots.
5.9
ROI classification
ROI classification is done after ROI definition by selecting Classify ROIs in the ROIs
menu. ROI classes are defined by names that are one-character long (e.g., a, b, c,
etc.), and stored in a text file with the recommended name cells.dat (Fig. 19C).
When the number of ROIs is low, classification is best done manually. First, display
the outlines of the currently defined ROIs by selecting Export ROIs image from the ROIs
menu (Fig. 12). Subsequently, select Manually (ROI by ROI) from the ROIs menu, and
assign a class name to each ROI identification number in the provided GUI (Fig. 19A).
Pay attention that the number of classified ROIs is the same as the number of defined
ROIs. Save the classification file to disk when done (Fig. 19C).
A
C
B
Figure 19: GUI for manual (A) and automated (B) ROI classification. (C) Examples of ROI classification file cells.dat.
When the number of ROIs is large and the classification conditions can be formulated by a logical expression, ROI classification can be done automatically. First,
display and export ROI ratios in a scatter plot to identify the classification conditions
(Fig. 18). Subsequently, select Classify ROIs → Automatically (based on conditions)
from the ROIs menu. In a dedicated GUI (Fig. 19B), associate data exported as described in Sec. 5.7 with one of the classification variables (x, y or z). This is done by
24
selecting the filename containing the data (e.g., a 19F-(12C+13C).dac file containing the
19
F/(12 C + 13 C) ratios) and specifying which data column should be considered as the
classification variable (usually mean or size). This can be done for up to 3 independent
variables. Subsequently, specify the classification conditions in the Condition fields
using Matlab-like syntax (characters & and | represent logical AND and OR, respectively), and the (single-character) names of the classes. During classification, invoked
by clicking Classify ROIs, the assignment to classes is done sequentially: all ROIs for
which condition 1 is satisfied are assigned to the first class, all ROIs for which condition
2 is satisfied are assigned to the second class, irrespective whether some of them may
have been already assigned to the first class, etc. ROIs that have not been assigned to a
class by any of the specified conditions are by default assigned to class otherwise. Save
the automatically generated ROI classification file to disk under the recommended name
cells.dat (Fig. 19C). Classification can be verified in the GUI for manual classification
(see above).
5.10
Statistical comparison of ROIs and ROI classes
Check the Compare ROIs option and select Display ratios from the Output menu in
the main GUI to perform statistical comparison of ROIs for a currently analyzed
dataset. Similarly, select Compare ROIs or Compare ROI classes from the Tools menu
during metafile processing (see Sec. 5.11) to compare ROIs and ROI classes from
multiple datasets. A dedicated GUI offers statistical tests that can be performed for
three levels: individual ROIs, ROI classes, and treatments (Fig. 20A–C).
Comparison of ROI classes and treatments takes the mean ratios rk , calculated from
the total ion counts accumulated over ROI pixels over all selected planes (Eq. 7), as a basis
for comparison. In contrast, comparison of individual ROIs is done based on the perplane ratios rlk , calculated from ion counts accumulated over ROI pixels in each plane
(Eq. 3). The latter is based on the assumption that rlk represent independent replicate
measurements of the ratio in the object that the ROI represents. This assumption can
be verified by plotting the ratio’s depth profile (see Sec. 5.8.2). If rlk exhibit a significant
trend with depth, it is likely that they originate from more than one type of object in
the sample (e.g., a cell lying on top of a filter, or of another cell with different isotopic
composition) and are therefore not justified as a basis for ROI comparison.
For each comparison level, homogeneity of variance is tested using Levene’s test,
whereas significant differences between means are tested using Kruskal-Wallis and
ANOVA tests. All tests employ the default significance level α = 0.05. To identify
which ROIs, ROI classes or treatments are significantly different from the others, the
Kruskal-Wallis and ANOVA tests are coupled to a multiple comparison procedure
based on Tukey tests. This analysis assigns to each tested ROI, ROI class or treatment
25
a pair of ranks that allow its comparison with the other ROIs, ROI classes or treatments
(Fig. 20D). For example, assuming that ROI classes c1 and c2 were assigned pairs of ranks
c2
c1
c2
c1
Rmax
], respectively, their comparison is interpreted as follows: the
Rmax
] and [Rmin
[Rmin
c2
c1
inequality Rmax < Rmin means that the mean ratio hrc1 i for ROIs in class c1 is significantly
greater than the mean ratio hrc2 i for ROIs in class c2 , whereas the mean ratios hrc1 i and
c2
c1
.
hrc2 i do not significantly differ within the instrumental precision if Rmax
≥ Rmin
A
B
C
D
Figure 20: GUI for statistical analysis of individual ROIs (A), ROI classes (B) and treatments (C). (D) Example of the text-based
output generated by the statistical analysis.
Individual ROIs are usually compared to identify heterogeneity of substrate uptake
by cells within a specific population. To do this, select ROIs in the Compare pulldown menu of the GUI dedicated to statistical analysis, check the class for which ROIs
should be compared, check one treatment, select the type of test that should be performed
and the ratio based on which ROIs should be compared, and click on Run test. The
graphical representation of the results of the test is displayed in the graph (Fig. 20A),
with a more detailed description listed in the Matlab’s command window. To export the
test results, click on Export results. This will generate a text file in the tests directory
containing various types of statistics calculated for each ROI, including the mean, 95 %
confidence interval of the mean, standard error of the mean and ROI ranking [Rmin Rmax ].
Furthermore, this will also export the graphical representation of the result as an EPS
26
graphics in the eps directory.
ROI classes are usually compared to test for differences in substrate uptake between
cell populations. To do this, select Classes in the Compare pull-down menu of the GUI
dedicated to statistical analysis, check multiple classes that should be compared, check
one treatment, select the type of test that should be performed and the ratio based on
which classes should be compared, and click on Run test. The graphical representation
of the results of the test is displayed in the graph (Fig. 20B), with a more detailed
description listed in the Matlab’s command window. To export the test results, click on
Export results. This will generate a text file in the tests directory containing various
types of statistics calculated for the compared classes, including the mean, 95 % confidence
interval of the mean, standard error of the mean and class ranking [Rmin Rmax ] (Fig. 20D).
Furthermore, this will also export the graphical representation of the result as an EPS
graphics in the eps directory.
Comparison of treatments is usually done to test for differences between the incubated and control samples or between incubation time-points. To do this, select
Treatments in the Compare pull-down menu of the GUI dedicated to statistical analysis,
check multiple treatments and one class that should be compared, select the type of test
that should be performed and the ratio based on which the selected treatments should
be compared, and click on Run test (Fig. 20C). The rest of the analysis proceeds as
described for the comparison of ROI classes above.
5.11
Metafile processing
The above described routines allow processing of data and export of results for one
dataset. The purpose of metafile processing is to rapidly combine and statistically
analyze results from multiple datasets. Note that each of the datasets must have been
processed before it can be included in metafile processing.
First, choose Generate processing metafile from the Post-processing menu of the main
GUI to open a GUI dedicated to the definition of a metafile with processing “instruction” (Fig. 21A). In this GUI, define the dataset name by selecting the corresponding
directory that contains the processed information generated by steps described above.
Subsequently, specify the treatment identification number for this dataset (this can correspond, e.g., to a time-point in the incubation experiment), ROI classes (single-character
class names, or * for all classes), and click Add data set. Do this for all datasets that you
want to be combined and processed together. Subsequently, define variables that should
be processed. These can be mass ratios (e.g., 13C/12C or 12C15N/12C14N) or any other
value calculated and stored in the dac files (e.g., ROI size, x and y position; see Sec. 5.7).
Finally, save the metafile instructions in a text file. Although metafile definition is more
intuitive using the dedicated GUI, the metafile can also be generated in any text editor.
27
B
A
C
Figure 21: GUI for the definition (A) and processing (B) of metafile instructions. (C) Types of metafile processing functions
offered by the Look@NanoSIMS program.
Metafile processing is done in a dedicated GUI accessed via Post-processing → Process
metafile from the main GUI (Fig. 21B). First, select the base directory where all single
processed datasets are stored. Second, select the file with metafile instructions. Third,
specify the names of the files that contain information about ROI outlines (cells.mat by
default) and ROI classes (cells.dat by default). Finally, specify parameters for controlling
the appearance of the graphs and images that will be generated by metafile processing,
such as the title, scaling, color and symbol schemes, etc.
Select Plot and export data from the Tools menu (Fig. 21C) to extract and merge all
results that have been generated for the datasets listed in the metafile. These results
will be plotted in scatter graphs (Fig. 18), and exported in a single text file that
can be used for further processing by a third-party software.
Select Compare ROIs and Compare ROI classes from the Tools menu (Fig. 21C) to
perform statistical comparison of ROIs and ROI classes for all datasets in the
metafile. The types of analysis are the same as those available during the statistical
analysis of results obtained for a single dataset (see Sec. 5.10; Fig. 20). Note that because
this comparison relies on the results generated during processing of single datasets (e.g.,
depth profiles of ratios, ratios derived from accumulated ion counts, ROI classification),
this information must exist for each dataset listed in the metafile.
Choose one of the Export PDF functions in the Tools menu (Fig. 21C) to generate
a PDF file with an overview of results from multiple datasets. Mass and ratio
images from all datasets listed in the metafile will be combined in a single PDF file by
28
selecting Export images for all masses and ratios as PDF, whereas separate PDF outputs
will be generated for the processed variables (see metafile definition above) if Export
images for each variable as PDF is selected. By selecting Export plots & tests as PDF,
all 2D and 3D graphs as well as graphical representations of the statistical tests that
were generated by metafile processing will be combined in a single PDF file. Note that
installation of LATEX is required to enable this feature.
29