1
INTREPID User Manual
Library | Help | Top
Grid Stitch—combining two grids (T23)
1
| Back |
Grid Stitch—combining two grids (T23)
Top
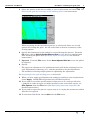
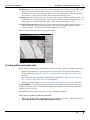
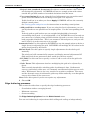
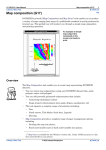
We have created the INTREPID Grid Stitch tool mainly for appending a grid to
another geographically adjacent grid. It has facilities for smoothing the join between
the grids so that it does not appear as a discontinuity during further visualisation
and geophysical analysis. You can also use Grid Stitch facilities for general viewing
of data profiles along any path traced through the grid.
Using the Grid Stitch tool you can:
•
View a grid or a pair of geographically adjacent grids showing their respective
borders and overlap areas and/or data gaps, using pseudocolour or sun angle.
•
Trace a path through the grids and view a graph showing:
•
The data values for each grid separately.
•
The differences between the data values of the two grids.
•
Adjust one of the grids along the junction with the other grid so that the grids can
be joined smoothly.
•
Save either the adjusted grid or the new stitched grid.
The Grid Stitch tool
>> To use Grid Stitch with the INTREPID graphic user interface
Library | Help | Top
1
If required, prepare your grids for minimal resampling using the Grid Operations
tool. See Preparing grids to avoid resampling for instructions.
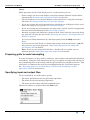
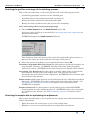
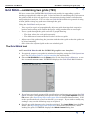
2
Choose Old GridStitch from the Betas menu in the Java Project Manager, or use
the command stitch.exe. INTREPID displays the Grid Stitch Main window.
3
If you have previously prepared file specifications and parameter settings for Grid
Stitch, load the corresponding task specification file using Load Options from the
File menu. (See Specifying input and output files for detailed instructions.) If all
of the specifications are correct in this file, go to step 8. If you wish to modify any
settings, carry out the following steps as required.
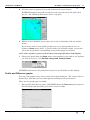
4
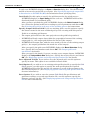
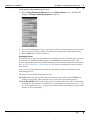
Specify two grid datasets to be viewed or stitched. Use Load Grids from the File
menu. (See Specifying input and output files for detailed instructions.) After
loading the grids, INTREPID displays the Stitch Control dialog box.
© 2012 Intrepid Geophysics
| Back |
INTREPID User Manual
Library | Help | Top
5
Grid Stitch—combining two grids (T23)
2
| Back |
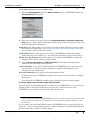
Select the options in this box according to your requirements and choose OK. See
Selecting the grid for each stage of the stitching process for instructions.
While preparing for the Grid Stitch process, or afterwards, there are several
options for viewing the grids. See the end of this section for a summary of the
viewing options.
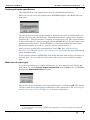
6
Specify the filename(s) for the grid(s) be created during this process. From the
File menu, choose Specify Output Stitched Grid to save the new combined grid
after stitching the grids. (See Specifying input and output files for detailed
instructions.)
7
Optional - From the File menu, choose Save Adjusted Grid As to save the grid to
be adjusted.
8
Specify:
•
The type(s) of adjustment to be performed on the grids before stitching (level or
scale adjustment, feathering, etc.,), and the parameters for the adjustments
•
The method of selecting sample points for optimising the adjustment.
See Preparing for the grid stitching process for details.
9
When you have made specifications and settings according to your requirements,
choose Apply. INTREPID will perform the Grid Stitch process.
10 If you wish to record the specifications for this process in a task specification
(.job) file in order to repeat a similar task later or for some other reason, use
Save Options from the File menu. (See Specifying input and output files for
detailed instructions.)
11 If you wish to repeat the process, repeat steps 3–8, varying the parameters and/or
data files as required.
12 To exit from Grid Stitch, choose Quit from the File menu.
Library | Help | Top
© 2012 Intrepid Geophysics
| Back |
INTREPID User Manual
Library | Help | Top
Grid Stitch—combining two grids (T23)
3
| Back |
Notes:
While preparing for the Grid Stitch process, or afterwards, you can
•
Zoom (enlarge an area of the display) and pan (examine different regions while
enlarged) (See Zooming and panning the display for details).
•
Choose whether to view the grid display in pseudocolour or using the sun angle
effect (See Selecting pseudocolour or sun angle display).
•
If you are viewing the grid in pseudocolour, spread the set of display colours over a
data value range set by you (See Pseudocolour display).
•
If you are viewing the grid using the sun angle effect, specify vertical exaggeration
and sun inclination/declination (See Sun Angle display).
•
Examine a graph of the differences between data values from the two grids along
any path traced using the mouse (See Querying the dataset—viewing profile and
difference graphs).
You can view Help information by choosing options from the Help menu (See
Help).
You can execute Grid Stitch as a batch task using a task specification (.job) file
that you have previously prepared. See Displaying options and using task
specification files for details.
Note: If you are executing Grid Stitch as a batch task, you cannot save an
adjusted grid (See Specifying input and output files for details.
Preparing grids to avoid resampling
In some situations you may wish to combine a pair of grids with minimal Grid Stitch
resampling. Using the Grid Operations tool you can specify an origin and cell size for
the resampled grid so it fits neatly with the grid to which you intend to stitch it. This
will reduce or eliminate the need for resampling during the Grid Stitch process.
See "Preparing grids to avoid Grid Merge or Stitch tool resampling" in Grid
Operations (T25) for instructions.
Specifying input and output files
To use Grid Stitch, you will need to specify:
•
The input grid datasets for the grid stitch operation
•
The name for the adjusted grid (optional)
•
The name for the output stitched (combined) grid
Choose the options as required from the File menu.
Library | Help | Top
© 2012 Intrepid Geophysics
| Back |
INTREPID User Manual
Library | Help | Top
Grid Stitch—combining two grids (T23)
4
| Back |
In each case INTREPID displays an Open or Save As dialog box. Use the directory
and file selector to locate the file you require. (See "Specifying input and output files"
in Introduction to INTREPID (R02) for information about specifying files).
Load Grids Use this option to specify the grid datasets for the stitch process.
INTREPID displays an Open dialog box for each one. INTREPID will load the
first band (band 1) of multiband grids.
After you have specified the grids, INTREPID displays the Stitch Control dialog
box. Select the options in this box according to your requirements and choose OK.
See Selecting the grid for each stage of the stitching process for instructions.
Specify Output Stitched Grid If you are stitching grids, use this option to specify
the dataset name for the new combined grid you are creating with this process.
If this is an existing grid dataset,
•
The output grid must have the same projection as the grids being stitched;
•
INTREPID will only output data within the geographical extent of the existing
output grid (i.e., the output grid defines the extent of the output);
•
INTREPID will output data with the same mesh (cell) size as the existing output
grid (i.e., the output grid defines the mesh size of the output).
After you specify the grid name INTREPID displays the Band Selection dialog
box. Specify the band numbers and choose OK. See Output grid bands
specification for details.
After you specify the bands, if you are creating a new output dataset, INTREPID
displays the Output Mesh Size dialog box. Specify the mesh (cell) size and choose
OK. See Displaying options and using task specification files for details.
Save Adjusted Grid As If you wish to save the adjusted grid, use this option to
specify its name. This option is not available in batch mode.
Load Options If you wish to use an existing task specification file to specify the Grid
Stitch process, use this option to specify the task specification file required.
INTREPID will load the file and use its contents to set all of the parameters for
the Grid Stitch process. (See Displaying options and using task specification files
for more information).
Save Options If you wish to save the current Grid Stitch file specifications and
parameter settings as an task specification file, use this option to specify the
filename and save the file. (See Displaying options and using task specification
files for more information).
Library | Help | Top
© 2012 Intrepid Geophysics
| Back |
INTREPID User Manual
Library | Help | Top
Grid Stitch—combining two grids (T23)
5
| Back |
Output grid bands specification
The Grid Stitch tool can output to any band of a multiband grid dataset.
When you specify an output grid file name INTREPID displays the Band Selection
dialog box.
Use this dialog box to specify the number of bands for the grid, and which band you
intend to process (the current band). The band information consists of two numbers
separated by /. The first number is number of bands in the grid. The second number
is the band number for the current grid. Before INTREPID v3.7 the grid bands were
numbered starting from 0. For INTREPID v3.7 the band numbering starts from 1.
The default number of bands is 1, and the default current band is 1.
After you have specified the band numbers, choose OK. See "Multiband grid
datasets" in INTREPID database, file and data structures (R05) for more information
about multiband grids.
In the current version of INTREPID, Grid Stitch will only load and process band 1 of
an input grid. You can still save the results of the process to any band of another
grid.
Mesh size of output grid
If you have specified a new output grid dataset, you can choose the cell size for this
grid. After you choose Specify Output Stitched Grid from the File menu, INTREPID
displays the Output Mesh Size dialog box.
Specify the cell size in distance units (normally metres)11 and choose OK. The default
cell size is that of the input grid providing data in the overlap area. See Selecting the
grid for each stage of the stitching process for more information.
1.1 If your dataset is geodetic (latitude and longitude) you need to specify the Grid Cell
Size in degrees.
Library | Help | Top
© 2012 Intrepid Geophysics
| Back |
INTREPID User Manual
Library | Help | Top
Grid Stitch—combining two grids (T23)
6
| Back |
Mouse mode summary
Grid Stitch has a variety of mouse operations, determined by the mouse mode options
located at the bottom of the Main window Command area.
>> To select a mouse mode
Select the corresponding Mouse mode option button.
Zoom Using this mode you can define rectangular regions for zooming the data
display. See Zooming and panning the display for details.
Trace query path Using this mode you can trace a path through the display for
viewing profile graphs of the data along the path. See Querying the dataset—
viewing profile and difference graphs for details.
Trace zip path There are several ways to select sample data for optimising the grid
adjustment. Using this mode you can trace a path to specify the data in the
overlap area to be used for this purpose. See Tracing a path for the overlap
sample data (Zip path) for details.
Digitise control Using this mode you can mark control points in the display. See
Specifying the adjustment calculation for details.
Grid Stitch display controls and options
The Grid Stitch tool has a large range of display controls. These are provided to
assist you with
•
Detecting problems such as line-to-line levelling differences ('busts')
•
Evaluating the effectiveness of the feathering process in the join area.
Screen redrawing
If you change a display option INTREPID may not immediately redraw the screen.
This is because redrawing large datasets takes some time and INTREPID can
respond better if it sometimes allows you to you specify several display options before
redrawing.
>> To trigger a screen redraw
Library | Help | Top
•
Click the pan/zoom indicator square in the Command area or
•
Change the size of the Grid Stitch window slightly by dragging its border.
© 2012 Intrepid Geophysics
| Back |
INTREPID User Manual
Library | Help | Top
Grid Stitch—combining two grids (T23)
7
| Back |
Zooming and panning the display
You can enlarge and reduce the display (zoom in and out) and view different parts of
it (pan).
>> To zoom in and out (enlarge/reduce) by steps
To zoom in (enlarge the display) choose Zoom In at the right edge of the Grid Stitch
Main window. Each time you choose this button, INTREPID will enlarge the display
by 25%.
To zoom out (reduce the display) choose Zoom Out at the right edge of the Grid Stitch
Main window. Each time you choose this button, INTREPID will reduce the display
by 25%.
>> To zoom in on a selected area of the display,
1
Select Zoom mouse mode
2
Hold down the left mouse button and drag diagonally (corner to corner) across the
area that you wish to enlarge. INTREPID will enlarge the selected region to fill
the display area of the window.
If you choose Zoom Out, having used this zoom in process, INTREPID will
immediately zoom out to the full dataset display.
>> To pan the display (view different parts)
The Pan/zoom indicator in the Command area of the Grid Stitch Main window in the
centre consists of a small square within a larger square. The large square represents
the whole display and the small square the part visible on the screen. When you drag
the small square to a different part of the large square INTREPID shows the
corresponding part of the display.
If you have zoomed out to view the whole display, the small square may occupy the
whole of the large square and may therefore not be visible.
Library | Help | Top
© 2012 Intrepid Geophysics
| Back |
INTREPID User Manual
Library | Help | Top
Grid Stitch—combining two grids (T23)
8
| Back |
Showing grid outlines
You can choose whether to display the outlines of the grids. To turn outlines display
on or off, choose the Show Grid Outlines option in the Display menu. It has a check
mark against it when outline display is on.
>> To turn outlines display on or off,
Choose Show Grid Outlines from the Display menu. It has a check mark against it
when outline display is on.
INTREPID displays the first grid outline in red and the second grid outline in white.
Selecting pseudocolour or sun angle display
You can select pseudocolour or sun angle display for the grids. INTREPID initially
uses pseudocolour.
Use the Pseudocolour / Sun Angle options from the Display menu to specify your grid
display method.
Pseudocolour display
If you choose pseudocolour display without modifying the Low Clip and High Clip
parameters INTREPID will apply a fixed range pseudocolour display to your grid.
This involves dividing the range of cell values in your grid into equal parts
corresponding to pseudocolour values and assigning colours to the cell values
accordingly. The 256 basic pseudocolour values are set out in the lookup table
pseudocolour.lut (See "Colour Lookup Tables" in INTREPID database, file and
data structures (R05) for details).
If you set Low Clip and/or High Clip values INTREPID will assign
The lowest ranking colour to all grid cells whose value is less than or equal to the Low
Clip value.
Library | Help | Top
•
The highest ranking colour to all grid cells whose value is greater than or equal to
the High Clip value.
•
The other colours in the pseudocolour range to other cells in the grid on the basis
described above.
© 2012 Intrepid Geophysics
| Back |
INTREPID User Manual
Library | Help | Top
Grid Stitch—combining two grids (T23)
9
| Back |
>> To specify pseudocolour display for your grids
1
Choose PseudoColour from the Display menu. INTREPID displays the
Pseudocolour Parameters dialog box.
The Low Clip and High Clip text boxes will at first contain the minimum and
maximum cell values.
2
Specify or reset Low Clip and High Clip values if required.
To restore the Low Clip and High Clip values to the minimum and maximum cell
values, choose Reset. Otherwise enter the values (in Z units) in the corresponding
text boxes.
3
Choose OK. INTREPID displays the grids using pseudocolour. Pseudocolour
display is illustrated in all of the pictures of grids so far in this section.
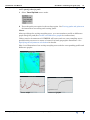
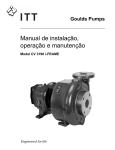
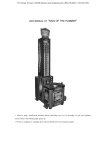
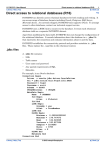
Sun Angle display
Sun angle display creates the illusion of the sun shining on the image from a chosen
angle, creating a system of illuminated areas.
The sun angle effect enables you to visualise the image in terms of 'hills' and 'valleys'.
It interprets a high measurement in a sample as a 'hill' and a low measurement as a
'valley'.
You can use sun angle this even though the measurements in the data may not
actually be physical elevation. For example, if the measurements are levels of
magnetism, the sun angle display allows you to visualise a 'magnetic topography'
where 'hills' are areas of high magnetism, and 'valleys' are areas of low magnetism.
This display mode is useful for highlighting linear trends or breaks in the image that
may be missed in pseudocolour viewing.
>> To specify sun angle display for your grids
Library | Help | Top
1
Choose Sun Angle from the Display menu. INTREPID displays the Sun Angle
Parameters dialog box.
2
Specify Declination, Inclination and Vertical Exaggeration as required, then
choose OK. INTREPID displays the grids as a sun angle display.
© 2012 Intrepid Geophysics
| Back |
INTREPID User Manual
Library | Help | Top
Grid Stitch—combining two grids (T23)
10
| Back |
Declination is the 'compass' direction of the line from the overhead point to the 'sun'.
A declination of 0° means that the 'sun' is North of the overhead point. A
declination of 90° means that it is East of the overhead point. –90° means West
and +180°or –180° means South. The default declination is 45°.
Inclination is the angle of the 'sun' between the horizon and the overhead point. An
inclination of 0° means that the 'sun' is on the horizon and an inclination of 90°
means that it is at the overhead point. The default inclination is 45°.
Vertical Exaggeration is the size of the contrast between high and low values. If
you increase the Vertical Exaggeration, the 'hills' will appear higher and the
'valleys' deeper. The default vertical exaggeration is 100.
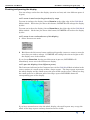
Here is an illustration of sun angle grid display.
Tracing paths and point sets
The following Grid Stitch tool processes involve tracing a path or marking a point set.
•
Querying the dataset—specifying the cross section of your choice for profile
viewing (See Querying the dataset—viewing profile and difference graphs for
details),
•
Specifying the zip path for grid adjustment optimising. (See Tracing a path for
the overlap sample data (Zip path) for details),
•
Marking control points. See Specifying the adjustment calculation for details.
A traced path is a contiguous (joined) sequence of straight line segments that you
digitise using the mouse. INTREPID displays the paths in black with small black
markers at the vertices.
INTREPID shows control point sets using triangular markers.
>> To trace a path or mark a point set
1
Library | Help | Top
Select the mouse mode corresponding to the path or point set. Mouse modes are:
Trace Query Path, Trace Zip Path, Digitise Control.
© 2012 Intrepid Geophysics
| Back |
INTREPID User Manual
Library | Help | Top
2
Grid Stitch—combining two grids (T23)
11
| Back |
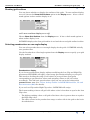
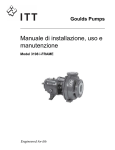
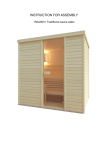
Click the vertices (points) of the path with the left mouse button.
INTREPID displays the path and vertices and record them for the grid stitch
process. The following illustration shows a zip path.
3
When you have finished, ensure that you do not accidentally click any further
points.
If you do not wish to view profile graphs, one way to prevent this error is to
change to Zoom mouse mode. If you do wish to view profile graphs, you need to
select the mouse mode corresponding to the profile graph you require.
>> To clear a path or point set from the process specification and display.
1
Choose the option from the Erase menu corresponding to the path or set of points
you wish to clear (i.e., the Zip Path, Query Path, Control Points).
INTREPID will remove the path from the process specification and the display.
Profile and Difference graphs
You can view graphs of any cross-section of the grids displayed. The cross-section is
defined by a path that you trace through the grid display using the mouse.
There are two graph types available:
•
Library | Help | Top
Data profiles from the two grids. INTREPID shows the Reference grid values as
black X marks and the Other grid values as red X marks.
© 2012 Intrepid Geophysics
| Back |
INTREPID User Manual
Library | Help | Top
•
Grid Stitch—combining two grids (T23)
12
| Back |
The differences between data values from the two grids. INTREPID shows the
difference values as black X marks.
You can view the graphs in connection with the following Grid Stitch processes.
•
Using a query path—specifying the cross section of your choice for profile viewing
(See Querying the dataset—viewing profile and difference graphs for details),
•
Specifying the zip path (See Tracing a path for the overlap sample data (Zip path)
for details).
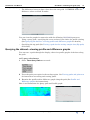
Querying the dataset—viewing profile and difference graphs
You can trace a path through the display, then view profile graphs of the data along
the path.
>> To query the dataset
1
Select Trace Query Path mouse mode
2
Trace the path you require in the overlap region. See Tracing paths and point sets
for instructions on tracing and erasing paths.
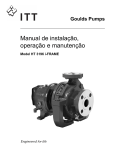
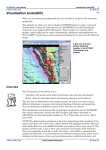
3
Examine the profile and/or difference graph along the path (See Profile and
Difference graphs for instructions).
Here is an illustration of a Query path and Profile graph.
Library | Help | Top
© 2012 Intrepid Geophysics
| Back |
INTREPID User Manual
Library | Help | Top
Grid Stitch—combining two grids (T23)
13
| Back |
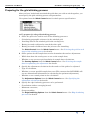
Preparing for the grid stitching process
After you have loaded and examined the grids that you wish to stitch together, you
must specify the grid stitching process and parameters.
Use options from the Stitch Control menu for stitch process specifications.
>> To prepare for the grid stitching process
1
Select the grid to be used for each of the following processes:
•
Calculating geographic reference for the stitched grid,
•
Providing data for the stitched grid in the overlap area,
•
Having its surface adjusted to match the other grid,
•
Having its surface feathered near the join area for smoothing.
Use Stitch Control from the Stitch Control menu. See Selecting the grid for each
stage of the stitching process for details.
2
Select options for the sample data used to determine the surface adjustment:
•
Which data from the overlap area to use as the sample data,
•
Whether to use screen or grid resolution in sample data calculations.
Use Overlap Options from the Stitch Control menu. See Selecting the sample
data for optimising the adjustment for details.
3
Specify the adjustment calculation for the surface of the grid to be adjusted:
•
Type of calculation,
•
Whether to create parallel sample data sets (This ensures that INTREPID will
use two dimensional information for calculating the optimum adjustment),
•
Whether to use control points in the calculation.
Use Adjustment Options from the Stitch Control menu. See Specifying the
adjustment calculation for details.
4
Specify the edge feathering processes to be performed:
•
Convolution with an averaging kernel,
•
Minimum curvature,
•
Seam smoothing.
Use Edge feathering Options from the Stitch Control menu. See Edge feathering
processes for details.
Library | Help | Top
© 2012 Intrepid Geophysics
| Back |
INTREPID User Manual
Library | Help | Top
Grid Stitch—combining two grids (T23)
14
| Back |
Selecting the grid for each stage of the stitching process
This section describes how to select the grid for each of the following processes:
•
Calculating geographic reference for the stitched grid,
•
Providing data for the stitched grid in the overlap area,
•
Having its surface adjusted to match the other grid,
•
Having its surface feathered near the join area for smoothing.
>> To select the grid for each processing stage
1
Choose Stitch Control from the Stitch Control menu OR
Load a new pair of grids to be stitched (See Specifying input and output files for
detailed instructions).
INTREPID displays the Stitch Control dialog box.
This dialog box shows the names of the two loaded grids with option buttons so
that you can select one of the grids for each stage of the process.
2
Select the options according to your requirements then choose OK.
Calculate Geographic Reference from Use this option to specify which grid to use
for geographic reference. INTREPID will adjust the other grid's geographic
reference to match. (INTREPID selects the first grid to be loaded as the default.)
In Overlap, Use Data from Use this option to specify which grid is to provide the
data from the overlap area for the output grid. The grid you select here
determines the grid cell size for the output grid. (INTREPID selects the first grid
to be loaded as the default.)
Adjust surface of Use this option to specify which grid is to be adjusted to match the
other grid. (INTREPID selects the second grid to be loaded as the default.) See
Specifying the adjustment calculation for details of the calculations that
INTREPID can perform.
Feather Surface of Use this option to specify which grid on which INTREPID
should perform the edge feathering process. (INTREPID selects the second grid
to be loaded as the default.) See Edge feathering processes for details of this
process.
Selecting the sample data for optimising the adjustment
This section describes how to select options for the sample data used to determine the
surface adjustment:
Library | Help | Top
•
Which data from the overlap area to use as the sample data,
•
Whether to use screen or grid resolution in sample data calculations.
© 2012 Intrepid Geophysics
| Back |
INTREPID User Manual
Library | Help | Top
Grid Stitch—combining two grids (T23)
15
| Back |
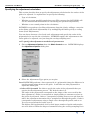
>> To select options for the sample data
1
Choose Overlap Options from the Stitch Control menu. INTREPID displays the
Overlap Options dialog box.
2
Select the option you require from the Calculate Surface Correction Using Data
from options. These options determine which points in the overlap area to use for
optimising the grid adjustment.
Zip Path Select this option if you wish to select the sample points by tracing a path
through the overlap region. See Tracing a path for the overlap sample data (Zip
path) in this section for further details.
Grid Outlines Select this option if you require INTREPID to obtain the sample
points from the grid outlines (i.e., the cells along perimeter of the overlap area).
Whole Overlap Region Select this option if you require INTREPID to obtain the
sample points from the whole overlap region.
3
Specify Screen Resolution or Grid Resolution for selection of sample points,
using the corresponding option buttons.
Grid resolution If you specify Grid Resolution, INTREPID will use all cells in the
overlap region or on the overlap perimeter or zip path (depending on your
selection) as the sample data.
Screen Resolution If you specify Screen Resolution, then
•
In interactive mode, INTREPID samples the data at screen resolution (1 sample
per pixel12).
•
In batch mode, INTREPID samples from a 500x500 matrix of virtual pixels.
Tracing a path for the overlap sample data (Zip path)
You can specify the path through the overlap area for INTREPID to use as a source of
sample points to record the differences between the values in the two grids.
INTREPID can use this to calculate the grid adjustments.
1.2For calculation purposes INTREPID measures the number of pixels in the image with
the whole image fitting in to the display area of the Grid Stitch Main window (i.e., fully
zoomed out).
If you enlarge the Grid Stitch Main window, INTREPID will use more pixels for the
image (i.e., a lower subsampling interval). This results in a more detailed display but
does not affect the number of sample points.
Library | Help | Top
© 2012 Intrepid Geophysics
| Back |
INTREPID User Manual
Library | Help | Top
Grid Stitch—combining two grids (T23)
16
| Back |
>> To specify the zip path
1
Select Trace Zip Path mouse mode.
2
Trace the path you require in the overlap region. See Tracing paths and point sets
for instructions on tracing and erasing paths.
Notes:
After specifying the overlap sampling trace, you can examine a profile or difference
graph along the path (See Profile and Difference graphs for instructions).
Under certain circumstances INTREPID will create and use extra sampling traces
parallel with your trace to ensure a better fit in both geographic dimensions. See
Specifying the adjustment calculation for details.
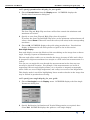
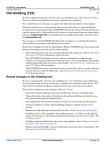
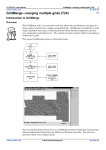
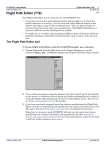
Here is an illustration of an overlap sampling trace and the corresponding profile and
difference graphs
Profile Graph
Library | Help | Top
Difference graphs
© 2012 Intrepid Geophysics
| Back |
INTREPID User Manual
Library | Help | Top
Grid Stitch—combining two grids (T23)
17
| Back |
Specifying the adjustment calculation
This section describes how to specify the adjustment calculation for the surface of the
grid to be adjusted. It explains how to specify the following:
•
Type of calculation,
•
Whether to create parallel sample data sets (This ensures that INTREPID will
use two dimensional information for calculating the optimum adjustment),
•
Whether to use control points in the calculation.
INTREPID can perform a levelling adjustment along the join by adding a correction
to the Other grid (Level Adjustment) or by multiplying the Other grid by a scaling
factor (Scale Adjustment).
You can choose between a level and scale adjustment and specify the order of the
polynomial to be used in the calculation. INTREPID applies the adjustment to the
entire grid to be adjusted, not just along the overlap sampling trace.
>> To specify the adjustment method and parameters
1
Choose Adjustment Options from the Stitch Control menu. INTREPID displays
the Adjustment Options dialog box.
2
Select the Adjustment Type option you require.
Level INTREPID performs a least squares fit of a polynomial along the difference in
overlap sample points between the grids. It will then use this polynomial to
adjust the whole grid.
—Order of Polynomial Use this to specify the order of the polynomial that you
require for the adjustment process. The default order is 2.
The order of the polynomial corresponds to the shape of the curve used for the
data adjustment. Order 0 corresponds to simply adding a constant to values in
the grid to be adjusted. Order 1 corresponds to adding more at one end than the
other, the adjustment determined by a straight line through the profile. Order 2
corresponds to adjustment using a simple curve through the profile, and so on.
You can use polynomial of order up to 8.
The higher order polynomials, due to their larger number of peaks and troughs,
are more able to follow the shapes of anomalies along the overlap sampling trace.
Library | Help | Top
© 2012 Intrepid Geophysics
| Back |
INTREPID User Manual
Library | Help | Top
Grid Stitch—combining two grids (T23)
18
| Back |
—Reject Limit (standard deviations) Use this to exclude extreme values when
calculating the polynomial. INTREPID will not use sample points with values
outside the specified number of standard deviations from the mean.
—Use control points If you are using the Level adjustment you can mark control
points which INTREPID will not change in the grid to be adjusted.
If this check box is on when you choose Apply, INTREPID will use the currently
defined control points.
See Tracing paths and point sets for instructions on marking control points.
—Add parallels to overlap trace If you are using the Level adjustment, you can
specify whether to use parallel sets of sample points. Use the corresponding check
box.
If the zip path or grid borders are too straight (height/width of rectangle
surrounding whole path > 3 or height/width < 1/3), INTREPID can create and use
two extra sets of sample points parallel with the zip path to ensure a better fit in
both geographic dimensions. This is an automatic internal process, and you will
not be able to view the extra traces in a graph.
Automatic Scale Use this option for INTREPID to use the sample points to derive a
single factor for adjusting the grid. INTREPID will multiply the all values in the
grid to be adjusted by this factor.
Manual Scale Use this option to specify single adjustments for the whole grid
manually.
The stitch tool will automatically compute and display manual adjustment DC
Shift and Scale factor parameters that would give the best results.
—DC Shift Use this text box to specify a value to add to each cell in the grid to be
adjusted.
—Scale Factor This adjustment involves multiplying the grid to be adjusted by a
factor.
This is mainly intended for stitching grids of radiometric data. Radiometric
surveys, particularly older ones, are commonly uncalibrated with respect to each
other. Radiometric data is also very sensitive to weather conditions. The mean
and the dynamic range of radiometric grids may differ markedly, even though the
surveys were flown in the same area.
None Select this option if you do not require any adjustment.
3
Choose OK.
Edge feathering processes
This section describes how to specify the edge feathering processes:
•
Convolution with an averaging kernel,
•
Minimum curvature,
•
Seam smoothing.
Use Edge feathering Options from the Stitch Control menu.
You can use feathering in conjunction with levelling and scaling or independently.
Library | Help | Top
© 2012 Intrepid Geophysics
| Back |
INTREPID User Manual
Library | Help | Top
Grid Stitch—combining two grids (T23)
19
| Back |
>> To specify the feathering process,
1
Choose Edge Feathering Options from the Stitch Control menu. INTREPID
displays the Edge Feathering Options dialog box.
2
Turn the feathering processes on or off as required, specifying the parameters for
the processes you have enabled. See below for explanation of the parameters.
3
Choose OK when you have finished.
Averaging Kernel
Use this option to specify the feathering convolution process. Feathering is a process
of iterative local grid smoothing using a 3x3 LaPlace convolution kernel. The
process adjusts the grid to be feathered working away from the edge of the other grid.
See "LaPlace iterations" in Old Gridding (T22) for more information about LaPlace
convolution.
You can specify the maximum number of smoothing iterations performed in the
feathering process.
The process uses the following parameters:
Iterations You can specify the number of feathering iterations for INTREPID to
perform on the grid. One iteration is one pass of the convolution process.
Kernel Half Width This is the radius of the convolution kernel used for feathering.
A width of 1 corresponds to a 3x3 kernel, 2 corresponds to a 5x5 kernel, 3 to a 7x7,
etc.. The default value is 1. A larger kernel half width takes longer to process and
results in more smoothing.
Library | Help | Top
© 2012 Intrepid Geophysics
| Back |
INTREPID User Manual
Library | Help | Top
Grid Stitch—combining two grids (T23)
20
| Back |
Kernel Size Factor If you increase the kernel size factor from 1, INTREPID
expands the kernel to cover a greater area of the grid, but uses the same number
of coefficients with 0 coefficients in the gaps between them. It will perform the
feathering with the expanded kernel, then reduce its half width by one step and
repeat the process. INTREPID will continue to reduce the half width and repeat
the process until the half width is equal to the half width specified in the Kernel
Half Width text box. A larger kernel size factor takes longer to process and
results in more smoothing.
The reduction in half width in each step is equal to the specified kernel half width.
For example if the specified kernel half width is 2 (5x5) and the kernel size factor
is 3, INTREPID will commence with a kernel of half width 2 x 3 = 6 (13x13) (but
still with only 5x5 coefficients), then repeat the process with a kernel of half width
4 (9x9), then with a kernel of half width 2 (5x5).
Minimum Curvature
Use this option to specify a minimum curvature process for smoothing the seam area.
See "Minimum Curvature" in Old Gridding (T22) for details.
Iterations, Maximum Residual, Relaxation factor See "Minimum Curvature" in
Old Gridding (T22) for details of these parameters.
(Relaxation factor) You can change the value of the relaxation factor if you are
using a task specification (.job) file for your Grid Stitch process. Edit the .job
file, changing the value in the Relaxation_Factor = line according to your
requirements, e.g., Relaxation_Factor = 1.35. See Displaying options and
using task specification files for information about batch mode.
Seam Smoothing
This is an edge-hiding convolution filter. Overuse of this can lead to flat spots in the
data.
Iterations We recommend a maximum of 2 iterations for this process.
Cells around the seams Use this to specify the size of the seam smoothing kernel.
The default size is 4.
Apply
When you choose Apply, INTREPID performs the Grid Stitch process as specified by
you, saving the stitched grid
•
When finished for a small grid or
•
As it proceeds for a large grid where it is using the tiling process (See Optimising
processing performance for large grids for details about small and large grids and
tiling).
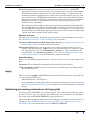
Optimising processing performance for large grids
For large grids, INTREPID uses a tiling system. This involves processing the grid a
section at a time. You can optimise the performance of your computer by adjusting
the value of the INTREPID_MEMORY system parameter.
Apart from this optimising adjustment, the tiling process and the decision to use it is
automatic. See "INTREPID Memory limits and tiling" in Configuring and using
INTREPID (R04) for information about INTREPID_MEMORY.
Library | Help | Top
© 2012 Intrepid Geophysics
| Back |
INTREPID User Manual
Library | Help | Top
Grid Stitch—combining two grids (T23)
21
| Back |
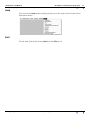
Help
You can use the Help menu to display help text on the topics shown in the menu
illustration below.
Exit
To exit from Grid Stitch choose Quit from the File menu.
Library | Help | Top
© 2012 Intrepid Geophysics
| Back |
INTREPID User Manual
Library | Help | Top
Grid Stitch—combining two grids (T23)
22
| Back |
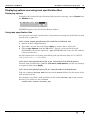
Displaying options and using task specification files
Displaying options
To display the current file specifications and parameter settings, choose Report from
the Window menu.
INTREPID displays the Grid Stitch Report window.
Using task specification files
You can store sets of file specifications and parameter settings for Grid Stitch in task
specification (.job) files.
>> To create a task specification file with the Grid Stitch tool
1
Specify all files and parameters.
2
If possible, execute the task (choose Apply) to ensure that it will work.
3
Choose Save Options from the File menu. Specify a task specification file
(INTREPID will add the extension .job) INTREPID will create the file with the
current parameters.
For full instructions on creating and editing task specification files see INTREPID
task specification (.job) files (R06) .
>> To use a task specification file in an interactive Grid Stitch session
Load the task specification (.job) file (File menu, Load Options), modify any settings
as required, then choose Apply.
>> To use a task specification file for a batch mode Grid Stitch task
Type the command stitch.exe with the switch –batch followed by the name of the
task specification file.
For example, if you had a task specification file called surv329.job in the current
directory you would use the command
stitch.exe –batch surv329.job
Library | Help | Top
© 2012 Intrepid Geophysics
| Back |
INTREPID User Manual
Library | Help | Top
Grid Stitch—combining two grids (T23)
23
| Back |
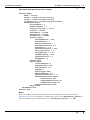
Grid stitch task specification file example
Process Begin
Name = stitch
GridA = /disk1/survey/stitch_a
GridB = /disk1/survey/stitch_b
OutputStitch = /disk1/survey/stitched1
Parameters Begin
CurrentBand = 0
NumberOfBands = 1
Output_Grid_Size = 100.0
AlignTo = GridA
Precedence = GridA
PolyAdjust = GridB
FeatherInto = GridB
Feather Begin
AverageKernel = Yes
KernelWidth = 1
KernelSizeFactor = 1
AverageIterations = 6
Relaxation = 1.2
MinimumCurvature = Yes
Minq_iterations = 6
Minq_Max_Res = 0.01
SeamSmoothing = Yes
SeamIterations = 1
EdgeWidth = 4
Feather End
Adjust Begin
ControlWeight= 1
AddParallels= Yes
RejectLimit= 2.0
Degree= 1
AdjustType= Add
ManualDCShift= 0.0
ManualScaleFactor= 1.0
ModelFromTraverse Begin
UseOutline= Yes
UseGridResolution= No
UseWholeOverlap= No
ModelFromTraverse End
Adjust End
Parameters End
Process End
Notes
You can modify the relaxation factor for the minimum curvature process (See
Minimum Curvature for details). Change the value in the Relaxation_Factor =
line according to your requirements, e.g., Relaxation_Factor = 1.325.
Library | Help | Top
© 2012 Intrepid Geophysics
| Back |