1
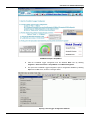
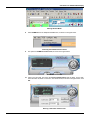
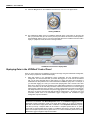
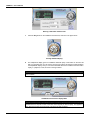
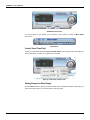
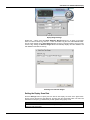
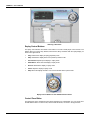
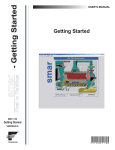
USER’S MANUAL
MAY / 06
VERSION 8
FOUNDATION
P V I
E WV WX M E
www.smar.com
Specifications and information are subject to change without notice.
Up-to-date address information is available on our website.
web: www.smar.com/contactus.asp
Table of Contents
TABLE OF CONTENTS
INTRODUCTION TO VCRWORX DATA REPLAY......................................................................................... 8
VCRWORX TOOLS ........................................................................................................................................................8
VCRWORX HISTORICAL DATA REPLAY.....................................................................................................................8
VCRWORX ALARM DATA REPLAY ..............................................................................................................................9
VCRWORX QUICK START EXAMPLE ..........................................................................................................................9
REPLAYING DATA IN THE VCRWORX CONTROL PANEL.......................................................................................14
VCRWORX CONTROL PANEL ....................................................................................................................................16
LAUNCHING THE VCRWORX CONTROL PANEL.................................................................................................................... 17
VCRWORX CONTROL PANEL INTERFACE............................................................................................................................. 17
CONTROL PANEL TIME FIELD ................................................................................................................................................. 18
SETTING RANGES FOR DATA REPLAY .................................................................................................................................. 18
SETTING THE REPLAY SCAN RATE........................................................................................................................................ 19
REPLAY CONTROL BUTTONS ................................................................................................................................................. 19
CONTROL PANEL SKINS.......................................................................................................................................................... 20
3
VCRWorX – User’s Manual
4
Introduction to VCRWorX Data Replay
INTRODUCTION TO VCRWORX DATA
REPLAY
VCRWorX is a powerful tool in ProcessView that enables the replay and reanimation of graphical,
historical and alarm data. Features of VCRWorX include:
•
Replay of OPC data.
•
Reanimation of graphics.
•
Re-plotting of trends.
•
Replay of alarms.
•
See what the operator saw through replay of graphical displays.
•
VCRWorX Control Panel with customizable skins/layouts.
•
Change the replay speed.
•
Specify time and date ranges for data replay.
•
Search for key events, tags, and expressions.
•
Customize the layout and appearance using skins.
VCRWorX Tools
There are two main tools that you must use to configure and view VCRWorX data replay:
•
VCRWorX Control Panel: This is the runtime user interface in GraphWorX, TrendWorX, and
AlarmWorX that enables you to replay and view your historical data. This document primarily
describes how to operate the VCRWorX Control Panel.
•
Unified Data Configurator: VCRWorX replays historical data from the active TrendWorX
Logger and AlarmWorX Server configuration databases. But before you can playback data
using the VCRWorX Control Panel, you first must configure your data-logging settings in the
Unified Data Configurator. The Unified Data Configurator enables you to select existing
configuration databases or create new databases for VCRWorX data replay. You can also
create and configure alarm tags and trend pens. For more information about the Unified Data
Configurator, please see the Unified Data Configurator help documentation.
VCRWorX Historical Data Replay
An overview of VCRWorX historical data replay is shown in the figure below. VCRWorX replays
historical data from the active TrendWorX Logger configuration database, which is configured using
the Unified Data Configurator.
Overview of VCRWorX Historical Data Replay
5
VCRWorX – User’s Manual
VCRWorX Alarm Data Replay
An overview of VCRWorX alarm data replay is shown in the figure below. VCRWorX replays alarm
data from the active AlarmWorX Server configuration database, which is configured using the
Unified Data Configurator.
NOTES
Although the AlarmWorX Logger can log data to multiple databases, VCRWorX can only replay
alarms from one database.
VCRWorX alarm replay does not support alarms coming from Oracle databases.
VCRWorX alarm replay does not work with alarm databases that were created using versions of
ProcessView prior to version 8.0.
Overview of VCRWorX Alarm Data Replay
VCRWorX Quick Start Example
The ProcessView installation provides a VCRWorX_Example.gdf as an example of how to set up
VCRWorX data replay in a GraphWorX display:
1.
6
Browse to the C:\Program Files\Smar \ ProcessView \ Examples\VCRWorX Examples
directory and open the VCRWorX_Example.gdf file. The file opens in GraphWorX, as shown
in the figure below.
Introduction to VCRWorX Data Replay
VCRWorX Example in GraphWorX
2.
Start the TrendWorX Logger Configurator from the Windows Start menu by selecting
Programs > Smar ProcessView > ProjectWorX > TrendWorX Configurator.
3.
This opens the TrendWorX Logger Configurator. Open a configuration database by selecting
Open from the File menu, as shown in the figure below.
Opening a Trend Logger Configuration Database
7
VCRWorX – User’s Manual
4.
Browse to the C:\Program Files\Smar\ProcessView\Examples\VCRWorX Examples
directory and select the VCRConfig.mdb database, as shown in the figure below.
Opening the Sample VCRWorX Trend Logger Configuration
5.
Go to the VCRConfiguration under the Configurations tree control, as shown in the figure
below. Click the Make Active button to activate the configuration.
Activating the VCR Configuration
8
6.
Select Exit from the File menu to close out of the TrendWorX Configurator.
7.
Put the VCRWorX_Example.gdf display file into runtime by clicking the Runtime menu in
GraphWorX, as shown in the figure below.
Introduction to VCRWorX Data Replay
Starting Runtime Mode
8.
Select VCRWorX from the GraphWorX Tools menu, as shown in the figure below.
Launching the VCRWorX Control Panel
9.
This opens the VCRWorX Control Panel, as shown in the figure below.
VCRWorX Control Panel
10. Click on the time field. This opens the Insert Time/Date Values pop-up dialog. For the date,
enter December 28, 2005. For the time, enter 09:26:00 AM, as shown in the figure below. Click
OK.
Entering a Start Date and Start Time
9
VCRWorX – User’s Manual
11. Press the Play button on the VCRWorX Control Panel, as shown in the figure below.
Starting VCRWorX
12. The GraphWorX display goes into VCRWorX historical replay mode based on the time and
date you provided. Now you can see the process point values and ActiveX controls update in
the GraphWorX display, and you can see the time/date field of the VCRWorX Control Panel in
replay, or "playback," mode, as shown in the figure below.
VCRWorX Control Panel in Replay Mode
Replaying Data in the VCRWorX Control Panel
Once you have configured your database connections and tags using the Unified Data Configurator,
you are ready to prepare for VCRWorX data replay:
1.
Start data logging in the AlarmWorX Logger Configurator and the TrendWorX Logger
Configurator. It is recommended that you let the data loggers run for at least 30 minutes so
that you will have adequate data for data logging. To replay VCR data, there should be a
substantial time delay between the current time and the VCRWorX replay time. For example, if
you start data logging at 11 AM, you cannot start replaying data until 11:20 AM. This "safe"
delay time is twice the block size specified in the Unified Data Configurator. The default block
size is 10 minutes. So the safe delay should be at least 20 minutes. This is for shorter logging
rates (logging to disk less than 5 minutes). For longer logging rates (more than 5 minutes) the
safe delay should be twice the block size plus the logging rate. For example, if you are logging
data every 15 minutes, then the safe delay should be at least 20+15 = 35 minutes. For more
information please refer to the AlarmWorX Logger Configurator and TrendWorX Logger
Configurator help documentation.
NOTE
Although the AlarmWorX Logger can log data to multiple databases, VCRWorX can only replay
alarms from one database. The Alarm Snapshots section of the Database Logging tab in the
AlarmWorX Logger Configurator, shown in the figure below, allows you to create a "snapshot"
table that can be used to replay alarm data in VCRWorX. In the Snapshots Period field, specify
how often (in hours) a snapshot table can be created. A snapshot period value of "0" (zero)
means that no snapshot table will be created. For VCRWorX data replay to work with alarms, the
value of the snapshot period must be greater than "0." For more information please refer to the
AlarmWorX Logger Configurator help documentation.
10
Introduction to VCRWorX Data Replay
Alarm Snapshots in Alarm Logger Configurator
2.
Start GraphWorX and open the .gdf file that you configured in the Unified Data Configurator.
3.
Start runtime mode in GraphWorX.
4.
Select VCRWorX Replay from the GraphWorX Tools menu, as shown in the figure below.
Launching the VCRWorX Control Panel
5.
This opens the VCRWorX Control Panel, as shown in the figure below.
VCRWorX Control Panel
6.
Click on the time field. Enter a date and time from which to begin the data replay. Click OK.
11
VCRWorX – User’s Manual
Entering a Start Date and Start Time
7.
Press the Play button on the VCRWorX Control Panel, as shown in the figure below.
Starting VCRWorX Replay
8.
The GraphWorX display goes into VCRWorX historical replay mode based on the time and
date you provided. Now you can see the process point values and ActiveX controls update in
the GraphWorX display, and you can see the time/date field of the VCRWorX Control Panel in
replay, or "playback," mode, as shown in the figure below.
NOTE
For more information about the VCRWorX Control Panel, please see the VCRWorX help
documentation.
VCRWorX Control Panel in Replay Mode
NOTE
If you want to replay data from a remote VCRWorX node, you must add the name of the
VCRWorX server computer in front of the name of the tag that you want to replay. This applies to
OPC Data Access tags as well as trends. This does not apply to alarms.
12
Introduction to VCRWorX Data Replay
VCRWorX Control Panel
The VCRWorX Control Panel, shown in the figure below, is the user interface that enables you to
configure your historical data replay time and date settings. You can:
•
See what the operator saw through replay of graphical displays.
•
Specify time and date ranges for replay.
•
Fast forward and rewind.
•
Change the replay speed.
•
Search for key events, tags, or expressions.
•
Customize the layout and appearance using skins.
VCRWorX Control Panel
Launching the VCRWorX Control Panel
The VCRWorX Control Panel can be launched from the GraphWorX, AlarmWorX, and TrendWorX
containers during runtime mode. Select VCRWorX Replay from the Tools menu, as shown in the
figure below.
Launching the VCRWorX Control Panel
VCRWorX Control Panel Interface
The VCRWorX Control Panel, shown in the figure below, contains the following user interface
components:
•
Time Field: Displays the current mode (e.g. Play, Stop, Fast Forward, Rewind, Step, Pause,
etc.). Clicking on this field enables you to specify a start date and start time for data replay.
•
Status Bar: Indicates live mode or playback mode.
•
Menu Buttons: Allow you to close or minimize the Control Panel, open the online Help, or
switch between normal mode and "micro" mode.
•
Load Skin Button: Enables you to select a skin to change the Control Panel appearance.
•
Replay Control Buttons: Allow you to Play, Stop, Rewind, Fast Forward, Step, and Slow
down the replay display.
•
Search Button: Specifies the time/date and/or expression range settings for data replay.
•
Settings Button: Specifies the scan rate for data replay.
13
VCRWorX – User’s Manual
VCRWorX Control Panel
To conserve space in your display, you can switch to "micro mode" by clicking the Micro Mode
menu button
Micro Mode
Control Panel Time Field
Clicking on the time field opens the Insert Time/Date Values pop-up dialog. Enter a start date and
time for data replay, as shown in the figure below. Click OK.
Entering a Start Date and Start Time
Setting Ranges for Data Replay
Click the Search button to specify the start time/date and end time/date settings for data replay, as
shown in the figure below. You can also select an OPC tag range.
14
Introduction to VCRWorX Data Replay
Replay Range Settings
Clicking the ... button opens the Select Date/Time Ranges dialog box, as shown in the figure
below. To select an OPC Tag, click the … button and select a tag from the Unified Data Browser.
The tag name appears in the Select OPC Tag field, as shown in the figure below. Once you have
chosen a tag, clicking the Retrieve Ranges button automatically displays the start date/time and
end date/time information for the tag.
Selecting Time and Date Ranges
Setting the Replay Scan Rate
Click the Settings button to specify the scan rate for data replay, as shown in the figure below.
Choose a scan rate from the drop-down list, and then click the check mark button. The scan rate
determines the frequency (in milliseconds) of data updates during replay mode.
NOTE
The first value in the list is a custom value that you can type in. All other values in the list are
fixed scan rate frequencies.
15
VCRWorX – User’s Manual
Selecting a Scan Rate
Replay Control Buttons
The replay control buttons are similar to the buttons on a VCR or DVD player control console. The
buttons allow you to Play, Stop, Rewind, Fast Forward, Step, and Slow down the replay display, as
shown in the figure below:
•
Play: Switches the display to replay (playback) mode.
•
Stop: Switches the display back to live (real-time) runtime mode.
•
Fast Forward: Speeds up the display in replay mode.
•
Slow Motion: Slows down the display in replay mode.
•
Reverse: Rewinds the display in replay mode.
•
Pause: Stops the display in replay mode.
•
Step: Moves the display forward in one-second intervals while in pause mode.
Replay Control Buttons on the VCRWorX Control Panel
Control Panel Skins
The appearance of the VCRWorX Control Panel appearance is customizable. You can choose from
several different skins. To select a skin, click the load skin button, as shown in the figure below.
16
Introduction to VCRWorX Data Replay
Loading a Skin
Select from one of the following skins, which change the color, style, and layout of the Control
Panel. The Processview VCRWorX skin files are installed in the C:\Program
Files\Smar\ProcessView\VCRWorX32Skins directory.
VCRWorX Control Panel Skins
17
VCRWorX – User’s Manual
18