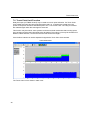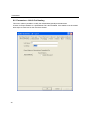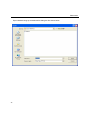
1
Techna-Tool Inc.
®
TECHNA-CHECK
TTMON
User Manual
Released: May 2006
Contents
© Copyright 2003-2005, Techna-Tool Inc., Hartland, Wisconsin, USA.
The information in this document is subject to change without notice.
TECHNA-CHECK® is a registered trademark of Techna-Tool Inc.
2
Table of Contents
Table Of Contents:
1. The TTMON Concept............................................................................................... 5
1.1 TTMON Window Structure ................................................................................ 6
1.1.1 Auto/Manual/Stop Mode........................................................................... 6
1.1.2 Spindle, Roll and Statistic......................................................................... 7
1.2 The Task-Bar..................................................................................................... 8
1.3 The TTMON AboutBox ...................................................................................... 8
1.4 The Transducer Mapping Dialog Box................................................................ 9
1.5 The Number-of-Channels.................................................................................. 10
1.6 The Configuration Dialog Box ........................................................................... 11
1.7 Load/Save Parameters...................................................................................... 12
2. Function ................................................................................................................... 13
2.1 General.............................................................................................................. 13
2.2 Learn Signal ...................................................................................................... 14
2.2.1 Learn Cycle Initiation - Machine Controlled ............................................. 14
2.2.2 Learn Cycle Initiation - TTMON................................................................ 14
2.3 Fault Signals and Resetting of Faults................................................................ 14
2.4 The Analog Zoom Function ............................................................................... 15
3. Missing Tool Supervision......................................................................................... 16
3.1 Missing Tool - Absolute Mode ........................................................................... 16
3.2 Missing Tool - Learn Work Mode ...................................................................... 17
3.3 Missing Tool - Auto Learn Step Curve .............................................................. 18
4. Tool Break Supervision ........................................................................................... 19
4.1 Break Mode Selection ....................................................................................... 19
4.2 Tool Break - Absolute Peak Mode..................................................................... 19
4.3 Tool Break - Learn Peak Mode ......................................................................... 20
4.4 Tool Break - Absolute Peak Curve .................................................................... 21
4.5 Tool Break - Auto Learn Step Curve ................................................................. 22
5. Blunt Tool Supervision............................................................................................. 23
5.1 Blunt Mode Selection......................................................................................... 23
5.2 Blunt Tool - Absolute Peak Mode...................................................................... 24
5.3 Blunt Tool - Learn Peak Mode........................................................................... 25
5.4 Blunt Tool - Learn Work Mode .......................................................................... 26
5.5 Blunt Tool - Blunt On Part Count....................................................................... 27
5.6 Blunt Tool - Auto Learn Step Curve .................................................................. 27
5.7 Blunt Tool - Resetting the Part Counter ............................................................ 27
6. Idle Limit Supervision ............................................................................................... 28
7. Touch Point Limit Function ...................................................................................... 29
8. Parameters - Unit & Cut Naming ............................................................................. 30
8.1 Parameters - Measurement ............................................................................... 32
8.2 Parameters - Averaging ..................................................................................... 34
8.3 Parameters - Timers.......................................................................................... 35
8.4 Parameters - Start Signal Mode ........................................................................ 36
8.5 Parameters - Force Learn ................................................................................. 37
8.6 Parameters - Break ........................................................................................... 38
3
Table of Contents
Table Of Contents:
8.7 Parameters - Blunt.............................................................................................. 40
8.8 Parameters - Missing.......................................................................................... 42
8.9 Parameters - Idle Limit ....................................................................................... 44
8.10 Parameters - Touch Point Limit........................................................................ 45
8.11 Parameters - Alarm Output .............................................................................. 46
9. The Debug Window .................................................................................................. 47
9.1 PCI Communication Analysis ............................................................................. 48
9.2 Profibus Communication Analysis...................................................................... 49
9.3 TTBus Communication Analysis ........................................................................ 50
4
The TTMON Concept
1. The TTMON Concept
The TECHNA-CHECK® TTMON application is a Microsoft Windows application made for the single purpose of Machine Tool Monitoring.
TTMON implements a 1-20 channel Tool Monitoring System on a Windows XP/2000 based PC.
TTMON works as a host application for a TPCI120 PCI-card. The PCI card interfaces the application to the real world of measurement transducers and digital I/O. Even a Profibus Communication
Channel is available for the more complex machines.
Please consult the TCPCI120 Hardware Manual for information about the PCI board and Measurement Transducers.
The TTMON/PCI120 system has been exclusively developed for the supervision of cutting tools
on single spindle automatic machine tools. It is capable of detecting missing, blunt, and
broken or damaged tooling. TTMON measures, from external measurement transducer(s), either electrical power consumption or vibration of the spindle motor.
The Key Benefits of TTMON Tool Monitoring are:
.
Improved part quality
The detection of missing or broken tools helps insure that the proper machining is being performed. Detection of tool wear and damage can help improve surface finish and tolerances.
Maximized tool life
By detecting for tool wear and damage, expensive tooling can be changed before the damage gets
too severe. This detection also reduces dependence on hit or miss part counting schemes.
Protection of spindle and feed mechanism
By detecting catastrophic tool failures, the TECHNA-CHECK® TTMON can prevent serious damage to your head and feed mechanisms, not just at the station being monitored, but at downstream stations where "chain reaction" effects can occur.
Improved up time
By creating the process improvements listed above, TECHNA-CHECK® TTMON keeps your machine running longer.
Easy installation
No mechanical modification of the machinery is necessary. The entire system mounts easily in
your electrical cabinet.
5
TTMON Window Structure
1.1 TTMON Window Structure
C h an n el #7
N am e: U 7
A u to ,
M an u al,
S to p M o d e
S h o w S p in d le
S p in d le & R o ll
S p in d le & P eak S tat.
S p in d le & W o rk S tat
S tart R o llin g
S to p R o llin g
L earn C u t
E rase S tat.
Text B ar
B reak A larm
B lu n t A larm
M issin g A larm
Id le A larm
S p in d le W in d o w
C u t N u m b er S elect
P aram eter S h o rtcu t
C ycle R esu lts
TTMon opens a unique Window for each unit (spindle). The Window graphically shows the progress of the Machine Tool Monitoring and help to fine-tune the Monitoring Parameters.
1.1.1 Auto/Manual/Stop Mode
Auto/Manual.Stop Mode is selected from the buttons at the top of the screen.
In Auto Mode the windows tracks the work of the machine. When a Tool Shift occur the window
shifts to show the new tool working.
In Manual Mode it is possible to display and select cuts not currently in progress.
Stop mode is a special mode implemented for easy (graphical) adjustment of limits.
6
TTMON Window Structure
1.1.2 Spindle, Roll and Statistic
Four buttons S, R, P, W are available for selecting various display modes.
The Spindle Mode (S) is used to show only active Measurement Cycles. It is only active when the
start signal is applied.
In Roll Mode (R) the upper part of the screen shows the active cycle and the lower part of the
screen show a ’Paper Roll Window’ with all measurements including measurements done outside
of the machining cycle.
In P mode the Spindle is shown in the upper window and the Peak Statistic is shown in the lower
part of the screen.
In W mode the Spindle is shown in the upper window and the Work Statistic is shown in the lower
part of the screen.
7
TTMON Window Structure
1.2 The Task Bar
The Task-Bar is an easy and convenient shortcut to the Spindle Windows. The Task-Bar may be
placed at the Top, Bottom, Left or Right side of the screen. It may also be shut completely off. The
Task bar includes a button for each unit (spindle).
When a button flashes red an alarm is present. When a button is activated the corresponding spindle window is opened or if already opened it is brought to the front of the screen.
If the Task-Bar is not used the same functions are available from the Window Menu at the top.
1.3 The TTMON AboutBox
The AboutBox displays the current version of TTMON in this case 1.3.
8
TTMON Mapping Dialog
1.4 The Transducer Mapping Dialog Box
The Transducer Mapping Dialog determines how measurement and Digital I/O is configured for
each Channel (Spindle).
The Channel Transducer Select may be selected as Profibus, Profibus + TTBus or TTBUS.
When Profibus is selected both Digital I/O and Measurement is supplied from the Profibus
(Profibus is an Industrial Communication Bus Standard used by numerous machines).
When Profibus + TTBus is selected Digital I/O is supplied from Profibus and Measurement is
supplied from the proprietary TTBus. (TTbus is a Techna Check bus for interfacing transducers
to the TPCI120 board). The TTBus-address of the measurement transducer is selected from the
Parameters->Measurement menu.
When TTBus is selected both Measurement and Digital I/O must be supplied from TTBus transducers. The TTBus-address for the Digital I/O transducer must be entered in the I/O Address
field. The TTBus-address of the measurement transducer is selected from the Parameters->
Measurement menu.
9
The Number-of-Channels Dialog
1.5 The Number-of-Channels Dialog Box
The number of channels is programmed from this dialog box. This function is available for
Techna Tool Inc. only and is therefore Password Protected. The number of active channels is
saved in Non-Volatile Storage on the TPCI-Board.
10
The Configuration Dialog
1.6 The Configuration Dialog Box
The Configuration dialog box set various parameters common to all channels (spindles).
Profibus Address
The Profibus slave address must be programmed here.
AppBar State
The placement of the Application Task-Bar must be programmed here.
Windows Mode
For small screen resolution systems it may be useful only to have one window open and maximized at a time. This function may be activated here.
11
Load/Save Parameters
1.7 Load/Save Parameters
It is possible to load/restore all parameters for a single channel to and from the hard disk.
This function brings up a standard file dialog for naming and placement of the file.
12
Function
2. Function
2.1 General
The figure below shows a typical measurement cycle on a machine spindle during a machining
cycle. The first measurement peak, which is caused by a change in motor speed or a motor start,
is not monitored at all. Only the portion of the cut where the spindle speed is constant and the tool
is actually in cut is monitored by the unit. When the machine head begins to move towards the
part, a "Start" Signal is generated by the machine which tells the TECHNA-CHECK® TTMON that
a new cycle is beginning. When the unit receives the start signal, the user-defined Start Delay, Ts,
is activated.
Consumption
P = f(t)
Ta = 0.0 (Off) - 999,9 Sec.
Break-limit
Blunt-limit
Missing-limit
Measurement
Ts
Start Delay
Start
Idle consumption
Po
0 (Off) -250 samples
Supervision Active
t(s)
When the start delay ends, the unit initiates the idle measurement. It is very important to measure
the idle before the tool begins cutting the part. The idle measurement, Po, is the portion of work
done by the machine not going into the cut. Idle measurement will vary normally during the course
of the day due to such factors as friction, temperature, oil and grease viscosity, etc. The idle measurement is calculated as an average of a certain programmable number (Po Averaging) of measurements.
After the idle measurement has completed, the tool monitoring becomes active. The duration of
monitoring may be limited through the use of the monitoring timers, Ta and Tw , in order to avoid
monitoring undesired events, such as motor speed changes. In many cases, these timers may be
turned off, allowing monitoring for as long as the start signal is present. The TECHNA-CHECK®
TTBus transducers includes a user programmable Measurement Averaging feature, which sets
the number of individual measurements which are averaged into one calculated value (again, the
number of measurements are related to the actual transducer type). This averaging can be used to
"smooth" very noisy electrical signals, but it should be set as low as possible in order not to filter
out very short duration measurement surges caused by tooling problems. The TECHNA-CHECK®
TTMON includes a unique Analog Zoom Function, which greatly improves the monitoring of
small tools. Refer to the section on "Analog Zoom Function" for details.
13
Function
The TECHNA-CHECK TTMON is capable of monitoring 127 completely different cutting operations on each of the max. 20 channels available. This feature is useful when making multiple machining passes with the same machine head, or when making several different parts on the same
machine. Prior to the Start Signal being received, the machine signals the cut# select, which cause
the appropriate parameters to be used in monitoring the subsequent machine operation.
2.2 Learn Signal
For each type of monitoring (Missing, Break, and Blunt), there are one or more “Learn” modes
available. The Learn modes allow the monitoring to take into account variations in tool grind from
one tool to the next. In most applications, when using Learn modes, a Learn cycle should be initiated whenever the tool is changed. A Learn cycle may be initiated in three ways, as described below. It should be noted that during a Learn cycle, only Idle Power monitoring is taking place.
2.2.1 Learn Cycle Initiation -- Machine Controlled
A Learn cycle may be initiated by the machine controller. If the Start signal is made active while
the Reset signal is being held active, the cycle will be a Learn cycle. If an Idle Power fault would
occur during the Learn cycle, the reset signal must be taken low, then brought back high again to
reset the fault. The Profibus interface also implements a function for initiating a Learn Cycle.
2.2.2 Learn Cycle Initiation -- TTMON
A Learn cycle may be initiated from the TTMON software package by pressing the appropriate
function key (the Learn Button at the top of the Window)..
2.3 Fault Signals and Resetting of Faults
All faults generated by the TTMON are signaled to the machine controller by normally closed dry
contact relays (refer to the section on "Electrical Connection") or via the Profibus interface. The
Tool Break and Tool Missing faults share a common relay. It is typical that the machine will be programmed to stop its present cycle immediately and retract the machine head on detection of a
Tool Missing or Tool Break condition. The Blunt Tool fault is signaled by a second relay. It is typical that the machine will be programmed to finish the current cycle before stopping the machine on
a Blunt Tool fault.
All faults may be reset by using the RESET button located on the front panel of the unit, or through
the use of the external Reset input (refer to the section on "Electrical Connection"). The fault relays
will remain in their active (open) condition until a reset is received.
Profibus implements a separate bit for signaling the various types of alarms.
14
The Analog Zoom Function
2.4 The Analog Zoom Function
Prior to setting the monitoring parameters, it is desirable to set up the Analog Zoom Function
parameters. The Analog Zoom Function enables TTMON to monitor even very small tools by
"focusing" the unit's full analog to digital conversion resolution into a narrow band of measurement.
Note that the Analog Zoom Function should be set up prior to setting monitoring parameters, as
the monitoring parameters will be "re-scaled" if changes are made to the Analog Zoom.
The transducer measurement range must first be set. Once the measurement range has been
set, then any large idle powers may be subtracted from the display by adjusting P1Min so that the
idle is only 5% to 10% of the full load. P1Max may then be adjusted so that the cutting torque is a
rise of 10% to 20% above idle.
The figure below shows a hypothetical application to highlight the power of the Analog Zoom Function. In this application, a 380 VAC, three phase motor is being monitored. If the Current Range is
set to 10 A, then 100% power is equivalent to 6.58 kW. If a small tool with a high spindle speed is
being used, it is entirely possible that the idle power may be as high as 50% of the scale, while the
cutting torque may only rise 2% or 3%. In order to maximize the ability to monitor this application,
P1Min is "zoomed" to 50%, while P1Max is "zoomed" to 60%. The entire resolution of the unit is
now concentrated in a 10% band. The unit is now only monitoring between 3.29 kW and 3.95 kW.
The cutting torque will appear to be 10 times bigger.
Analog Zoom Function
15
Tool Missing
3. Missing Tool Supervision
3.1 Missing Tool -- Absolute Mode
The figure below shows how the missing tool detection, in Absolute Mode, is set up relative to a
typical machining cycle. The Missing Mode parameter defines the type of Missing Tool Limit
which will be set. In the Absolute mode, the Missing Tool Limit is a user-defined absolute measurement rise above idle. The measurement during the machining cycle must remain above the
limit for a cumulative time longer than the Missing Delay, Trm. (Note that the cumulative nature of
this measurement means that brief power dips below the Missing Limit will not cause a fault as
long as the TOTAL amount of time spent above the Missing Limit is greater than the Missing Delay.) In the event of a missing tool fault, a red 1 will appear in the text-table window and the Missing LED Indicator will flash red. Missing Tool supervision remains active for the duration of Tw, if
Tw is enabled. If Tw is turned off, Missing Tool supervision remains active the entire time the start
signal is present, following the Start Delay and the idle power measurement.
Tool Missing Absolute Mode
The Missing Limit is shown as the blue colored line in the graphics above. The Time-Over-Missing
is calculated for each cycle and when no Missing Alarm is present it is displayed. The Time-OverMissing is shown in the text-table instead of the alarm information. The Missing Delay may be set
as close to the Time-Over-Missing value as possible without generating nuisance trips. If a ToolBreak is not detected for some reason it is important to catch a Tool-Missing in the same or at
least the following cycle.
16
Tool Missing
3.2 Missing Tool -- Learn Work Mode
The figure below shows how the missing tool detection, in Learn Work mode, is set up relative to a
typical machining cycle. In the Learn Work mode, the Missing Tool Limit is a user-defined relative
percentage of the work calculated during the Learn cycle. If the work calculated during a cycle
does not exceed this percentage of the learned work, then a Missing alarm is generated. In the
event of a missing tool fault, a red 1 will appear in the missing window and the particular station
number will flash red. Missing Tool supervision remains active for the duration of Tw, if Tw is enabled. If Tw is turned off, Missing Tool supervision remains active the entire time the start signal is
present, following the Start Delay and the idle power measurement.
Tool Missing Learn Work Mode
Setting these parameters too aggressively can result in more frequent nuisance trips. A good compromise and starting point for adjustment seems to be to set the Missing Limit fairly low, around 30
- 50 % (since if the tool is missing, there will be NO rise above idle).
In the figure above the green color represents the learned area and the blue represents the measurement in the current cycle. In the above example the blue area represents 88% of the learned
(green) area. When the measurement is higher than the learned value it is shown as red. The
more red the more blunt the tool should be.
17
Tool Missing
3.3 Missing Tool -- Auto Learn Step Curve
The figure below shows the Auto Learn Step Curve missing mode, which is a new mode not available in previous TECHNA-CHECK® versions. In this mode the Missing Limit is calculated as a
step-curve from the original learned curve. The Missing Limit is a percentage decrease from this
learned curve. This makes the missing limit follow the curve and may result in better monitoring for
missing detection of step-tools. Even multiple spindle heads may be monitored successfully for
single missing tools with this monitoring mode, especially if the Time-Over-Missing is placed as
close to the normal value as possible. The Step-Width is programmable and a new learn cycle is
not necessary when the Step-Width is modified. If synchronization problem exists between the
learned and the monitor cycle the Step-Width should be increased in order to avoid false alarms.
Tool Missing Auto Learn Step Curve
The missing limit is drawn as the cycle proceeds and is shown in blue color.
18
Tool Break
4. Tool Break Supervision
4.1 Break Mode Selection
When a tool breaks while it is machining a part, it is typical to notice a sharp, short duration "spike"
of torque in the motor. This torque spike is the extra energy being used by the machine to actually
break the tool. The TECHNA-CHECK® TTMON can detect this spike, and indicate a broken tool.
(It should be noted that not all tools break the same way every time, and that a torque spike may
not necessarily be generated in the process of breaking the tool. In this case, a missing tool condition should be noticed on the following cycle.)
There are four Break Modes available, which are described below.
4.2 Tool Break -- Absolute Peak Mode
The figure below shows a typical tool break situation, including the setting of the tool Break Limit.
The Break Limit is a user-defined percentage increase above the Idle Power. If the Break Limit is
exceeded for a cumulative time greater than the user-defined Break Delay, Trb, then a tool break
fault will be generated. In the event of a broken tool fault, a red 1 will appear in the broken window
and the particular station number will flash red. Tool Break supervision remains active for the duration of Ta, if Ta is enabled. If Tw is turned off, Tool Break supervision remains active the entire
time the start signal is present, following the Start Delay and the idle power measurement.
Absolute Peak Break Mode
The Tool-Break Limit is shown in red color. No learn cycle is needed for this mode of Tool-Break
monitoring.
19
Tool Break
4.3 Tool Break -- Learn Peak Mode
The figure below shows a typical tool break situation, including the setting of the tool Break Limit
in Learn Mode. The Break Limit in Learn Mode is a user-defined percentile increase of the power
consumption above the Idle Power PLUS the Learned peak power. If the Break Limit is exceeded
for a cumulative time greater than the user-defined Break Delay, Trb, then a tool break fault will
be generated. In the event of a missing tool fault, a red 1 will appear in the missing window and
the particular station number will flash red. Tool Break supervision remains active for the duration
of Ta, if Ta is enabled. If Ta is turned off, Tool Break supervision remains active the entire time the
start signal is present, following the Start Delay and the idle power measurement.
Learn Peak Break Mode
The Tool-Break Limit is shown in red color. A learn cycle is needed for this mode of Tool-Break
monitoring.
Setting the Break Limit and Break Delay in Learn Mode is much the same as in the Absolute Peak
Mode, except that the Break Limit in Learn Mode will “move” with respect to the learned cut. This
adaptation allows the unit to adjust to changes in grind from one tool to the next, when the profile
is re-learned.
20
Tool Break
4.4 Tool Break -- Absolute Peak Curve Mode
The Absolute Peak Curve mode works just like Absolute Peak Mode (sec. 3.6.2), but the limit
changes in a step fashion as a function of time. This mode may well be used to supervise step
tools. If the Break Limit is exceeded for a cumulative time greater than the user-defined Break Delay, Trb, then a tool break fault will be generated. Tool Break supervision remains active for the
entire time, following the Start Delay and idle power measurement, that the Start Signal is present
on the unit if monitoring timer Ta is turned off, or for the duration of Ta if it is enabled. Three steps
are available and if a step limit is set to zero it is not monitored at all
Absolute Peak Curve Mode
The Tool-Break Limit is shown in red color. No learn cycle is needed for this mode of Tool-Break
monitoring.
If a step is set to zero it is not monitored at all. This feature may be used in monitoring tapping operations. The second step of the curve is the set to zero and used to switch-off the monitoring
when the spindle changes direction. The first step is then used to monitor the forward (tapping)
operation and step three is then used to monitor the reversal (tap getting out).
21
Tool Break
4.5 Tool Break -- Auto Learn Step Curve Mode
The figure below shows the Auto Learn Step Curve break mode, which is a new mode not available in previous TECHNA-CHECK® versions. In this mode the Break Limit is calculated as a stepcurve from the original learned curve. The Break Limit is a percentage increase from this learned
curve. This makes the break limit follow the curve and may result in better monitoring for break
detection of step-tools. Even multiple spindle heads may be monitored successfully for single
breaking tools with this monitoring mode. The Step-Width is programmable and a new learn cycle
is not necessary when the Step-Width is modified. If synchronization problem exists between the
learned and the monitor cycle the Step-Width should be increased in order to avoid false alarms.
Absolute Peak Curve Mode
The Tool-Break Limit is shown in red color. A learn cycle is needed for this mode of Tool-Break
monitoring.
22
Tool Blunt
5.0 Blunt Tool Supervision
5.1 Blunt Mode Selection
As a tool wears, it is normal for its cutting surfaces to become less efficient, and thus it requires
more torque to cut the part. The TECHNA-CHECK® TTMON is designed to look for this rise in
torque, and to stop the machine when a tool has reached a point where it would be desirable to
change it.
There are four Blunt Modes available. If Absolute Peak Mode is selected, the detection of blunt
tools is based on the value of the instantaneous torque measurement above idle. In Work Mode,
the detection of blunt tools is based on the area under the torque curve for the duration of the cutting cycle, which is proportional to the work or energy used to cut the part. Peak Mode is recommended for most simple machining operations. Work Mode may be used when there are multiple
or changing load levels observed during the cycle, such as when a step tool or complicated boring
tool is used. Additionally, there are two Blunt Modes representing Learn versions of the two
modes already described. They allow the system to automatically adjust to changes in grind from
one tool to the next.
In any blunt mode, the use of the Show Statistics option from the TTMON application is helpful in
setting appropriate values for the Blunt Limit. TTMON is continually keeping track of the peak
torque or work used in each cycle. This data may be viewed in the Show Statistics display. This
display will give you an idea, over time, of how the tool has worn, and where an appropriate Blunt
Limit may be set.
Also in any blunt mode, the Blunt Counter feature is available. In order to reduce the number of
undesired nuisance trips, the Blunt Counter may be set to require a number of consecutive blunt
tool faults to be detected before the machine is signaled to stop. For example, a hard part or temporary chip build up may cause a blunt fault to occur in one cycle, but the condition may not be
present again in the next cycle. In this case, a Blunt Counter setting of, for example, three would
require this condition to occur three cycles in a row before a blunt trip stops the machine. In typical
applications, a Blunt Counter setting from 2 to 5 is generally used, depending on material consistency and chip build-up, but higher settings may be used.
23
Tool Blunt
5.2 Blunt Tool – Absolute Peak Mode
The figure below shows a typical blunt tool situation using Absolute Peak Mode monitoring. In
this mode the Blunt Limit represents a user-defined percentage increase above the Idle Power. If
the Blunt Limit is exceeded for a cumulative time greater than the user-defined Blunt Delay, Trs,
then a tool blunt fault will be generated. In the event of a blunt tool fault, a red number will appear
in the blunt window and the particular station number will flash red. Blunt Tool supervision remains
active for the duration of Tba, if Tba is enabled. If Tba is turned off, Blunt Tool supervision remains
active the entire time the start signal is present, following the Start Delay and the idle power
measurement.
Absolute Peak Blunt Mode
The Tool-Blunt Limit is shown in yellow color. No learn cycle is needed for this mode of Tool-Blunt
monitoring.
24
Tool Blunt
5.3 Blunt Tool - Learn Peak Mode
The figure below shows a typical blunt tool situation using Learn Peak Mode monitoring, including
the setting of the tool Blunt Limit. The Blunt Limit is a user defined percentile increase above the
Idle Power PLUS the Learned Peak. If the Blunt Limit is exceeded for a cumulative time greater
than the user-defined Blunt Delay, Trs, then a tool blunt fault will be generated. In the event of a
blunt tool fault, a red number will appear in the blunt window and the particular station number will
flash red. Blunt Tool supervision remains active for the duration of Tba, if Tba is enabled. If Tba is
turned off, Blunt Tool supervision remains active the entire time the start signal is present, following the Start Delay and the idle power measurement.
Learn Peak Blunt Mode
The Tool-Blunt Limit is shown in yellow color. A learn cycle is needed for this mode of Tool-Blunt
monitoring.
25
Tool Blunt
5.4 Blunt Tool - Learn Work Mode
The figure below shows a typical blunt tool situation using Learn Work Mode monitoring, including
the setting of the tool Blunt Limit. The work, or energy consumed, during the cutting cycle is proportional to the blue area in the figure. The Blunt Limit is a user-defined percentage increase
above the Learned Work. A fault is generated if the measured work exceeds the percentage increase over the Learned Work (note that the Blunt Delay becomes inactive in Work Mode). In the
event of a blunt tool fault, a red number will appear in the blunt window and the particular station
number will flash red. Blunt Tool supervision remains active for the duration of Tba, if Tba is enabled. If Tba is turned off, Blunt Tool supervision remains active the entire time the start signal is
present, following the Start Delay and the idle power measurement. Because Work Mode monitoring calculates total energy used in the entire cycle, any faults will always be signaled at the end of
the cycle.
Learn Work Blunt Mode
The Tool-Blunt Limit is not actually shown but the green area in the above figure represents 100%
in the Work calculation. A learn cycle is needed for this mode of Tool-Blunt monitoring.
26
Tool Blunt
5.5 Blunt Tool - Blunt On Part Count
Each cut is counted by the TTMON. This part count may even be used to generate a Blunt Alarm.
The number of parts to generate a Blunt Alarm is programmable form the TTMON application. The
‘Blunt On Part#’ function must be enabled as well.
5.6 Blunt Tool - Auto Learn Step Curve mode
The figure below shows the Auto Learn Step Curve blunt mode, which is a new mode not available
in previous TECHNA-CHECK® versions. In this mode the Blunt Limit is calculated as a step-curve
from the previous learned curve. The Blunt Limit is a percentage increase from this learned curve.
This makes the blunt limit follow the curve and may result in better monitoring for blunt detection of
step-tools. Even multiple spindle heads may be monitored successfully for blunt tools with this
monitoring mode. The Step-Width is programmable and a new learn cycle is not necessary when
the Step-Width is modified. If synchronization problem exists between the learned and the monitor
cycle the Step-Width should be increased in order to avoid false alarms.
Auto Learn Step Curve Mode
The Tool-Blunt Limit is shown in yellow color. A learn cycle is needed for this mode of Tool-Blunt
monitoring.
5.7 Blunt Tool - Resetting the Part Counter
The part counter is reset to zero when a new learn is done.
The part counter may also be manually reset to zero from TTMON. When no Alarm is present the
Blunt Alarm Reset LED is used to reset the part counter.
27
Idle Monitoring
6. Idle Limit Supervision
In some applications, it may be necessary to check that the machine idle power is within certain
boundaries. For example, a very low idle power may indicate that a belt is broken or that there is
no power to the motor. A very high idle power may also indicate belt problems, or problems with
lubrication or bearings. In these cases, a high and low limit, IdleMax and IdleMin, for the idle power
may be set. After the idle power is measured and Po is calculated, the value is compared with IdleMax and IdleMin. If it is not within the limits, then a Tool Break fault occurs immediately.
Each of the Idle Power Monitoring limits may be disabled by turning them all the way down to zero.
Idle Limits
Consumption
P = f(t)
Idle Limit
1-100% Absolute
Measurement
Idle Min. Limit
1-100% Absolute
Ts
Start Delay
Start
Break-relay
28
Po
0(Off) - 250 Samples
Supervision Active
t(s)
Touch Point Limit
7.0 Touch Point Limit Function
Relay #3 output (of TTBUS IO100T) may be used as a touch point indication. If a Touch Point
Limit greater than zero has been programmed the relay no. 3 contacts are closed when the
power consumption reaches a threshold equal to Po + Touch Point Limit. The relay #3 contacts
are released again when the start signal is removed.
This function may be used in some systems to tell the tool feed mechanism that a tooling operation has begun and the feed rate needs to be decreased. The tooling cycle may be shortened if a
different, faster feed rate, can be used until the tool touches the target.
If the Profibus interface is used a separate bit signals the Touch Point Limit reached.
Touch Point Limit
The Touch-Point Limit is shown in black color.
29
Parameters
8.0 Parameters—Unit & Cut Naming
This menu makes it possible to modify the default Unit (Spindle) and Cut names.
A button for Export Statistic to a Spreadsheet File is also available. If the statistic must be erased
after export a check box for this must be activated.
30
Parameters
Export Statistic brings up a traditional file dialog box like shown below.
31
Parameters
8.1 Parameters - Measurement
The parameter menu defines the parameters related to the measurement transducer.
TTBus Transducer Address
Measurement may be supplied either from Profibus or TTBus. If a TTBus transducer is used the TTBus
transducer-address for the actual cut must be entered from the dialog above. It is possible to push a button
which copies the Transducer Address to all other cuts of that unit (spindle). Often all cuts made with a specific spindle are using the same transducer but it is possible to monitor some cuts with Power while others
are monitored for Vibration. In the future other sensor types may also be added.
RMS Averaging
If a VM100T transducer is used (a TTBus Vibration transducer) the transducer averaging period must be
programmed from this dialog box.
32
Parameters
Measurement Range
If a PWM350T or a VM100T TTBus transducer is used the measurement range must be programmed from
the dialog box.
P1Max
Analog zoom value. For small signals it is possible to increase the sensitivity by decreasing this value.
P1Min
Analog zoom value. The parameter may be useful for small signals and high idle measurements.
33
Parameters
8.2 Parameters - Averaging
Dialog box for the setting of Measurement averaging and Idle Measurement averaging.
Averaging
Averages the measurement from the Transducer, range 1 –10 measurements.
Po Averaging
Sets the number of measurements used to calculate the idle measurement value. A value of 0
(zero) effective switches the idle measurement off.
34
Parameters
8.3 Parameters - Timers
A start-delay or a monitoring length may be programmed from this dialog box.
Start Delay
A delay which may be introduced after the Start-Signal is activated to delay the actual start of the
Tool Monitoring.
Ta
Ta may be used to terminate the Tool Monitoring before the Start-Signal is removed. This is
sometimes necessary when a tool breaks through a part. For example a drill that goes through
cast iron may generate a spike, which varies a lot from cycle to cycle, and is difficult to supervise.
35
Parameters
8.4 Parameters - Start Signal Mode
This dialog box defines values related to the Start-Signal.
Start-Signal Mode
This parameter define whether the Start-Signal is a Level Signal or a Pulse Signal.
Start Length
If Start-Signal Pulse Mode is programmed the duration of the cut must be programmed here.
36
Parameters
8.5 Parameters - Force Learn
Dialog for activation of learn cut.
It is possible to learn a single cut or to force a learn of all cuts from this dialog box.
37
Parameters
8.6 Parameters - Break
Dialog box for the setting of parameters related to Tool Break Monitoring.
Break Mode
Selects the Tool Break Monitoring operating mode.
Break Limit 1
The Break Limit 1 is used by all break monitoring modes. See the description of the individual
Break Monitor modes in order to understand the precise function of this particular limit.
38
Parameters
Break Limit 2
The Break Limit 2 is used to as the Tool Break Limit for the second step when Absolute Peak
Curve Mode has been selected for the Tool Break Monitoring. If the limit is set to 0 (zero) this
step is not monitored. This limit can be adjusted graphically when display Stop Mode has been
selected.
Break Limit 3
The Break Limit 3 is used to as the Tool Break Limit for the third step when Absolute Peak Curve
Mode has been selected for the Tool Break Monitoring. If the limit is set to 0 (zero) this step is
not monitored. This limit can be adjusted graphically when display Stop Mode has been selected.
Break Point 1
This parameter sets the position where Break Limit 2 becomes active when Absolute Peak Curve
Mode has been selected for the Tool Break Monitoring. This position can be adjusted graphically
when display Stop Mode has been selected.
Break Point 2
This parameter sets the position where Break Limit 3 becomes active when Absolute Peak Curve
Mode has been selected for the Tool Break Monitoring. This position can be adjusted graphically
when display Stop Mode has been selected.
Step Width
The Step Width parameter is used only when AutoLearnCurve Mode has been selected for the
Tool Break Monitoring. The Step Width defines how close the Tool Break Limit Step-Curve is
placed to the learned curve. The more the monitoring cycle shifts in time from the learn cycle to
the monitoring cycle the higher value most be used. It is not necessary to perform a new learn
when this value is changed. The AutoLearnCurve monitoring mode is also available for Blunt and
Missing monitoring and the Step Width parameter is shared among the different types of monitoring
Break Delay
The Break-Delay defines the reaction time for the Tool Break Monitoring.
39
Parameters
8.7 Parameters - Blunt
Dialog box for the setting of parameters related to Tool Blunt Monitoring.
Blunt Mode
Selects the Tool Blunt Monitoring operating mode.
Blunt Limit
The Blunt Limit is used by all blunt monitoring modes. See the description of the individual Blunt
Monitor modes in order to understand the precise function of this particular limit.
40
Parameters
Blunt Delay
The Blunt-Delay defines the reaction time for the Tool Blunt Monitoring. This parameter has no
effect when Blunt Learn Work Mode has been selected.
Step Width
The Step Width parameter is used only when AutoLearnCurve Mode has been selected for the
Tool Blunt Monitoring. The Step Width defines how close the Tool Blunt Limit Step-Curve is
placed to the learned curve. The more the monitoring cycle shifts in time from the learn cycle to
the monitoring cycle the higher value must be used. It is not necessary to perform a new learn
when this value is changed. The AutoLearnCurve monitoring mode is also available for Break
and Missing monitoring and the Step Width parameter is shared among the different types of
monitoring
Blunt Count
This parameter defines how many consecutive times the blunt limit is exceeded before the unit
actually generates the Blunt Alarm.
Tba
Tba may be used to terminate the Tool Blunt Monitoring before the Start-Signal is removed. This
is sometimes necessary when a tool breaks through a part. For example a drill that goes through
cast iron may generate a spike, which varies a lot from cycle to cycle, and is difficult to supervise.
Blunt On Part Count
A part-counter is maintained for each cut. The part-counter counts the machining cycles which
does not generate an alarm (good parts counting). This parameter defines whether the partcounter should be used to generate a Blunt Alarm or not. The part-counter is reset to zero when
a learn-cycle is initiated. The part-counter may be reset manually by pressing the Blunt Alarm
LED when no other type of Blunt Alarm is present.
Blunt Part Count
If Blunt-On-Part-Count has been enabled (see above) then Part Counter limit is programmed in
this parameter.
41
Parameters
8.8 Parameters - Missing
Dialog box for the setting of parameters related to Tool Missing Monitoring.
Missing Mode
Selects the Tool Missing Monitoring operating mode.
Missing Limit
The Missing Limit is used by all missing monitoring modes. See the description of the individual
Missing Monitor modes in order to understand the precise function of this particular limit.
42
Parameters
Step Width
The Step Width parameter is used only when AutoLearnCurve Mode has been selected for the
Tool Missing Monitoring. The Step Width defines how close the Tool Missing Limit Step-Curve is
placed to the learned curve. The more the monitoring cycle shifts in time from the learn cycle to
the monitoring cycle the higher value must be used. It is not necessary to perform a new learn
when this value is changed. The AutoLearnCurve monitoring mode is also available for Break
and Blunt monitoring and the Step Width parameter is shared among the different types of monitoring
Missing Delay
The Missing Delay defines the time for which the measurement must exceed the Missing Limit in
order not to signal a Tool Missing fault. When no Missing Alarm is present the Time-OverMissing for the previous machining cycle is shown on the screen instead of the alarm indication.
If for some reason a Tool Break is not detected it is important to detect a Tool Missing in the
same cycle or at least the following cycle. When the Missing Delay is placed close to the TimeOver-Missing from the previous cycle there is a better chance for the missing fault to be generated in the same cycle if the Tool Break was not detected.
Missing Count
This parameter defines how many consecutive limit exceptions is needed in order to actually
generate the Missing Alarm.
Tw
Normally the complete machining cycle length is used for the Missing Monitoring. If Tw is used
(not zero) the the Missing Delay must be satisfied within the time Tw.
43
Parameters
8.9 Parameters - Idle Limit
Dialog box for the setting of parameters related to Idle Monitoring.
Idle Max. Limit
If the Idle Max. Limit is enabled (not zero) the idle measurement must be greater than the Max.
limit in order to generate an Idle Alarm.
Idle Min. Limit.
If the Idle Min. Limit is enable (not zero) the idle power must be below the Min. limit in order to
generate an Idle Alarm.
44
Parameters
8.10 Parameters - Touch Point Limit
Dialog box for the setting of parameters related to the Touch Point feature.
Touch Point Limit
A value different from zero enables the Touch Point function.
45
Parameters
8.11 Parameters - Alarm Output
Dialog box for the setting of parameters related to Alarm Generation.
Alarm Output
Alarms may be Armed or Disarmed from this parameter. This parameter is common to all cuts for
the unit (spindle) selected.
46
The Debug Window
9.0 The Debug Window
The Debug Window helps to analyse communication issues.
47
PCI Communication Analysis
9.1 PCI Communication Analysis
The Debug Window helps to debug communication issues.
The first two lines display the type of card found (TPCI120) and the software version of the firmware running on the board (1.0). The number of channels (20 in this case) is shown. A TimerTick
value is read from the board and displayed.
The second line includes information regarding PCI communication.
The first 3 hexadecimal numbers must be counting (changing) and the last number must be constant. The last number (000350B8 in this case) counts loss of telegrams in the communication between the PCI-board and the TTMON application. Under normal circumstances this will count only
when TTMON is not started and stay constant when TTMON runs.
48
Profibus Communication Analysis
9.2 Profibus Communication Analysis
The Debug Window helps to analyse communication issues.
The next section includes information about the Profibus Communication
The important information is to know the number of Telegrams transferred every second. In this
case 100 telegrams is transferred every second. The number of telegrams per second should be
higher than 50 otherwise excessive timing jitter from cycle to cycle is introduced.
The next few lines shows a lot of low-level communication information.
The DP-Master Output section displays the data received from the Profibus Master. One number
is received for each channel. This number includes cut#, start signal, learn signal, reset signal and
eventually a measurement value. In the above example only 8 channels are used and the remaining 12 channels are zeroed.
49
TTBus Communication Analysis
9.3 TTBus Communication Analysis
The Debug Window helps to analyse communication issues.
The remaining of the screen shows TTBus information.
Each TTBus transducer must be assigned a unique bus address in the range from 0 - 49. The address is programmed by two rotary BCD-switches located at the front of the transducer. When a
TTBus transducer is attached it is automatically recognized and shown in the above list within 1
minute.
The text displayed with each address above shows the type of transducer and its software version.
The text ‘VM100T-1.1’ is equal to a VM100T transducer running firmware version 1.1. The number
following is the number of telegrams received from this transducer. The next number represents
the number of communication timeouts. The timeout value for transducer is usually zero and the
remaining timeouts will be slowly counting. Finally a measurement value or Digital I/O information
(in case of IO100T transducer) is shown.
The TTBus transfers 2804 telegrams per second. In the example above 7 sensors are attached
and each sensor will transfer 2804/7 telegrams per second.
50