1
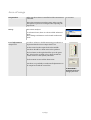
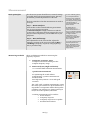
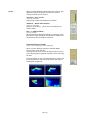
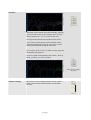
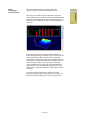
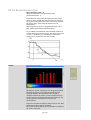
XTZ ROOM ANALYZER PRO
Software for room analyzing and measuring
frequency response
User manual
© 2009 XTZ AB , www.xtz.se
Table of contents
Page:
Introduction
3
About XTZ
4
Technical presentation
5
Preparations
7
Basics of sound / Installation and placement tips
8
Mounting and connecting
10
Functional reference
11
Area of use
17
Measurement
18
Frequency response - RTA
20
21-25
Room Analyzer
•
1 Position measurement
21
•
3 Position measurement
23
Spectrogram
26
Advanced features
28
Full Range
29
RT60
32
Technical explanations
33
Technical specifications
35
Service & Support
35
2 of 37
Introduction
Introduction
Congratulations to your purchase of XTZ Room
Analyzer
XTZ Room Analyzer provides many possibilities, in
order to utilize this product in the best way, please
read the manual carefully before using Room
Analyzer. It takes patience to optimize a hifi system. If
you lack experience from this kind of measurements
or have any questions, please contact our “free of
charge” support. (Support info on the last page of the
user manual)
3 of 37
About XTZ
Philosophy
Our reference and ambition is to reproduce a natural
sound, keeping in mind that acoustics is always a
matter of taste.
With Room Analyzer, this goal is easier to achieve.
XTZ Goals
Our main goal is to provide the best value for
money.
Our concept:
- Cut the numbers of middlemen
- Put more money into product quality
and less on advertising.
- Cost-effective manufacturing in large volumes
- Provide perfect technical solutions
Contact
Website: www.xtz.se
E-mail: [email protected]
4 of 37
Technical presentation
Why a room
analyzing software?
The fact that the room adds colouration to the sound
is known, but it is often brought out of the light
because it is hard to handle with conventional
products.
Every room has unknown and unique acoustic
characteristics that affect the sound quality. The
biggest problems are in the low-frequency spectrum.
A normal (not acoustically treated) room has several
resonances and dips in that spectrum caused by so
called standing waves. Depending on the listening
position these produce incorrectly balanced sound.
Symbolic picture.
The frequency response of a good loudspeaker should
be in the range of ± 3dB, but a normal room can
introduce variations of ± 15dB. This leads us to the
conclusion that even a very good loudspeaker can
sound poor in a "bad" room. Most regular rooms
suffer from severe acoustic problems.
Why a room
measurement
software?
Regardless of the cost of the system, you always have
use for this instrument, helping you to optimize your
system. Room Analyzer provides an advanced
analysis, as the name indicates, of the problems that
exist in the room/system.
Symbolic picture.
If you spend a great deal of money on your system, it
is our experience that it is a “must” to optimize the
room or “remove” the problem with DSP technology
(Ex 99W12 DSP). For this kind of work, Room
Analyzer is perfect.
A comparison with cooking: Using a timer and a
thermometer helps obtaining the same perfect result
every time. Room Analyzer gives a picture of which
frequencies in the bass region cause the problems and
hints of how to correct them. Room Analyzer can
measure the frequency response of any speaker.
Room Analyzer provides more analysis:
1. Frequency response with Room Analyzer
(16-250 Hz)
a. Find room modes
b. Reverberation Time diagram
(Time/Frequency/Level)
c. Simulates the use of PEQ
(Parametric Equalizer)
2. Frequency response with RTA (Real Time
Analyzer 20-20000 Hz)
3. Full range measurement
a. Full range measurement (FFT)
20-20000 Hz
b. Waterfall 3D/2D
c. RT 60 measurement
5 of 37
The analysis render the following areas of
use:
• Give exact values for compensation for the room
modes, to a subwoofer with PEQ. (ex XTZ 99 W12
DSP)
• While adjusting placements of
speakers/subwoofers
• While optimizing the room with absorbents,
diffusers, sound traps and more
• Measuring speakers/subwoofers
Computer/System
demands
Minimum system:
P3 - 1 GHz.
1024x768 resolution, 256
The system demands are Win XP.
Room Analyzer works on Vista, but is recommended colours.
Windows XP (512MB ram)
The system is based on PC technology.
to run on XP.
Room Analyzer can be run on Mac (Under Bootcamp
or Fusion with XP)
Microphone
The microphone is manufactured to match our
requirements and the software has built in
corrections for the deviations in frequency response.
Software
The software is specially designed for XTZ by a well
established audio software company.
The software can be downloaded from our website.
Size ~ 1 Mb
6 of 37
http://www.xtz.se
If no file download is
possible, we will provide you
with a CD.
Preparations
Unpacking
Check that all items are included
Accessories
1pcs Microphone med USB contact
1pcs Base/microphone stand with USB contact
1pcs RCA cable (5m)
1pcs Male/male adapter (RCA)
1pcs RCA Y-cable
User manual
Installation
Download the software from XTZ website and follow
the instruction of the installation
7 of 37
http://www.xtz.se
Basics of sound / Installation and placement tips
This chapter contains general information about
loudspeaker placement and installation.
These are general rules, so there may be exceptions.
In which room do
you achieve the best
sound?
Regardless how good the equipment is, in the wrong
listening environment it will inevitably sound poor.
There are some basic rules concerning proper
loudspeaker installation:
Reflections
Carpets, curtains and soft furniture absorb mid range
and high frequency sounds, and this is preferable.
Big empty areas, on the contrary, produce hard
reflections that may lead to a blurry dialogue. Apart
from colouring the sound, the perspective of the
sound will also deteriorate. Reflections from the
room can roughly be compared to the reflections that
cause ghost pictures on a TV screen.
Amplification of bass When a loudspeaker is placed near a wall or floor
frequencies
lower frequencies will be amplified, sometimes in a
not desirable way (since it may lead to indistinct
sound reproduction). This amplification becomes
even more obvious if the loudspeaker is placed near a
corner.
However, sometimes this can be desirable, and it is
important to have good knowledge about floors,
walls and ceilings.
There are constructions specially developed for
placement near walls, according to the instructions.
Furniture
Be aware that furniture may vibrate; creating
disturbing sounds and rattles at loud levels.
Room dimension
Quadratic rooms or rooms where the length is exactly
twice as long as the width should be avoided, since
they may create unwanted resonances.
Placements of
speakers
The way the loudspeakers are placed towards the
listener is of great importance.
Front speakers
In order to get the best results the front speakers
should be placed symmetrically in front of the
listener. The distance between the front speakers
should be about 80% of the distance to the listener.
In other words, the recommended angle between the
front speakers should be 45°.
Angling?
You can place the loudspeakers angled in towards the
listener or straight ahead.
8 of 37
By angling the loudspeakers inwards, you decrease
unwanted reflections, enhancing the stereo
perspective.
Correct height
If the loudspeakers are small, they should be placed
on stands or tilted so that they are on the same level
as the ears.
Some speakers have other recommendations from
the manufacturer – in that case, follow those.
Cables
Try to keep cables as short as possible. By its
electrical properties, a long conductor will have more
influence on the sound than a short one. It may also
work as an antenna, receiving various signals that
may become a constant noise in an active subwoofer.
Make sure that all connections are clean and not
oxidized. All connections should be mechanically
stable, both power, signal and loudspeaker cables.
Signal cables should be separated from other cables.
Background noise
Important!
External noise from trucks, train, traffic etc can
easily disturb the measurement process.
If the measurement result looks strange in any way
you should do the same procedure again once or
maybe twice. If you get the same result again you can
be sure that it is correct.
Finally
Please remember that “good” sound is a matter of
taste, so you have to experiment to obtain your
personal goal. We wish you best of luck!
9 of 37
Mounting and connecting
Connections
Download the software from our website and install it
according to the instructions.
Connect the microphone to the USB port on your
computer.
The microphone can be connected directly to the
computer or to the base if you need a longer cable.
Connect the RCA cable to the RCA connector on the
microphone (or by the connectors in the base) to an
input (AUX/TV/IN) on the amplifier or low level input
on the subwoofer.
If Room Analyzer is connected to the system (Front
speaker + sub) a Y-cable is needed. Connect this to
AUX/TV or any other input.
Front speaker + sub should be connected when the
final adjustments are being made, by Frequency
response - RTA. This is needed to see how much the
front speakers add to the measurement.
Restart the computer.
Placing the
microphone
Room Analyzer (High resolution)
The microphone should be placed in the height of 70110cm from the floor.
Frequency response - RTA
When measuring the full frequency span, the
microphone should be pointed towards the speaker.
(The microphone is sensitive of directions over 5kHz)
10 of 37
http:// www.xtz.se
The amplifier/subwoofer
should be turned off while
connecting the microphone.
Functional reference
Main windows
1
Room Analyzer
Shows the frequency response (Blue curve), room
modes (Green curve) and calculated result curve
(White curve)
11 of 37
With a “double-click” in the Room
Analyzer window you change
information between Room Analyzer
(1) and spectrogram (3).
Select what curve to display by
clicking the boxes.
2
RTA (Real Time Analyzer)
Measured frequency response ( in real time) with a
resolution of 1/3 octave.
3
Spectrogram – reverberation time
Shows the result of the room analysis.
The Time spectrum analyzer displays a colour
spectrum in frequency, level and time.
The spectrum shows the reverberation time in the
room.
12 of 37
4
Full Range
Shows the frequency response from the
measurement.
Time window options are Anechoic, Ambient &
Raw
Water fall can be shown in 3D and 2D
5
Output level
Adjusted with level control.
The signal level shows to the right of the control.
The level should be on green.
Red= too high. Blue = Too low
6
Measure/Start the measurements
By clicking on the Measure-button, you start the
measuring procedure.
7
Measuring window – Room Analyzer
“1 position measuring”
With ”Average 3 positions” unmarked, it is a one
position measurement, in the sweet spot or specific
13 of 37
place.
(Symbolic picture of the 3 measuring positions)
“3 positions measuring”
Mark ”Average 3 positions” , it gives an average
value calculated and measured on three positions.
8
Room Modes
In the window you can find the modes the software
has found and the recommendations for
countermeasures.
Referred to XTZ 99W12 DSP or other subwoofers
with PEQ.
9
Smoothing
Smoothing determines the resolution of the curves.
This is a balance depending on equipment as well
as your individual choice.
With the highest resolution it is impossible to
achieve a completely flat frequency response.
2 ppo, 3 ppo and 6 ppo is the option
(ppo - part per octave)
Stimulus EQ - Only visible in ”advanced
mode”
10
Stimulus EQ
The Room Analyzer proposes some values for use
with a PEQ (Parametric EQ), these values can be
copied to Stimulus EQ window. If making a new
measurement with the Stimulus EQ, the result
would be like using a PEQ.
Values are suited for XTZ 99W12
DSP or other subwoofers with PEQ
Stimulus EQ - Only visible in ”advanced
mode”
14 of 37
11
Store curve – Full Range
An option to store 4 curves on the screen at the
same time.
Excellent tool to have when comparing different
settings and/or placements of the speaker.
Gives you the result direct on the screen.
A click on “Show” turns on/off the curves.
Only visible in ”advanced mode”
12
Export multi
Export ROOM, RTA or both information to XTZ
DSP Products
15 of 37
This is about File menu and the options
File
New
Open
Save
Save as…
Export curve
Export Screen Dump
Print
View
Toolbar
Statusbar
Color Theme
Setup
Advanced mode
Help
About XTZ…
Loads earlier stored curves
Saves the measurement
Exports the measurement to a textfile
Exports the measurement to a picture (.bmp)
Prints the measurement
Black/White
Shortcuts to ”Save”,”Load” resp. ”Print” functionen
Shows the marker in Frequency and magnitude
Dark/Bright - Changes color theme in the program
Bright or Dark
More options/settings for some functions
• Stimulus EQ
• Smoothing possibility
• Load/Save (curves)
• Change of scale (RTA window )
•
Export Room Analyzer & RTA
Software version
16 of 37
Area of usage
Preparation
Make sure the software is installed and the equipment is See mounting
connected.
Before the measuring procedure starts, make sure the
microphone is placed in ear height when adjusting the
output level.
Set up
Start ‘Room Analyzer’
For advanced users, there is a choice called ‘Advanced
Mode ‘.
More settings and features can be found in Advanced
mode.
Level adjustment
Output level
In order to achieve a reliable measuring procedure it is
important that the correct output level is set.
Put the control on the output level in the middle.
Now there should be a white noise in the speakers.
The level meter to the right should be up to the green
“G”. If the level is too high or low, adjust it with the
volume control on the system/subwoofer.
Click on ‘STOP’ to turn off the white noise.
Now there is a possibility to make small adjustments on
the output level with the control bar.
REMEMBER!!
HIGH SPL level can
damage your ears.
17 of 37
Measurement
Basic principles
The subwoofer/system should have as neutral settings
as possible before the measurement begins. This way,
the smallest possible adjustments can be used.
The basic principle is that the measurement is made in
two steps:
Step 1 – Room Analyzer
Room modes are best treated with PEQ (Parametric
EQ), for more accurate precision.
Use Room Analyzer at high resolution to find the
room modes. If the Room Analyzer suggests the use of
PEQ (Parametric Equalizer) you will need this in your
equipment.
Step 2 – RTA/Full Range
After adjustments of the room modes, adjust the
frequency response in the sweet spot with the RTA /
Full Range (frequency response) with graphic EQ
and/or parametric EQ.
Measuring methods
There are different methods for measuring the
frequency response:
1. Frequency response - RTA
A simple measurement which gives the
complete frequency range.
2. Room Analyzer (High resolution)
1 or 3 position high resolution measurement.
1 position measurement
For optimizing the sound without
compromising “1 position measurement”
should be used.
Ex A high end system in a room with good
acoustics.
The “risk” with “1 position measurement” is that
the sweet spot could be in a dip. Sometimes it is
impossible to compensate without having other
problems. One solution is to change sweet spot
and/or move the speakers/subwoofer.
1 position measurement can be used for:
• Room Analysis
• Frequency response
• Frequency response on a speaker
• Reverberation analysis
18 of 37
For users with PEQ options
Room Analyzer finds the
largest and most significant
room modes. The reason for
not finding all existing modes
is that the number of
suggested PEQ filters will
then be infinite.
The additional info
corresponds only to “1
position measurement”. If
you are not satisfied with the
resulting frequency response
the “High resolution
measurement” can be
repeated. More PEQ filters
can be added to achieve a
better end result.
You can also use the function
“Manual adjustments of
curves”, described under
“Advanced functions”. This
requires more PEQ filters
being available.
3 position measurement
In normal case, the recommendation is “3
positions measurement”. The measurement is
made on 3 positions in the room, to give a more
secure measure, to find the room modes easier.
(Weight 30%, 40%, 30%, on the measuring)
3 positions measuring can be used for:
• Room Analysis
•
Reverberation analysis
3. Frequency response - Full Range
A measurement 20-20000Hz which gives the
complete frequency range. This is done with
sweep instead of noise (as in RTA
measurement)
Time windows options are Anechoic, Ambient
and Raw.
RT6o information of the reverberation time, is
given acc. to ISO3382
19 of 37
Frequency response - RTA
RTA
RTA (Real Time Analyzer)
RTA measurement is a full
range measurement. At
frequencies over 5kHz, the
microphone is more sensitive
for directions and should be
aimed towards the source.
Click on the RTA tab.
Click on ‘Measure’ to start the measuring process and
stop it by clicking on ‘Paused’.
The RTA displays the frequency response in real time
and shows measured levels with 1/3 octave resolution.
RTA has not got as high a resolution as ‘Room Analyzer’,
but it gives a good opinion about the hearing sound in
average, perfect to use as a constant frequency response
measuring unit, when adjusting the position of speakers
or adjusting a graphic equalizer.
There is a listener mode. Click on “Listen” to activate it.
This mode is not suitable for adjustments.
Each bar shows the level on a fixed frequency. Below the
bars is information of the reference level
for each frequency.
Change the scale with the dropdown menus to the right.
Perfect to use as a constant frequency response meter
when trying to find a good placement for a subwoofer or
speakers, adjustment of GEQ (Graphic EQ)
Export:
There are two ways of exporting the RTA values (to XTZ
99W12 DSP), either by the “EXPORT” button (which is
accessible after 7-8 seconds) or by the quick links in the
menu.
The export function can be used in three ways.
ROOM - The PEQ settings are exported.
RTA - The GEQ settings are exported
BOTH - Both RTA and ROOM are exported.
OBS!
When doing room analyzing, the RTA measurements
should be done after the room analyzing.
20 of 37
Room Analyzer (High resolution)
1 Position measurement
Start the
measurement
Click on measure to start.
1 Position measuring
Room Analyzer
Unclick ”Average 3 positions”
Click on ”Measure” and the procedure starts.
After a short while of calculations, the result is
presented.
Double-click
In the main window, the frequency response is now
shown.
To the right in the smaller window, the reverberation
time is shown.
A double click in the main window and the information
in the windows changes.
There are three different curves.
Choose by clicking on the right side (see picture):
•
•
•
Measured - Blue curve
Modes+EQ - Green curve
Result - White curve
The standard curve, the blue, is the measured frequency
response.
21 of 37
Double-click
The green curve shows the frequency response for room
modes and EQ adjustments (Recommended in Found
Room Modes). The values in “Found room modes” are
those who are shown in the green curve.
The White curve is the theoretical frequency response
after using PEQ settings (On the chosen spot) - Result.
The picture shows both measured frequency response
and the theoretical curve.
Only shown in ”Advanced mode”
If another resolution is wanted, use smoothing. 2, 3 & 6
ppo (points per octave) can be chosen.
22 of 37
Smoothing determines the
resolution of the curves.
This is a balance depending
on equipment as well as your
individual choice.
Room Analyzer (High resolution)
3 Position measurement
Start the
measurements
Click on measure to start.
3 Positions measurements
The square ”Average 3 positions” should be marked.
To obtain a good result, the measuring spots should not
be very close to each other.
Place the microphone to the left in the room.
(as shown on the picture)
Read the difference
between 1 and 3 position
measurement - Technical
explanation
Click on “Measure” and the measuring process starts.
(A sinus sweep will be played)
Move the microphone to the sweet spot
(as shown in the picture)
Click on ”Measure” and part 2 starts.
Move the microphone to the right in the room
(as shown on the picture)
Click on ”Measure” and measuring 3 starts.
The measuring procedure is now finished!
23 of 37
Room Analyzer
After a short while of calculations, the result is
presented.
Double-click
In the main window, the frequency response is now
shown.
To the right in the smaller window, the reverberation
time. If you double click in the main window the
information in the windows changes.
There are three different curves.
Choose by clicking on the right side (see picture):
•
•
•
Measured - Blue curve
Modes+EQ - Green curve
Result - White curve
The standard curve, the blue, is the measured frequency
response.
The green curve shows the frequency response for room
modes and EQ adjustments (Recommended in Found
Room Modes). The values in “Found room modes” are
those who are shown in the green curve.
24 of 37
Double-click
The White curve is theoretical frequency response
(On the chosen spot) - Result. How it would look if the
values from “Found room modes” are used with PEQ
The picture shows both measured frequency response
and the theoretical curve.
Only shown in ”Advanced mode”
If another resolution is wanted, use smoothing. 2,3 & 6
ppo (points per octave) can be chosen
25 of 37
Smoothing determines the
resolution of the curves.
This is a balance depending
on equipment as well as your
individual choice.
Spectrogram
In the little window up to the right, the reverberation
time is shown in the spectrogram.
Double click
Double click to change place of the information.
The Spectrogram shows a colour spectrum of frequency,
magnitude and time. It could be called a 2D water fall.
The spectrum shows the reverberation time. An uneven
spectrum shows a non linear frequency response.
Laggings are proof of long reverberation time in the
room.
The different information can be seen, by choosing
Result, Modes + EQ, Measured.
Two examples:
A ‘bad’ room, with long reverberation time, substantial
room modes.
A good room with short reverberation time and decent
frequency response.
26 of 37
Double click
Found Room Modes
The Found Room Modes are presented here.
MODE: Room Modes (Is the first priority for Room Analyzer)
EQ: A peak/dip that needs treatment.
The values that are presented in Found Room Modes are
values that directly can be used in a subwoofer with
PEQ.
The values can be set manual, by right-click the value.
This can be exported to XTZ DSP products.
Export to
XTZ 99W12 DSP
The presented values in ‘Found Room Modes’ can be
exported.
Click on “Export” to export the presented values.
It is possible to export the values by clicking on ‘ROOM’
in the short cut menu
The exported settings can now be imported to 99W12
DSP by PC-REMOTE (Software to do settings on 99W12
DSP)
Stimulus EQ
The Room Analyzer presents values (based on the
measurements) for use in a PEQ. These values can be
copied to the Stimulus EQ window. If a new
measurement is made with values in Stimulus EQ, there
will be a result as if there had been an adjustment with a
PEQ.
Click on ‘Copy Room Modes’ and the values are copied
to the Stimulus EQ window.
Remove these by clicking on ”Clear Stimulus EQ”
Final adjustments
with RTA/Full Range
With a graphic EQ, the frequency response can be
adjusted, with Frequency response - RTA/Full
Range.
The room compensation is now done!
If the measures are made with a subwoofer, there will be
a difference when the complete system is connected.
So it could be wise to do a Frequency response RTA/Full Range on the complete system.
If the final result is not to your satisfaction, it could be
caused by measuring disturbance. Please redo the
measuring procedure.
(More information about Frequency response RTA, see page 18. Full Range page 30)
27 of 37
Advanced features
Manual adjustment
of curves (Drag &
Drop adjustment)
These options are only displayed in ”Advanced mode”
For the advanced user there is a function available to
manually adjust the frequency response curve.
By grabbing a peak or dip, and right clicking the mouse,
you may correct the curve manually. By moving the
mouse sideways the frequency is altered.
Releasing the mouse button will produce new
suggestions for the PEQ in order to achieve the desired
curve. The new PEQ suggestions are editable for a more
precise adjustment. This is done by double clicking the
value to change, or right click then select ”properties”.
This requires more PEQ´s available.
Important!
Use these options with great care. An increase at
any frequency may cause substantial amplifier
load.
Adjustment of the
time axis
Important!
Room Analyzer measures the frequency response at time
zero. This point is indicated with a yellow line in the
spectrogram. The yellow time line can be moved by
clicking it, then holding the left mouse button down
while moving the mouse. The frequency response at the
specific time (0-250 ms) is now shown in red.
This explains why the frequency response may seem
unsatisfactory even after being adjusted with PEQ and
GEO at the time zero. The other way around, a perfectly
straight frequency response may not be ideal, since noise
and defects appearing later than time zero affect the
reproduction.
The experienced frequency response equals the sum of
the energy over time at each frequency, as displayed by
the RTA.
28 of 37
New PEQ suggestions may be
imported to XTZ W12 DSP
without overwriting data
imported earlier. These have
to be added manually.
Frequency response Full Range
Full Range
The Full Range tab contains a high resolution full
frequency measurement option. You can choose how the
data will be presented.
The tab also displays a 2D/3D waterfall, where the
measurement can be seen as function of time
(0-200ms).
Working areas
The Full Range tab has a split user interface.
By clicking on the grey area between the two
measurements and drag, you can alter the size of the
working areas.
29 of 37
Views
There are three different graphs that can be shown. The
different between the graphs are the time window
settings. Default view is Anecoic
Anechoic –Non reverb
(300/4 ms, Multi-Win)
Displays the results with limited room effects
Ambient – Room information
(300/8 ms, Ambi-Win)
Displays room effects – phase errors and reflexes are
clearly visible.
Raw – Unfiltered data
(300 ms, Full FFT)
All information is displayed without any filtering. Every
little detail, reflex and phase cancellation is visible. This
measurement has the highest resolution.
Waterfall diagram (CSD)
(300ms /slice, total längd på 200ms, sliding CSD)
There are three different 3Dviews available (Right,
Front,& Left), and a 2D view.
In the 3D chard, the X-axel is showing frequency. The Yaxel is showing the magnitude and the Z-axel is showing
the time.
In the 2D Chard, X-axel is showing frequency and Y-axel
is showing the time. The second X-axel (to the right) is
showing the magnitude.
30 of 37
Overlays
Full Range measurement offers the possibility of having
4 curves stored on the screen. Storing a curve is easily
done by clicking on 1,2,3, or 4 in the overlay area.
It is only the last measured curve that can be stored.
If you want 4 measurements stored and then make a
5’th measurement. Press Ctrl+N, to prepair for a new
measurement (without losing the 4’th curve)
If you want to store a curve on a taken overlay, just press
the number and replace it.
To show or hide a measurement, click “Show 1, Show 2,
Show 3 or Show 4” to show or hide it.
Picture showing number
1 & 3 active.
Volume settings
The volume is set by adjusting the knob to the right. A
higher spl level often produces better measurement
accuracy.
31 of 37
Start
Full Range
measurement
The measurement starts by pressing Measure.
4 sweeps follows and the measurement is done.
This gives you results in form of frequency response
curves where you can view the curves with different time
windows. RT60 information, the reverberation time of
the room acc. to ISO3382. And the waterfall diagram in
3D or 2D.
When measurements are done at further distance at
lower frequencies, dips are likely to occur. These are the
phase cancellations that depend on the room itself,
microphone- and speaker-placement. Measurements on
loudspeakers in lower frequencies (20-500Hz) should
be done at close range (0-50cm) to get an accurate
result. At distance over 50cm the room will effect the
measurement a lot. The different between close range
measurement and from a distance is the influence from
the room.
To get an accurate evaluation of all the presented
information, knowledge and experience is a must, but
feel free to ask us anything if you have any questions.
32 of 37
RT 60 Reverberation time
Reverberation time - T
The most important room parameter is the
reverberation time - T.
It is defined as a time interval required for the sound
energy to decay 60 dB after the excitation has stopped.
To get the reverberation time (RT), we need to measure
the energy decay curve after the sound source is
switched off.
The energy decay curve is a irregular and noisy curve
that usually approximate with linear decay,
To get a RT60 measurement, the excitation needs to be
at least 60db above the noise level. Normal noise level in
a room is ~40dB. To get a reliable T60 value, there
needs to be a sound level of at least 100dB.
RT 60
Reverberation window
The RT60 is shown according to the ISO3382 standard.
Reverberation time is normally measured between
125Hz & 4000Hz. Reverberation below 125Hz, is
normally called room modes. At lower frequencies the
result is unsure and for frequencies above 4000Hz, the
air absorption is essential to the result of the
measurement.
In the bass area Room Analyzer tab is better to use. This
measurement has a higher resolution.
The trends of the frequency above 4000Hz are similar to
the result of 4000Hz.
33 of 37
Technical explanations
Room Modes
Room modes appear due to sound reflexes in
the room.
Direct sound and reflexes makes a pattern in
the room and when same frequency is in
phase, you get room modes. (Standing waves)
Dips
If the frequency is in counter phase it
produces dips in the frequency response.
(nodes)
If extreme dips are found by Room Analyzer
(1 position measurement), it may be
impossible to correct. Change of the sweet
spot or speaker position is recommended in
this case.
peak
An extreme dip is shown as a valley in the
frequency response measurement.
dip
1 Position
measurement
3 Positions
measurement
(Average 3 positions)
When optimizing the sound without
compromising, “1 position measurement”
should be used. Ex A high end system in a
room with good acoustics.
The risk with “1 position measurement” is that
the sweet spot could be in a dip. Sometimes it
is impossible to compensate for without
having other problems. One solution is to
change the sweet spot and/or move the
speakers/ subwoofer.
Control measurement or measurement of the
speaker or specific positions in the room - Use
“1 position measurement”.
In normal case, the recommendation is “3
positions measurement”. The measurement is
made on 3 positions in the room, to give a
more accurate result, finding the room modes
easier.
Correcting the main modes in the room, gives
a better average listening result.
Parametric EQ (99W12 DSP) helps a lot
working on the main modes. Use both
methods and compare the results to find
what’s best for your room,
Spectrogram
Shows how long time it takes for the intensity
of the sound has reduced to a certain level. All
room has a certain reverberation time. A long
Reverberation time affects the sound.
A hard hand clap and the following echo is an
indication of Reverberation time.
34 of 37
A short reverberation time is always better. In
the midrange and tweeter this can be obtained
by adding curtains and carpets in the room.
Room Analyzer
Room Analyzer shows the frequency response
(Blue curve) with high resolution
It shows the exact response down to each
frequency. That is why all defects are revealed
with this resolution. The resolution can be set
to different levels (Smoothing)
Room Analyzer shows the Room modes (green
curve). Room Modes are caused by the room
and the ideal is trying to remove all modes.
The calculated value is shown in the white
curve. If 99 W12DSP is used, the response will
be as the white curve.
MODE: Room Modes (Is the first priority for Room
Analyzer)
EQ: A peak/dip that needs treatment.
Modes/EQ
MODE: Is a Room Mode that Room Analyzer
has found. This is the first priority for the
program. If there are less than 5 found modes,
Room Analyzer will analyze the possibility to
use EQ to fix the curve.
EQ: A peak/dip that needs treatment.
(In second priority for Room Analyzer)
RTA
The RTA shows the frequency response in
Real time.
The RTA shows the energy with 1/3 octave
resolutions, not as high a resolution as ‘Room
Analyzer’ but a good indication how the
average sound is.
Full Range
Full Range is the most advanced tab in Room
Analyzer. Here is a high resolution full range
measurement. There are options about how
much room information that should be part of
the measurement. The different information
can be shown with 3 curves at the same time.
RT60 is a reverberation measurement.
We are doing it according to ISO 3382
Displayed with standing bars.
We also have a water fall diagram, in both 2D
& 3D. A lot of information can be found in this
diagram.
EQ/PEQ
Equalizer is a tool for raising or lowering
levels on different frequencies. A graphic
equalizer has pre defined bands (Frequency
area). A parametric equalizer can be adjusted
on a specific frequency, Q-value etc.
35 of 37
With the highest resolution it is
impossible to get an absolutely flat
frequency response. Therefore you
can adjust the resolution in different
smoothing steps. This represents
more than the ears resolution. The
hearing resolution is personal.
Smoothing
Smoothing determines the resolution of the
curves.
This is a balance depending on equipment as
well as your individual choice.
With the highest resolution it is impossible to
achieve a completely flat frequency response.
With smoothing the resolution can be lowered
in steps, so it is more equal with the resolution
of the ear, in the low area.
With a good listening room, a competent
system and good experience of sound, the
highest resolution can be used.
For people with less experience, the
recommendation is to use a lower resolution.
Connect Room
Analyzer to your
HIFI system
If Room Analyzer is to be connected to the
system (Front speakers + Sub) a Y-cable is
need.
Connect the y-cable to a free line/input
(AUX/TV) on your system.
36 of 37
Technical specifications
Microphone
USB-microphone - adjusted to flat frequency
response (16Hz-20kHz)
Bandwidth
20-20000 Hz - RTA
16-250 Hz - Room Analyzer
20-20000 Hz - Full Range
Filter
Parametric EQ with variable Q
Measurement
method
Chirp (log sine sweep) and FFT
Service & support
Service & Guarantee
If you need service contact your local dealer.
You are always welcome to contact us if you
have problems with product by e-mail:
[email protected]
Webpage: www.xtz.se
Support
ALWAYS pack the product/part very
carefully. Unfortunately damages
during transportation are very
common. If the packaging is
insufficient, the transporting
company does not compensate for
damages.
Always enclose a copy of the receipt
and a description of the defect.
Please contact our “free-of-charge” support if
you need installation advice, or if any
problems occur during the installation.
Measurements and curves can be hard to
interpret. Send us a mail and we will help you
to analyse the result.
Contact us by e-mail [email protected] and
include your phone number if you require
help, and we will ring you back.
There is a Macromedia Flash instruction on
the website.
37 of 37
http://www.xtz.se/