1
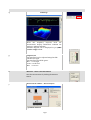
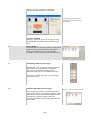
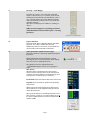
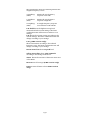
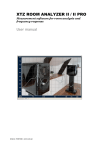
XTZ ROOM ANALYZER II / II PRO
Measurement software for room analysis and
frequency response
User manual
©2011 XTZ AB , www.xtz.se
Summary
Summary ................................................................................................................................................................... 2
Introduction .............................................................................................................................................................. 3
About XTZ ................................................................................................................................................................. 4
Technical overview ................................................................................................................................................... 5
Unpacking ................................................................................................................................................................. 7
Basics of sound - installation and placement tips .................................................................................................. 8
Software installation and connection .................................................................................................................... 10
Function reference ..................................................................................................................................................12
Area of use ...............................................................................................................................................................19
Measuring ............................................................................................................................................................... 20
Frequency response measurement - RTA ............................................................................................................. 23
High resolution room analysis - Room Analyzer .................................................................................................. 25
Measurement results, Frequency response ....................................................................................................... 27
(PRO version only) ............................................................................................................................................. 29
Measurement result, Spectrogram .................................................................................................................... 29
Measurement results, Found Room Modes ...................................................................................................... 30
Advanced functions in Room Analyzer ................................................................................................................. 32
Frequency measurement Full Range..................................................................................................................... 33
RT60 Decay time .................................................................................................................................................... 37
Technical terms and concepts explanations ......................................................................................................... 37
Technical specifications ..........................................................................................................................................41
Service & support ....................................................................................................................................................41
2/41
Introduction
Introduction
Congratulations on your purchase of the XTZ
Room Analyzer
The XTZ Room Analyzer offers many possibilities
in guiding you to calibrate and analyze your hifi or
home theater system.
Please read the manual carefully before using the
Room Analyzer to get the best benefits from this
product.
It takes patience to get a hifi system or home
theater system carefully optimized. This manual
provides the basic tools to measure and analyze
your systems performance.
Please feel free to contact our “free of charge”
support if you lack experience of acoustical
measurements or have any questions. (see
Support info on the last page of the user manual
for contact details)
WARNING!
The microphone supplied with this product
is designed solely for use together with the
supplied sound card (referred to as
connection box in this manual. Use of the
microphone
along
with
third
party
equipment is not supported and may lead to
malfunction or damage of your equipment.
Be careful with high sound levels. Always
begin your measurements with your volume
settings low and increase them as you
proceed with your measurements to protect
your equipment and hearing.
3/41
About XTZ
Philosophy
Our reference and starting point is to reproduce a
natural sound, but we still pay attention to the fact
that sound is a personal matter of taste.
With the Room Analyzer we can help you reach this
goal.
XTZ Goals
To offer the best price/performance/quality ratio
on the market
Our concept:
- Produce the perfect compromise
- Cost effective large scale manufacturing
- Prioritize product quality before marketing, to
achieve the best possible performance/price ratio
- Reduce the number of middle men
Contact
Website: www.xtz.se
Email: [email protected]
4/41
Technical overview
Why a complete
measurement system
for the end
consumer?
The fact that the room adds coloration to the sound
is well known, but it is not often brought to the
forefront because it is hard to handle with
conventional products.
Every room has unknown and unique acoustic
characteristics that affect the sound quality. The
biggest problems are in the low-frequency spectrum.
A normal (not acoustically treated) room has several
resonances and dips in that spectrum caused by
standing waves or ‘room modes’. Depending on the
listening position these produce incorrectly balanced
sound.
Frequency response of normal
speakers
The frequency response of a good loudspeaker
should be in the range of ± 3dB, but a normal room
can introduce variations of ± 15dB. This leads us to
the conclusion that even a very good loudspeaker can
sound poor in a "bad" room. Most regular rooms
suffer from severe acoustic problems.
Why room acoustic
analysis software?
Room Analyzer gives an advanced analysis, as the
name indicates, of the problems that exist in the
room/system. Whatever your system costs you will
always have a use for this instrument in optimizing
your system.
If you spend a great deal of money on your system, it
is our experience that it is a “must” to optimize the
room or “remove” the problem with DSP technology
. Room Analyzer is perfect for this kind of work,.
An analogy with cooking might help here…using a
timer and thermometer helps you to obtain the same
perfect results every time. Room Analyzer gives a
picture of which frequencies in the bass region cause
the problems and provides a way to correct them.
Room Analyzer can measure the frequency response
of any speaker.
Room Analyzer provides more analysis:
• Frequency response with RTA (Real Time
Analyzer)
• Frequency response with Room Analyzer
a. Find room modes
b. Reverberation Time diagram
(Time/Frequency/Level)
c. Simulates the use of PEQ (Parametric
Equalizer)
The analysis render following areas of use:
• Give exact values for compensation for the room
modes, to a subwoofer with PEQ.
• While adjusting placements of
speakers/subwoofers
• While optimizing the room with absorbents,
diffusers, sound traps and more
5/41
Frequency response of normal
room
• Measuring speakers/subwoofers
Minimum system:
P3 - 1 GHz.
System demands are Win98se or later, because of the 1024x768 resolution, 256
colours.
support for USB.
Windows XP (512MB ram)
Windows 98/Me/2K (256MB
ram)
Computer
requirements
The system is based on PC technology.
Microphone
The microphone is manufactured to match our
requirements and the software has built in
corrections for the deviations in frequency response.
Software
The software is specially designed for XTZ by a well
established audio software company.
The software can be downloaded from our website.
Size ~ 1 Mb
6/41
http://www.xtz.se
Unpacking
Unpacking
Check that the items below are included in the
package:
Included items
Room Analyzer II
1 Goose neck microphone
1 Connection base
1 XLR to RCA audio cable
1 Y-split cable
Room Analyzer II PRO
1 Microphone
1 Microphone stand
1 Connection aluminium box
1 XLR to XLR audio cable
1 XLR to RCA audio cable
1 Y-split cable
7/41
Basics of sound - installation and placement tips
This chapter contains general information about
loudspeaker placement and installation.
These are general rules, so there may be exceptions.
In which room do
you achieve the best
sound?
Regardless how good the equipment is, in the wrong
listening environment it will inevitably sound poor.
There are some basic rules concerning proper
loudspeaker installation:
Reflection/
absorbtion
Carpets, curtains and soft furniture absorb midrange
and high frequency sounds, and this is preferable.
Big empty areas, on the contrary, produce hard
reflections that may lead to a blurry dialogue. Apart
from coloring the sound, the perspective of the sound
will also deteriorate. Reflections from the room can
roughly be compared to the reflections that cause
ghost pictures on a TV screen.
Amplification of bass When a loudspeaker is placed near a wall, ceiling or
frequencies
floor lower frequencies will be amplified in a
sometimes not desirable way (since it may lead to
indistinct sound reproduction). This amplification
becomes even more obvious if the loudspeaker is
placed near a corner. Thus, for a sound as clear as
possible, the loudspeaker should be placed at least 30
cm (about 12 inch) away from the wall.
Furniture
Be aware that furniture may vibrate, creating
disturbing sounds and rattles at loud levels.
Room dimensions
Quadratic rooms or rooms where the length is exactly
twice as long as the width should be avoided, since
they may create unwanted resonances.
Speaker placement
The way the loudspeakers are placed towards the
listener is of great importance.
Front speakers
In order to get the best results the front speakers
should be placed symmetrically in front of the
listener. The distance between the front speakers
should be about 80% of the distance to the listener.
In other words, the recommended angle between the
front speakers should be 45 degrees.
Angling?
You can place the loudspeakers angled in towards the
listener or straight ahead.
By angling the loudspeakers inwards, you decrease
unwanted reflections, enhancing the stereo
perspective.
8/41
Correct height
If the loudspeakers are small, they should be placed
on stands or tilted so that they are on the same level
as the ears.
Some speakers have other recommendations from
the manufacturer – in that case follow those.
Cables
Try to keep cables as short as possible. By its
electrical properties, a long conductor will have more
influence on the sound than a short one. It may also
work as an antenna, receiving various signals that
may become a constant noise in an active subwoofer.
Make sure that all connections are clean and not
oxidized. All connections should be mechanically
stable, both power, signal and loudspeaker cables.
Signal cables should be separated from other cables.
Background noise
Important!
External noise from trucks, train, traffic etc can
easily disturb the measurement process.
If the measurement result looks strange in any way
you should do the same procedure again once or
maybe twice. If you get the same result again you can
be sure that it is correct.
Finally
Please remember that “good” sound is a matter of
taste, so you have to experiment to obtain your
personal goal. We wish you best of luck!
9/41
Software installation and connection
Software installation
Connection
Download the software from our website and install it
according to the instructions.
Download the software from
http://www.xtz.se/uk/support/
file-archive
Room Analyzer II
• Connect the USB-chord to your computer
USB-port.
• Connect the Room Analyzer II microphone to
the XLR connector on top of the sound card.
• Connect the RCA-cable to a line input on your
receiver/subwoover.
• Start your computer and launch the Room
Analyzer software
To avoid equipment damage
the amplifier / subwoofer
should be turned off during
connection!
Y-splitter to distribute signal to
both channels.
ROOM ANALYZER II KOPPLINGSDIAGRAM
Ansluta Room Analyzer II PRO
• Connect the USB-chord to your computer
Example of how the amplifier
USB-port.
inputs might look. Select a free
• Connect the Room Analyzer II PRO one, for example DVD/LD
microphone to the XLR connector labeled MIC
the sound card.
• Connect the supplied XLR-RCA-cable from
AUDIO OUTPUT to a line input on your
receiver/subwoofer.
• Start your computer and launch the Room
Analyzer software.
ROOM ANALYZER II PRO KOPPLINGSDIAGRAM
10/41
If the Room Analyzer is to be connected to stereo
system then you should use the - splitter to feed a
signal to both channels. This should be connected to
any input that is free to use such as a AUX/TV input.
When making final adjustments, make sure signal is
applied to all speakers and subwoofers in the system
you wish to calibrate. Making separate adjustments to
each channel will not accomplish a well-balanced end
result.
Placing the
microphone
High resolution room analysis - Room
Analyzer
While doing room analysis the microphone should be
placed in about listening position at ear height (70 cm
– 110 cm from the floor).
Frequency response measurement - RTA/Full
Range
While doing full range measurements the microphone
should be pointed towards the speaker, preferably at
the same height as the tweeter (the microphone is
directionally sensitive above 5 kHz).
11/41
Function reference
Working area
In the following section the functions marked on the screen shot below are explained. Every function is
represented by a number in the picture below and is explained thoroughly on the following pages.
Some functions are restricted to the PRO version of the XTZ Room Analyzer II software. Functions that have
been reserved for the PRO version are hereafter labeled PRO version only.
12/41
1
Room Analyzer
Shows the frequency response (Blue curve), room
modes (Green curve) and calculated result curve
(White curve)
You can switch the main window
display between frequency response
and spectrogram by double clicking
on the main window.
Select the curve to be displayed by
checking or unchecking the relevant
boxes.
2
RTA (Real Time Analyzer)
Measures frequency response (in real time) with a
resolution of 1/3 octave.
3
Spectrogram (PRO version only)
Presents an analysis of the decay time in the room.
The time spectrum analysis shows a color spectrum
of frequency, level and time.
13/41
4
Full Range
Shows the frequency response from the
measurement. Display alternatives available are
Anechoic, Ambient and Raw.
Waterfall diagram can be displayed in 3D (PRO
version only) and 2D.
5
Output level
The signal level can be adjusted using the slide
control to the right.
The signal level should be green:
Red = Too High
Green = Good level
Blue = Too Low
6
Measure - Start a measurement
Start the measurement by clicking the Measure
button.
7
Measurement window – Room Analyzer
1-position method.
14/41
With the ”Average 3 positions” unchecked
a one position measurement is performed.
The picture shows all the positions
displayed after one another during a
measurement.
3 positon method
”Average 3 positions” gives you an average result
calculated and measured at three positions in the
room.
8
Room Modes
In this window all found room modes are displayed
together with the recommended compensation
parameters calculated for use with XTZ DSP
products or similar products using Parametric EQ.
9
Smoothing (PRO version only)
Smoothing is a way of evening out the result chart.
This can be done using different resolutions.
This is an act of balance depending on the
equipment used, but also your individual choice.
Resolutions available are 2 ppo, 3 ppo and 6 ppo
(points per octave).
10
Stimulus EQ (PRO version only)
Room Analyzer provides you with recommended
parameters for use in a Parametric Equalizer. These
values can be moved to the Stimulus EQwindow by
pressing the Copy Room Modes, and a new
measurement will be completed that emulates the
use of a PEQ.
15/41
Stimilus EQ - Only visible in Advanced Mode
11
Overlay – Full Range
Provides an option to save and view measured
charts on the screen. Up to 4 charts can be stored
and displayed simultaneously individually. This is
very powerful when comparing different settings
and systematically working ones way towards the
optimum settings.
The charts are displayed or hidden by clicking on
”Show”.
(PRO version supports 4 overlay positions
while Standard version allows for 1 overlay
position)
Only shown in ”advanced mode”
12
Export buttons
Export ROOM, RTA or ROOM+RTA to XTZ DSP
products. (In order to utilize this function
additional software is necessary to download the
exported file to the XTZ DSP equipment.)
13
Tone generator (PRO version only)
The tone generator is started by pushing the green
fg-button.
Right-clicking the fg-button displays a menu
allowing the user to choose between 10Hz-20kHz
sine wave tones or white/pink noise.
14
The signal level can be adjusted between
-100-0dBFS using the arrows or by typing in a
value.
SPL meter
The SPL-meter (Sound Pressure Level meter)
shows present sound pressure at the microphone
position. The meter displays five different top and
average levels as follows (top to bottom):
LCpk hold shows the highest SPL since start/reset
LCpeak shows continuous peak levels including
short bursts.
Which values currently displayed on the bottom
three indicators can be adjusted using the menus
under the meter bar.
The top menu allows for switching between Fast or
Slow average. (125ms or 1s). This is shown as an F
for Fast or and S for Slow on the level indicators
(LAF or LAS).
16/41
The second menu allows for switching between the
weighted frequency curves:
A-weighting:
(LAF)
Mimics the ears frequency
response at low SPL.
C-weighting:
(LCF)
Mimics the ears frequency
response at high SPL.
Z-weighting:
(LZF)
A straight frequency response
curve between 10Hz-20kHz
LAF hold Shows the highest average level
measured with the current settings. The letter
combination LAF will change according to your
settings.
LAF Shows the current average according to the
current settings. The letter combination LAF will
change according to your settings.
LAeq (PRO version only)
Shows current SPL according to the selected
frequency curve. The letter combination LAF will
change according to your settings.
Green meter line shows LCpeak level
Yellow meter line shows LAF/LASpeak
according to the settings made above.
Timer Shows the run time of the meter since start
or last Reset.
Reset Resets all averages (PRO version only)
Pause Freezes all meter values (PRO version
only)
17/41
Menus
File
New
Open
Save
Save as…
Import curve
Export curve
Export Screen Dump
Print
View
Toolbar
Statusbar
Color Theme
Setup
Advanced mode
Help
About XTZ…
This section contains information regarding the
menus and their options
Load previously saved measurements
Save measurements
Import measurement values from a txt-file
Export measurement values to a txt file
Export measurement in picture format (.bmp)
Print Room Analyzer measurement and Time
spectrum analysis
Shortcuts to Save, Print and quick buttons for
exporting files to DSP-programming
Display the pointer position in Frequency and
Magnitude (level)
Dark/Bright – Change the color theme of the
program
More options/settings for some functions
• Stimulus EQ
• Smoothing possibility
• Load/Save (curves)
• Change of scale (RTA window )
•
Export Room Analyzer & RTA
Software version
18/41
Black/White
Choose between a dark or bright theme
Area of use
Before you start
Make sure the software is installed and the equipment is See Installation and
Connection.
connected.
Before the measuring procedure starts, make sure the
microphone is placed in ear height when adjusting the
output level.
Starting Room
Analyzer
Start ‘Room Analyzer’
For advanced users, there is a choice called ‘Advanced
Mode’ which has more settings and features.
Setting output level
In order to achieve a reliable measuring procedure it is
important that the correct output level is set.
Put the control on the output level in the middle.
Now there should be a white noise in the speakers.
The level meter to the right should be up to the green
“G”. If the level is too high or low, adjust it with the
volume control on the system/subwoofer. Small
adjustments in output level can be made with the
control bar.
Click on ‘STOP’ to turn off the white noise.
REMEMBER!!
HIGH SPL level can
damage your ears.
19/41
Measuring
Suggested approach
to equalization
The recommended approach is in two steps:
Step 1 - Room Analyzer
Room modes are treated by utilizing PEQ (parametric
equalization).
Use Room Analyzer to find the room modes.
If the Room Analyzer suggests the use of PEQ, you need
to include a PEQ in your system to be able to carry out
the correction.
Room Analyzer finds the
largest and most important
room modes (all of them can
never be included as this
would demand an infinite
number of PEQ filters).
Addition only refers to single
position measurement
method.
Tillägget gäller endast 1
positions mätning.
If the result is found to be not
flat enough, use the High
Resolution method several
times and add more PEQ
filters to achieve a better
result.
Step 2 - RTA/Full Range
After adjusting the room modes, continue by adjusting
the frequency response in the listening position using You can use the function
the frequency response measurement in RTA/Full ”Manual adjustment of
curves” on page 29, Advanced
Range with a graphic EQ and/or PEQ
functions.
Measurement
methods
There are different ways to measure the frequency
response. To select the method, click on the tabs at the
lower bar in the program. See the picture to the right.
1.
Frequency response measurement - RTA
Measurement range is 16-20 000Hz.
A simpler way showing the response
throughout the entire audible range. The
resolution in this option is 1/3 octave.
2. High resolution room analysis - Room
Analyzer
Measurement range is 16-250Hz.
In Room Analyzer Pro there are two ways for
the high resolution method: 1- or 3-position
measurement.
1-position measurement
For optimizing the sound without compromise
a “1 position measurement” should be used.
Examples of when to use this mode include a
stereo or home theater with only one seat that
you care about.
The “risk” with “1 position measurement” is that
the sweet spot could be in a room mode or
boundary intereference related dip. Sometimes
One position measurement
it is impossible to compensate for these dips
without causing other problems. One solution is
to move the listening or speaker/subwoofer
position.
20/41
1 position measurement can be used with the
following measurements:
• Room Analysis
• Frequency response
• Speaker frequency response
• Reverberation analysis
3 position measurement
Normally, the recommendation is “3 position
measurement”. The measurement is made in 3
positions in the room, producing a more
accurate measurement that helps find room
modes easier.
3 positions measuring can be used for:
• Room Analysis
• Reverberation analysis
3.
Frequency response
FULL RANGE
measurement
The three positions suggested
to perform a measurement
-
A full range measurement is done using a sine
sweep between 20-20 000Hz instead of the
RTA method’s pink noise.
There are options to choose between three time
windows:
Anechoic, Ambient and Raw
By clicking the RT60 button the decay time for
several frequencies will be displayed at the
same time. RT60 is shown according to the
ISO3382-standard.
4. (PRO version only)
Tone Generator
The tone generator can be used in conjunction
with the SPL meter or RTA analyzer to test
system function and performance at specific
frequencies or over the entire audible spectrum.
The following test signals are available:
Pink Noise
White Noise
Sine wave with frequencies: 10, 12.5, 16, 20, 25,
31.5, 40, 50, 63, 80, 100, 125, 160, 200, 250,
315, 400, 500, 630, 800, 1k, 1.25k, 1.6k, 2k,
2.5k, 3.15k, 4k, 5k, 6.3k, 8k, 10k, 12.5k, 16k and
20kHz
21/41
RT60 shows the amount of
time for the sound pressure
level to decay 60dB This is a
standard method to evaluate
the decay time of a room.
5. (PRO version only)
Measuring sound levels using the SPL
meter and Tone Generator
Your system levels can be calibrated using the
SPL meter and tone generator. These tools are
also useful for monitoring sound pressure levels
produced by your system.
To make a measurement which as closely as
possible resembles how the sound pressure is
perceived by the ear. Choose Fast in the top
menu and A-weighting for low SPL levels or
C-weighting high SPL levels.
Set the volume of the function generator below
-40dBFS to protect your equipment.
Choose signal type by right clicking the fgbutting.
Start the signal by clicking the green fg-button.
22/41
Frequency response measurement - RTA
RTA
(Real Time Analyzer)
RTA
is a
full
range
measurement. Above 5 kHz
the microphone is direction
sensitive and should be
pointed towards the sound
source.
Click on the RTA tab. Click “Measure” to start the
measurement and stop it by clicking ”Paused”.
Each bar displays the sound pressure level (SPL) for
fixed frequency bands.Below
bands.B
the bar diagram you can
see the SPL at each frequency as a number.
The RTA shows the frequency response in real time. It
measures the energy level at different frequencies in the
room. It is therefore
there
common for the curve to differ
from the sweep measurement.
RTA shows the measured energy with 1/3 octave
resolution and as a continuous moving average (average
in a short time frame).
It doesn´t have the same high resolution as Room
Analyzer or the Full Range measurement, but still gives
a good picture of how the sound will be experienced.
Click ”Listen” to activate the listening mode. This mode
is suitable when you want to monitor the sound changes
in the room in real time, but less suitable for
adjustments.
justments.
The scale can be altered using the ”Scale”-settings.
”Scale”
The Y
axis top value and range can be adjusted.
Frequency response measurement – RTA is
perfect for checking the frequency response when
placing speakers/subwoofer, finding
find
a good listening
position, or adjusting a graphical equalizer.
Export
Exporting to XTZ DSP-products
DSP
can be done via the
menu or using the quick buttons shown on the diagram
to the right.
right ”Both” means that the automatically
generated parameter values are exported together with
the RTA values.
23/41
The options for adjusting the
Y-axis scale.
NOTE!
For a complete room analysis you should use the Room
Analyzer first, then perform a RTA measurement.
24/41
High resolution room analysis - Room Analyzer
Start measurement
Click ”Measure” to start the measurement procedure.
1-position measurement
Uncheck ”Average 3 positions”
Read about the
differencies between
single position
measurement and three
position measurements in
the chapter ”Technical
explanations”.
•
•
Click ”Measure” to start the measurement.
The measurement window is closed after a short
while and the results are displayed.
3-position measurement
When doing a 3-position measurement the box
”Average 3 positions” should be checked. In order to
achieve an accurate result the measurements should be
done in positions that are not too close to each other:
•
Place the microphone as shown
(To the left in the room, some distance from the
wall)
•
Click ”Measure” to start the first measurement.
A sine sweep is heard from the speakers during each
measurement.
•
Move the microphone to your listening position.
25/41
You can use both
methods without
problems and compare
the results to decide
which one you prefer.
•
Click ”Measure” to start the second
measurement.
•
Move the microphone to the right in the room,
this time closer to the speakers.
•
Click ”Measure” to start the third measurement.
The measurements are now finished and the window
will be closed when the calculations are done.
26/41
Measurement
results,
Frequency response
After a short while the) the ”Room Mode Measurement”
window will be closed and the results from your
measurements will be presented.
In the main window, the frequency response is now
shown. The reverberation time is shown in the smaller
window to the right.
If you double click in the main window the data
displayed in each window change.
There are three different curves.
Choose by clicking on the right side (see picture):
•
•
•
Measured - Blue curve
Modes+EQ - Green curve
Result - White curve
The standard curve, the blue, is the measured frequency
response.
The green curve shows the frequency response for room
modes and EQ adjustments recommended in Found
Room Modes. The values in “Found room modes” are
those that are shown in the green curve.
27/41
Double click on the large
window area to swap the
main dispay between
frequency response and
spectrogram.
The last graph is a calculated curve, it displays the
expected result from using a PEQ with the suggested
parameter values. Correction is done according to the
values shown in ”Found Room Modes”.
In Advanced Mode you can adjust the graph´s
resolution with three different smoothing amounts - 2,
3 or 6 ppo (points per octave) can be selected.
28/41
In the smaller window to the right, a spectrogram is
shown – a 2D waterfall diagram. This picture shows a
Measurement result, color spectrum with frequency, amplitude and time
data. This is a powerful tool to measure, analyze and
Spectrogram
(when necessary) treat your room in terms of
reverberation time in the bass region. This can be done
using DSP, Parametric Equalizer of other types of
acoustic treatments.
To obtain a better overview you can shift places between
the two windows by double clicking on the large
window.
(PRO version only)
Reading the graph
Data is put together and displayed in the graph:
Color scale
Vertical axis
Horizontal axis
- Amplitude
- Frequency
- Time
The idea of the spectogram is to show the decay time as
a function of time and frequency. An uneven color
spectrum suggests an uneven frequency response in the
room. High amplitudes (warm colors) reaching far into
the right of the chart shows that there are problems with
long decay times.
In the same way that Room Analyzer can show different
graphs for Result, Modes + EQ and Measured can these
be displayed in the spectrogram window.
Below you can see two examples where the left room has
big problems with room modes and very long decay
time, while the other room can be considered very well
treated with an even frequency response.
A poor room with long decay times and heavy room
modes.
A good room with short decay time and even
frequency response.
29/41
Measurement
results,
Found Room Modes
Found room modes that need compensating are shown
here.
Mode: A room resonance (these are the first priority to
deal with)
EQ: A ”bump” (peak in a limited frequency area) in
frequency response where it is recommended that EQ be
used.
Values presented in ”Found Room Modes” can be used
directly in a subwoofer with PEQ (Parametric
Equalizer).
Export to XTZ DSPProducts
Values presented in ”Found Room Modes” can be
exported to a file for import to the software included
with XTZ DSP products (XTZ PC-remote).
Click Setup > Export to export the suggested parameter
values. You can also export by clicking in the quick
button ”ROOM”.
Stimulus EQ
(PRO version only)
The Room Analyzer presents values (based on the
measurements) for use in a PEQ. These values can be
copied to the Stimulus EQ window by clicking on ‘Copy
Room Modes’. The Stimulus EQ ‘simulates’ a PEQ
inserted in the signal chain with the values setup as in
the table - this is a fast and efficient way of trying out the
best PEQ values to optimize your system!
.
To simulate a PEQ in your system:
• Perform a measurement with Room Analyzer
• Save your data with the Overlay-function
• Click ”Copy Room Modes” to copy the values to
”Stimulus EQ”.
• Repeat the measurement procedure using the
now adjusted signal.
• Save your new measurement with the Overlayfunction and compare by clicking the
corresponding Show-buttons in the Overlaypanel.
Values in the ”Stimulus EQ” table can be deleted by
clicking ”Clear Stimulus EQ”.
30/41
Final adjustments
You can finally tune the frequency response using a
graphic EQ. Through a frequency response
measurement using RTA or Full Range-tools you can
analyze the entire audio range and determine if any
further high precision adjustments are necessary.
The room compensation is now finished!
If the measurements were done with only a subwoofer
connected, the results will differ when the complete
system (front-/center-/surround speakers) is connected.
It is wise to perform an additional frequency response
measurement with all speakers in operation.
If the final result is not adequate it might be because of
measurement
interference.
Try
re-doing
the
measurements at a slightly higher sound pressure level.
(Please see page 18 for additional information about
frequency response measurements with RTA and page
30 for Rull Range)
31/41
Advanced functions in
i Room Analyzer
Manual adjustment
of curves
(Drag & Dropadjustment)
The following functions are only shown in ”Advanced
mode”
In ”Advanced mode” there are additional tools
available offering further adjustment options for the
advanced user.
By clicking the right mouse button you can ”grab” a peak
or a dip, then move the marker to correct the curve
manually. By moving the marker sideways the frequency
PEQ-suggestions cannot be
is altered.
imported to XTZ DSP
products as the new values
overwrite the previous ones.
They have to be added
manually.
Release the mouse button and new PEQ-values are
suggested. The new PEQ suggestion can be edited if a
more accurate setting is wanted. This is done by double
clicking the value and editing the Frequency, Q and
Gain. Another method is to right click on the value and
select ”Properties”.
Additional suggestions demand
dem
more PEQ channels.
NOTE! Use curve editing with caution.
Remember that your amplifier might be subject
to a harder load if the curve is edited to increase
the level at some frequency. Begin with small
changes and lower parts of the curve rather than
elevating
levating them!
them
(PRO version only)
Adjusting the
measurement time
axis
Important
Important!
The frequency response in Room Analyzer is measured
at ”time zero”, marked in the spectrogram with a yellow
line. The yellow time line can be moved sideways by
clicking and dragging the line with the left mouse button.
The frequency response at the time where
wh
the line is (0250 ms) is shown in red.
This explains why the frequency response might look
uneven at time zero in spite of PEQ or GEQ correction.
The other way around, a dead flat frequency response at
time zero may not be at all optimal as interference
interfer
may
occur later in time affecting the listening impression. For
this reason, the decay time is of great importance. The
experienced frequency response is the sum of the energy
over time, something the RTA can display.
32/41
Frequency measurement Full Range
Full Range
The Full Range-tab displays the tools to make full
range frequency response measurement. When
measurements in the room have been made you can
select a variety of presentation options to enable you to
analyze the information in the best possible way.
Below is an example of a frequency response and
waterfall diagram in 3D (3D view available in PRO
version only) displaying data in the time domain (0200 ms).
Full Range measurements can also be used to measure
the room itself. It offers higher resolution than RTA, but
not the same resolution as the Room Analyzer in the
bass area.
Working areas
The Full Range screen has a divided working area.
You can adjust the size of the two parts by clicking on
the grey space between them and dragging up or down.
33/41
View
(PRO version only)
There are three different curves that can be displayed in
the measurement window, to show different kinds of
information. The window type used is the Half Extended
Cos Bell with 20% taper.
Anechoic – No room interference
(300/4 ms, Multi-Win)
Shows the
interference.
frequency
response
without
room
Ambient – Room information
(300/8 ms, Ambi-Win)
Shows reflections from the room and room modes
Raw - Untreated
(300 ms, Full FFT)
All the information is displayed untreated. This method
offers the highest resolution, but demands that the
results can be properly evaluated in return.
Waterfall diagram (CSD)
(300ms /slice, total length of 200ms, sliding CSD)
2D- or 3D-view can be selected where the 3D version
can be viewed from three different angles. In 3D-view
the x-axis shows frequency, the y-axis shows the
magnitude and the z-axis shows time.
In 2D-view the same information is displayed, but the Yaxis has been flattened out and shown only as a change
in color.
34/41
Overlays
Only shown in ”Advanced
mode”
Room Analyzer offers the possibility to save up to 4
curves (PRO version) or 1 curve (Standard version) on
the screen. This is done by clicking on 1,2,3 or 4 in the
Overlay area.
It is always the last measurement that is saved.
To store a new curve simply do a new measurement and
click the Overlay button you want to replace.
To hide or show a curve, use the ”Show”-button.
The picture shows that curve
1 and 3 are active
Volume setting
The volume of the signal sent to your system can be
adjusted with the ”Output Level” slide bar.
A higher volume achieves better accuracy. Remember
not to exceed your systems limits.
Start Full Frequency
measurement
The measurement is started by clicking the ”Measure”
button. Four sine sweeps follow and the measurement is
done.
This gives you a variety of information. First, the
frequency response, with different window settings, a
waterfall chart showing the measurement in respect to
time and finally RT60 values. These are displayed as
bars where the decay time values are visible above each
bar. This is done according to ISO 3382 standard.
Evaluating the results perfectly takes experience and
35/41
knowledge, but most of it can be interpreted relatively
easy.
Measurements performed at longer distance often
present dips in the bass region. The cause is heavy room
influence, microphone- and speaker placement.
To see how a bass speaker or subwoofer really performs
you need to do a near field measurement to avoid the
room to influence the results.
Delay Alignment
The Alignment function in the Full Range view is a tool
to adjust the time delay between your systems
channels/subwoofer. Better phase accuracy at the
listening position is accomplished by delaying individual
channels separately.
How to perform a time delay measurement between
your speakers and subwoofer:
1. Place the microphone at the listening position.
The microphone position must remain
unchanged for all measurements.
2. Make a measurement applying signal only
through one of front or surround speakers.
3. Press Overlay button 1.
4. Make a measurement applying signal only
through your subwoofer.
5. Press “Align Delay”. Controls for aligning the
delay manually are now displayed if you wish to
do so.
6. Press “Auto Align”. The time with which your
signal needs to be delayed is now shown in the
time window to the right of the controls.
If your system doesn’t allow for signal delay you may
reposition your subwoofer by the distance suggested in
brackets in the time delay window.
36/41
RT60 Decay time
Decay time or reverberation
One of the room´s most important parameters is the
decay time – T.
RT60 shows how long it takes for the reflected sound to
fall 60 dB below the direct (non-reflected) sounds
original level, and is a standard way of measuring the
rooms decay time. (measured with 1 octave resolution).
In order to achieve an accurate RT60 measurement the
sound level output must loud enough for the program to
discern the signal from the natural noise floor, which
can be around 40-50 dB in a regular room. Ideally
measurements should be made at a sound pressure level
of at least 90dB.
To calculate RT60 the signal level change of 60 dB is
divided by the time it takes for the level to drop.
Measurement window
The decay time is presented in octaves between 125 Hz
and 4000 Hz. At frequencies below 125 Hz the results
are inaccurate, and above 4000 Hz air absorption
becomes the key limit.
37/41
Technical terms and concepts explanations
Room modes
Room modes occur as the result of reflected
sound in the room. Direct sound and reflected
sound form a pattern and where the waves
end up in phase the room modes are found.
Phase cancellation/
Peaks/Dips
If a direct sound wave is in phase are in antiphase they cancel out and you get a room
node, which in many cases can be better than
a room mode.
If several waves are in phase or anti-phase,
peaks or dips form.
If extreme dips are found during a
measurement, these can be impossible to
compensate for and a change of listening
position or speaker placement should be
considered.
A node is shown as a dip in the Room
Analyzer measurement.
Mode: Resonance at a certain frequency
Node=dip: Point where amplitude is
close to zero (resonance)
Standing wave: A standing wave occurs
when a wave is reflected against a wall.
Two opposite waves are created whose
sum does not transfer any energy. In the
case of a single wall no room mode exist,
but there could still be standing waves..
peak/anti-node
dip/node
1-position
measurement
3-positionsmätning
(Average 3 positions)
Decay time
If you want to optimize the sound without
compromise the single position method
should be used, which can be suitable if the
Room Analyzer is to be used with a extremely
expensive high performance system in
combination with a very good listening room.
The “risk” with “1 position measurement” is
that the sweet spot could be in a dip.
Sometimes it is impossible to compensate
without having other problems. One solution
is to change sweet spot and/or move the
speakers/subwoofer.
As a last check a single position measurement
can be done.
Normally, the recommendation is “3 position
measurement”. The measurement is made in
3 positions in the room, producing a more
accurate measure, and to find the room modes
easier, and more accurate countermeasures
can be suggested.
Treatment of the main room modes usually
obtains a better listening experience in the
entire room.
This demands equipment with PEQ
(Parametric Equalizer), such as XTZ DSP
products.
Use both measurement methods and compare
the results to determine what method you
want to use.
Shows how long time it takes for the sound
pressure has decreased to a certain level.
38/41
All rooms have a decay time, but a very long
decay time affects the sonic performance in a
negative way. A hard hand clap can give a
rough indication of the decay time.
A short decay time is preferable, and can be
achieved by adding more absorbing materials
in the room, such as furniture, carpets,
cupboards and curtains. There are specialized
companies that are able to assist with these
kinds of room acoustic treatments, but you
can get far just by some well though through
furniture.
Even in a room with a fairly flat frequency
response the decay time may be a problem, as
frequency response is commonly measured at
time zero, and no respect is taken to the
reflected sound.
Room Analyzer
Room Analyzer shows the frequency response
(Blue curve) with a high resolution, the true
frequency response or the exact response
down to each frequency. Therefore, any flaws
in frequency response can be detected.
In Advanced Mode you can adjust the
resolution (smoothing) in several steps.
Room modes are shown in green. These are
caused by the room, and ideally the goal is to
get rid of all room modes. Then you have
removed the largest problems of the room.
The calculated result (White curve) shows the
result using DSP treatment according to the
suggested PEQ parameters.
RTA
The RTA shows the frequency response in real
time.
RTA shows the experienced energy with 1/3 of
an octave resolution as a moving average. In
other words, it doesn´t offer the same high
resolution as the Room Analyzer feature, but
it offers a good indication of how the sound is
experienced when listening to music.
EQ/PEQ
Equalizer – a tool that can elevate or suppress
the level of certain frequencies. A graphical
equalizer has predetermined frequency bands.
A parametrical equalizer can be adjusted to a
specific frequency, Q-factor and amplitude.
39/41
Smoothing determines with which
resolution and precision a graph should
be presented. This is a compromise
depending on
your equipment and
personal preference.
Using the highest resolution it will be
impossible to achieve a completely flat
frequency response. The resolution can
then be lowered using smoothing in
several steps to give a more relevant result
according to how the human ear
experiences sound. How well minute
differencies in sound can be heard
depends on each persons ability, age and
so on.
Full Range
The Full Range-tab is the most advanced
feature in the Room Analyzer. Full frequency
measurement with higher resolution than the
RTA is available as well as tools to how much
of the room effects should be shown in the
results, and finally which of the measurement
charts should be displayed.
RT60 is a decay time measurement done
according to the ISO 3382 standard and tells
how long time it takes for different
frequencies to ”leave the room”. This is
visually presented as red bars with the decay
time on top.
Further, there is a waterfall measurement that
can be displayed in both 2D and 3D. Using
this method tons of information can be
obtained.
Smoothing
Smoothing determines with which resolution
and precision a graph should be presented.
This is a compromise depending on your
equipment and personal preference.
Using the highest resolution it will be
impossible to achieve a completely flat
frequency response. The resolution can then
be lowered using smoothing in several steps to
give a more relevant result according to how
the human ear experiences sound.
If you have a good listening room, a good
system and some experience from sound you
can use the highest resolution.
If you are less experienced or have not as good
equipment we recommend using a lower
resolution.
Connecting the
Room Analyzer to
your system.
If the Room Analyzer is to be connected to a
complete system (front speakers + subwoofer)
you need a Y splitter to feed the signal to both
channels. This is connected to AUX/TV or any
other line input free to use.
40/41
Technical specifications
Microphone
USB-microphone – software compensated for
a flat frequency response between 16Hz20kHz
Bandwidth
20-20 kHz - RTA
16-250 Hz - Room Analyzer
20-20 kHz - Full Range
Filter type
Parametric EQ with variable Q
Measurement
method
Chirp (log sine sweep) and FFT
Service & support
Where to send the
For service we refer to our retailers.
product for warranty
service?
If you have questions about servicing, please
contact our support:
email: [email protected]
website: http://www.xtz.se
Support
Contact our free of charge support line if you
have questions or need advice about installing
a subwoofer, speaker or software, or if you run
into any problems during installation.
Measurement results can be hard to interpret.
Send us your graphs and we will help you
analyze them!
Contact us using email [email protected] and
include your phone number if you wish us to
call you.
41/41
Always pack the product/part very
carefully as transportation damages
are common. If the packaging is
insufficient, the courier will not pay
for the damages.
Always include a copy of you receipt
and a description of the problem.