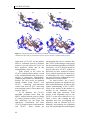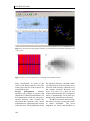
1
Development of high-performance algorithms for a new generation of versatile molecular descriptors. The Pentacle software. Ángel Durán Alcaide DOCTORAL THESIS UPF / 2009 THESIS DIRECTOR: Dr. Manuel Pastor (CEXS Deparment) A el tío Roberto, Lilí y familia iii Agradecementos O meirande agredecemento é para Montse (merecedora tamén da dedicación) pola súa paciencia e por apoiarme, aguantarme e darme folgos ó longo de todos estes anos nos que tiven que loitar contra as adversidades, convertíndose nunha das persoas máis importantes da miña vida. Quero agredecer a toda a miña familia e o meu can Odín a confianza e o apoio prestado durante este tempo, así como o longo da miña vida. Desexo facer especial mención ó tio Roberto, a Lilí e familia para así tentar de agradecer tódolos esforzos que realizaron polos meus pais e que fixo posible que eu sexa quen son e que chegara onde estou. Tamén quero agradecer os meus amigos de Galicia (Víctor, Manolo, Antía, Iria, Kike, Javi, Miguel,…) que a pesares de estar lonxe sempre se mantiveron o meu carón cando necesitei forzas e novos folgos. Quero dar gracias especialmente as persoas de Jorge Naranjo e Oscar González (“..lo estamos dejando…”) pola axuda prestada para que a miña adaptación a nova vida en Barcelona fose moito máis sinxela. Tamén quero agradecer a tódala xente do meu laboratorio polos seus comentarios constructivos ou non (Laura, Jana, Marta, Cristian O., Crintian T., Pau,…) con especial mención para a persoa de Tunde (“Peace…”) polo legado que deixou en todos nos. Dou gracias a tódolos compañeiros e amigos que pertencen ou pertenceron nalgún momento ó GRIB e cos que compartín moitos bos momentos: Ricard (as miñas magdalenas de chocolate!!!!), Ferran, Xavi, Carina, J.Flo, Jan, Ana, Praveena, Fabien, Juan Antonio,…. Tamén quero dalas gracias especialmente a persoa de Alicia de la Vega, pola axuda prestada dende secretaría. Un agradecemento (e unha agarimosa aperta) a María Galvis pola súa confianza e polos esforzos que realiza para axudarme en todo o que pode. Finalmente, merece unha mención especial o “melón” (Eloy), que sempre está ahí (menos cando durme). Tamén quero agradecer a toda a xente da que me poida olvidar (un sábado despois dun venres de festa non é o mellor momento para recordar nomes) que non aparece nestas líneas e que me axudaron e me apoiaron oa longo da miña vida. Por último, pero non menos importante, quero agraceder o meu director de tese Manuel Pastor a oportunidade brindada de facer un doutoramento e pola confianza mostrada en min en todo momento, así como pola súa paciencia durante moitos intres nestes case catro anos de traballlo xuntos. Tamén quero agradecer a Molecular Discovery Ltd. e a Ferran Sanz pola financiación aportada para que eu poidese facer a tese. v Abstract The work of this thesis was focused on the development of highperformance algorithms for a new generation of molecular descriptors, with many advantages with respect to its predecessors, suitable for diverse applications in the field of drug design, as well as its implementation in commercial grade scientific software (Pentacle). As a first step, we developed a new algorithm (AMANDA) for discretizing molecular interaction fields which allows extracting from them the most interesting regions in an efficient way. This algorithm was incorporated into a new generation of alignment-independent molecular descriptors, named GRIND-2. The computing speed and efficiency of the new algorithm allow the application of these descriptors in virtual screening. In addition, we developed a new alignment-independent encoding algorithm (CLACC) producing quantitative structure-activity relationship models which have better predictive ability and are easier to interpret than those obtained with other methods. Resumen El trabajo que se presenta en esta tesis se ha centrado en el desarrollo de algoritmos de altas prestaciones para la obtención de una nueva generación de descriptores moleculares, con numerosas ventajas con respecto a sus predecesores, adecuados para diversas aplicaciones en el área del diseño de fármacos, y en su implementación en un programa científico de calidad comercial (Pentacle). Inicialmente se desarrolló un nuevo algoritmo de discretización de campos de interacción molecular (AMANDA) que permite extraer eficientemente las regiones de máximo interés. Este algoritmo fue incorporado en una nueva generación de descriptores moleculares independientes del alineamiento, denominados GRIND-2. La rapidez y eficiencia del nuevo algoritmo permitieron aplicar estos descriptores en cribados virtuale. Por último, se puso a punto un nuevo algoritmo de codificación independiente de alineamiento (CLACC) que permite obtener modelos cuantitativos de relación estructura-actividad con mejor capacidad predictiva y mucho más fáciles de interpretar que los obtenidos con otros métodos. vii Preface Rational drug discovery is a relatively new discipline. In the last decades, the widespread use of computers propitiated the rise of a new discipline, the computer-assisted drug design (CADD), aiming to develop and apply computational methodologies for the discovery of new drugs. One of the cornerstones of the CADD are the molecular descriptors; methods allowing describing molecules in terms which can be understood and manipulated by computers. Many molecular descriptors, adapted to different purposes, have been published. Among them, those based on the calculation of Molecular Interaction Fields (MIF) proved to be useful in applications like the development of Quantitative Structure-Activity Relationship and other ligand design and optimization techniques. Here we will focus on the GRIND (GRid INdependent Descriptors), a MIFrelated molecular descriptor which does not require the spatial alignment of the compounds, representing an evolution aiming to solve the main drawbacks of the original MIF. The GRIND were first published in 2000, and in the past years several limitations and drawbacks have been recognized and reported. The main aim of this thesis is to develop a new generation of alignmentindependent molecular descriptors, founded in the same principles as GRIND, but able to address their problems and to expand their application to other fields of drug discovery. Here we will report novel algorithms, developed for improving the quality, calculation speed and interpretability of the GRIND, obtaining a new generation of them which we called GRIND-2. All these methods have been implemented in a commercial grade program, Pentacle, which will make our result available for the scientific community. Furthermore, we will report here the results of systematic studies validating the performance and suitability of the new GRIND-2 in new drug discovery fields. ix Table of contents Abstract......................................................................................... Preface........................................................................................... Objectives..................................................................................... List of publications...................................................................... Pag. vii ix xiii xv 1. INTRODUCTION................................................................ 1.1 Drug Discovery..................................................................... History.................................................................................... Drug discovery process.............................................................. Computational methods in drug discovery.................................. 1.2 Molecular Descriptors.......................................................... Introduction............................................................................. Molecular interaction fields....................................................... GRID independent descriptors................................................. 1.3 3D-Quantitative Structure-Activity Relationship............. Introduction............................................................................. Principal components analysis................................................... Partial least squares................................................................. 1.4 Ligand-Based Virtual Screening.......................................... Introduction............................................................................. Molecular similarity................................................................. Template selection..................................................................... Database creation..................................................................... Assesing the performance.......................................................... 3D virtual screening: the bioactive conformation problem........... 1.5 Software Development......................................................... Introduction............................................................................. User interface........................................................................... Programming languages............................................................ 1 3 3 4 6 9 9 10 13 18 18 20 22 26 26 27 28 28 29 30 31 31 34 35 2. RESULTS AND DISCUSSION.......................................... 39 3. PUBLICATIONS................................................................... Publication 1........................................................................ Publication 2........................................................................ Publication 3........................................................................ Publication 4........................................................................ 47 49 63 75 95 xi 4. FUTURE WORK................................................................... 109 5. CONCLUSIONS.................................................................... 113 6. REFERENCES....................................................................... 117 7. ANNEXES.............................................................................. ANNEX I: GRIND CITATIONS….............................. ANNEX II: PENTACLE USER MANUAL................ 127 129 143 xii Objectives The main objectives of this thesis are the following: 1. To develop a new generation of alignment-independent molecular descriptors solving the problems detected in the previously published GRIND descriptors. 2. To validate the suitability of the new molecular descriptors for being applied to other fields of drug discovery diverse from the field of quantitative structure-activity relationship, for which the GRIND were originally developed. 3. To implement all the new methods in commercial grade scientific software, making them accessible to scientists working in this field. The first objective required to identify the main problems of the GRIND and to develop two new algorithms replacing the ones implemented in GRIND: one for discretizing the molecular interaction fields (AMANDA) and another for encoding the regions into an alignmentindependent description (CLACC). With respect to the second objective, the properties of the new descriptors allowed us to use them in molecular similarity applications, like ligand-based virtual screening. Afterwards, their suitability was validated using extensive systematic tests, with positive results. The third objective required the development of novel software (Pentacle), in which all the algorithms and methods described in this thesis have been implemented and which has been used for carrying out the aforementioned validation studies. xiii List of publications Articles: • Development and validation of AMANDA, a new algorithm for selecting highly relevant regions in molecular interaction fields. Durán A, Comesaña G, Pastor M. J. Chem. Inf. Model. 2008, 48(9):1813-23. • Suitability of GRIND-based principal properties for the description of molecular similarity and ligand-based virtual screening. Durán A, Zamora I, Pastor M. J. Chem. Inf. Model. 2009, 49(9):2129–38. • Consistently Large Auto and Cross Correlation(CLACC): a novel algorithm for encoding molecular interaction fields regions into alignment-independent molecular descriptors. Durán A, López L, Pastor M. (manuscript in preparation). • Pentacle. Integrated software for computing and handling GRIND-2 alignment-independent descriptors. Durán A, Pastor M. (manuscript in preparation). xv Oral communications: • (MIP-based) Molecular Descriptors in Pharmaceutical Research. Sanz F, Durán A, Fontaine F, Pastor M. Electronic Structure: Principles and Applications. Santiago de Compostela. Spain. July 18-21 2006. • Molecular Descriptors for the XXI Century. Pastor M, Durán A, Zamora I, Sanz F. The 16th European Symposium on Quantitative Structure-Activity Relationships & Molecular Modelling. Mediterranean Sea. September 10-17 2006. • Application of 3D GRIND descriptors for virtual screening. Durán A, Zamora I, Pastor M. European Research Network in Pharmaceutical Sciences. Granada. Spain. February 23-25 2008. xvi Poster communications: • GRIND-2. A new generation of alignment independent molecular descriptors for drug discovery. Durán A, Pastor M. XXth International Symposium on Medicinal Chemistry. Wien. Austria. August 31 - September 4 2008. • Pentacle. A new tool for generating and handling alignmentindependent molecular descriptors. Durán A, Pastor M. The 17th European Symposium on Quantitative Structure-Activity Relationships & Omics Technologies and Systems Biology. Upsala. Sweden. September 21-26 2008. • GRIND-2. A new generation of alignment-independent molecular descriptors. Durán A, Pastor M. The 17th European Symposium on Quantitative Structure-Activity Relationships & Omics Technologies and Systems Biology. Upsala. Sweden. September 21–26 2008. xvii “As linguas son para comunicarse e non para loitar” (Víctor Manuel González Solla) “Si la gente no hiciera cosas estúpidas, nunca se podría haber hecho nada inteligente” (Ludwig Wittgenstein) 1.INTRODUCTION 1 1.INTRODUCTION 1.1 Drug Discovery History The process of drug discovery has changed significantly along the history. In the past, most of the drugs were discovered either by identifying the active principles from traditional remedies, by serendipitous discovery or by means of trial-and-error process (1). Nowadays, rational approaches are used for understanding how disease and infection are controlled at the molecular and physiological level, targeting specific entities on the basis of this knowledge. The pathway leading from the past to our days may be outlined in the following historical events. In the past, medicinal plants were used for the treatment of health disorders. A step forward was the extraction of the “active principles” from the medicinal plants and their use as a source for new drugs. An example is the work of the pharmacist F.W. Sertürner, who in 1817 isolated morphine from opium extract (2). At the end of the 19th century, Paul Ehrlich postulated the existence of the “chemoreceptors” and the idea that their inter-species differences could be exploited therapeutically (2), giving birth, in that way, to the basic ideas of chemotherapy. Paul Ehrlich discovered in 1908 the Salvarsan, the first anti-syphilitic drug, which saved the life of thousands. A more functional concept was introduced by J.N. Langley in 1905 (3) in which the receptor serves as a “switch” that receives and generates specific signals and can be either blocked by antagonists or switched on by agonists. Another milestone in drug discovery was set by the use of mammals metabolites as a source of new drugs. The discovery of the insulin in 1922 by Bating and Best is one of the most famous examples of these techniques. The next breakthrough in medicinal chemistry was the identification of vitamins by the middle of the 20th century. In 1929 the discovery of penicillin by Alexander Flemming and the subsequent preparation by Chain and Florey in 1940 (4), introduced a new era in drug discovery with the identification of the antibiotics. The development of the organic synthesis, allowing the obtention of numerous new substances, can be also associated to the discovery of new drugs; an example is the structure of the benzodiazepine 3 1.INTRODUCTION chlordiazepoxide (Librium) obtained as an unexpected product of a reaction. Up to the sixties the determination of the compounds biological activity was performed on entire animals (in-vivo). The development of more sophisticated biological assays, thanks to the progress made in molecular biology and biochemistry, introduced the possibility to test receptorligand interactions in-vitro. Further achievements in molecular biology also allowed the production of recombination proteins. In current drug discovery projects, molecular biology is a key tool for understanding the disease process at molecular level and for finding out suitable molecular targets. In the seventies, the development of X-ray crystallography and nuclear magnetic resonance provided the first 3D structures of the biological targets, sometimes as complexes with a ligand bound. This new source of structural information opened the door to structure-based drug design (5) and to the incorporation of information technologies into the drug discovery process (6). In the early eighties, chemists and biochemists began using computer technologies as a core component of their research effort, in coincidence with the launch of the first personal computer. Later in the nineties, advances in combinatorial chemistry allowed the creation of extensive collections of compounds for testing. High throughput screening platforms, able to perform biological tests on thousands of compounds, were developed thanks to advances in robotics and miniaturization. Drug discovery process The drug discovery process can be represented in a schematic way using the metaphor of the “drug discovery pipeline”. The drug discovery pipeline is a simplification of the drug discovery process carried out by a pharmaceutical company, where each step produces an output that is used as input in the next step. Typically, the pipeline splits the drug discovery process in six consecutive steps: target validation, discovery, preclinical process, clinical development, application for first market and international launch program. The whole process is extremely long and expensive, and for this reason the pharmaceutical industry is receptive to new technologies 4 1.INTRODUCTION which could speed up the process and make it more efficient. Not all steps are equally susceptible of being shortened, and, for example, clinical development needs a relatively fixed amount of time and resources. On the other hand, the steps included in the preclinical research, that is, target validation, discovery and preclinical development, are more suitable for applying technological advances aiming to increase the efficiency and reduce the time required to launch a new drug to the market. These three steps include five different subprocesses: target identification, target validation, hit finding, lead finding and lead optimization (7), as shown in Figure 1. Figure 1. Drug discovery process diagram. Every of the process mentioned above involves a different task within the pipeline: • • • • Target identification. Search for biomolecules related to the disease of interest. It is the first step and one of the most difficult. Target validation. Verification of whether the biomolecule identified as a possible target for the disease is therapeutically usefull. Hit finding. Enquiry for a small molecule showing a certain binding affinity for the selected target that could serve as a starting point. Lead finding. Improvement of the binding affinity, pharmacokinetic properties and chemical properties (chemical derivability, originality, drug-likeness) of the hit compound to reach a certain minimum level. 5 1.INTRODUCTION • Lead optimization. The lead compound is optimized by derivatization, until their pharmacodynamic and pharmacokinetic properties are improved to a much higher level. Modifications of this protocol are frequently introduced in real world projects; the diagram is is only a simplification where several assumptions have been adopted: • • • The idea that a single one target is linked to the disease is often not true and then several targets must be considered for the disease in treatement (8). The effect of the drugs in other targets must be also considered (side-effects) (9). Target selection is not always the starting point of the process. The pipeline can depart from other step, like hit finding, for different reasons: starting from drugs marketed by another company, identification of a new possible drug by chance, use of natural products, etc. Optimizing and speeding up these processes is critical for the success of any drug discovery project. The introduction of computational methods aims precisely to this goal. Computational methods in drug-discovery Currently, computational methods are used in all the aforementioned preclinical research steps (10), contributing significantly to minimize the time and resource requirements (chemical synthesis and biological testing). Drug discovery computational methods can be classified according to the step where they are applied within the pipeline. • 6 Target identification: o Genomics (11). Relates the lack, modification or level of expression of one or more genes with the presence or absence of a certain disease or physiological characteristic in the individuals. Microarrays is the main technique applied in this field. o Proteomics (12). Involves the identification and quantification of gene expression at the protein level. Additionally, proteomics may help to identify protein interaction partners and members of 1.INTRODUCTION multiprotein complexes. Using this information, proteins can be selected as targets for the disease of interest. Figure 2. Most common techniques used in the drug discovery pipeline. • Target validation: o Systems biology (13). Aims to explain quantitatively how properties of biological systems can be understood as functions of the characteristics of, and interactions between their macromolecular components Its objective is to explain the function of the proteins based on understanding how the pathways, where the proteins participate, work (14). o Pathways identification. Tries to identify the chemical reactions and the proteins involved in them, providing information about how these reactions take place and how they can be modified. These interactions between proteins are the key of the function of the target related to the disease. • Hit finding: o Virtual Screening (15). Consists on carrying out a computational search on a database of small molecules that can be identified as novel lead compounds. These searches can be driven by the similarity to previously known active ligands, the so-called, ligand-based virtual screening, or by the complementarity to the target structure, known as structure-based virtual screening. o Structure-Based Drug Design (SBDD) (16). The underlying idea is to know the atomic level details of the molecular target and to apply this knowledge in order to drive the design of improved drug candidates. The protein structure is used for characterizing 7 1.INTRODUCTION the interactions with potential ligands using diverse computational methods. o High Throughput Screening (HTS) (17). Takes advantage of automation, like robotics, data processing and control software, liquid handling devices, and sensitive detectors, to investigate large number of compounds in vitro assays in order to identify those capable of modulating the biological target of interest. o Drug likeness filtering (18). Aims to remove candidates with not appropiate pharmacokinetic and pharmaceutical properties, based on their lack of matching a certain profile of chemical or physicochemical properties identified as common in marketed drugs or lead compounds. • Lead finding: o Molecular similarity methods. Searches for compounds applying a similarity matching technique using already known active compounds as templates that drive the search. These techniques try to capture and quantify the similarity between different molecules. o Quantitative Structure-Activity Relationships (QSAR) (19). Aims to find the underlying relationship between the structure of a molecule and its binding affinity (or other biological properties) using information extracted from molecular descriptors by means of mathematical methods. Once this relationship is determined for a series of molecules, they can be used for predicting in silico the activity of new compounds or for identifying the structural properties associated with the biological property of interest. o Scaffold hopping (20). Search for new structures based on the replacement of certain fragments with other bioisosterically equivalent. Basically, ligand groups with some kind of pharmacophoric features are replaced by other groups that share the same pharmacophoric properties. These new groups are introduced in order to improve some pharmacokinetic and/or pharmacodynamic properties of the compound as well as to avoid intellectual property issues. • Lead Optimization: o Quantitative Structure-Property Relationships (QSPR). As well as QSAR, QSPR aims to find the underlying relationship between the structure and another property of the molecule, typically pharmacokinetics properties like absorption or toxicity. QSPR 8 1.INTRODUCTION can also be used for predicting the properties analyzed in the model. o In silico ADMET prediction (21). Prediction and optimization of the absorption, distribution, metabolism, excretion and toxicity values of the lead, using diverse computational methods. 1.2 Molecular Descriptors Introduction Computing molecular descriptors is one of the first steps in any computational methods, since the molecules themselves cannot be feed into the computer and, instead, they must be represented by a piece of information which describes their properties. An illustrative definition can be found in the book Handbook of Molecular Descriptors (22): "The molecular descriptor is the final result of a logic and mathematical procedure which transforms chemical information encoded within a symbolic representation of a molecule into a useful number or the result of some standardized experiment." Molecular descriptors can be classified into two families, computational and experimental, based on the way they are obtained. Computational descriptors can be also split into three classes: one-dimensional (1D), two-dimensional (2D) and three-dimensional (3D). One-dimensional descriptors represent properties that do not require the knowledge of the topology or the tri-dimensional structure of the compounds, but are related to global properties of the molecule as stoichiometry, molecular weight, number of atoms of a type, etc. Despite of the coarse description of the molecule properties they provide, they have been used with success in several applications (23,24). Two-dimensional descriptors include the topology and molecular connectivity of the compounds. Most of the methods used for calculating log P (octanol/water coefficient of partition, used for measuring the hydrophobicity of the compound) are based on fragmental 9 1.INTRODUCTION approaches using 2D descriptors. Molecular connectivity indices, described by Randic and co-workers (25-31), also fall in this category. Another kind of 2D descriptors are the so-called “fingerprints” (32) where the presence of a given fragment is encoded into a bit string. Three-dimensional descriptors are computed from a three-dimensional structure of the compounds. The properties can be global, for example, the HOMO and the LUMO energy (33), or the dipolar moment. 3D descriptors can be also obtained by computing the energy of interaction between the compound and a probe representing an interaction of interest at regular intervals. Such descriptors, also called Molecular Interaction Potentials (MIP) or Molecular Interaction Fields (MIF) are used in widespread methods like Comparative Molecular Field Analysis (CoMFA) and GRID (34). Molecular interaction fields Molecular descriptors are commonly used for predicting the biological properties of a compound (e.g. potency against a certain target). Often, such biological properties depend critically on the ability of the compound to establish non-covalent, energetically favorable, interactions with a certain biomolecule. A powerful method for characterizing the potential interaction of a small compound with a receptor is to compute a Molecular Interaction Field (MIF) describing the energies of the interaction between a “molecular probe” and the compound studied in a region of the space. The simplest probe is a proton and in this case the MIF is called Molecular Electrostatic Potential (MEP). In a more complex case, the probe can be a small molecule (e.g. water) or a chemical group such as an amide. MIF can be used in two ways: on proteins for identifying the regions where a ligand could bind or on ligands for describing the kind of interaction which the ligand can establish at the receptor binding site. MIF can be computed analytically by means of Quantum Mechanics (35) or sampled using Molecular Mechanics methods (36). In the later case, in order to sample the MIF (which is a continuous function in the space around the molecule) a probe is moved at regular intervals within a box that surrounds the molecule or the regions to be studied, creating in this way a grid of points, so-called nodes, at which the probe-compound energy of interaction is computed, using a certain molecular mechanics 10 1.INTRODUCTION energy function. As a result, the intrinsically continuous MIF function is transformed into a discrete number of points. Figure 3. Three-dimensional grid used for a MIF computation. Figure 4. MIF calculation result for a ligand (clozapine) using O probe and a receptor (dopamine D2) using N1 probe. 11 1.INTRODUCTION The first application of MIF computation to ligand design was described by the pioneering work of Goodford (36) and his program GRID. This program has the peculiarity of implementing an energy function developed ad hoc for this purpose and largely improved in successive versions (37-39). This energy function can be formulated as (40): E= Evdw ∑E + ∑E C = ∑ Ae − r vdw el + ∑E hb − Br pt pt 6 pt q p qt ⎛⎜ 1 (ε t − ε s ) / (ε t + ε s ) ⎞⎟ E el = + ⎟ Kε t ⎜⎜ rpt rpt2 + 4 s p s t ⎟⎠ ⎝ Ehb = Er × Et × E p Er = M N − rm rn eq.1 eq.2 eq.3 eq.4 eq.5 where Evdw is the energy due to Van der Waals interactions, Eel is the electrostatic energy and Ehb is the energy due to hydrogen-bond formation. Evdw can be modeled by means of Leonard-Jones formulae adopting a 12-6 function or by using a more complex one such as the Buckingham energy function (eq.2), where rpt is the interatomic distance between the probe and the atom of the target. Eel can be calculated based on the Coulombic energy between two point charges qp and qt, taking εt and εs as the relative dielectric constants of the target and the solvent phases respectively and sp and st as the nominal depths at which the probe and target atom respectively are buried in the target phase. Er is dependent on the separation between the target and the probe atoms, and is usually given by eq.5, where m and n adopt the values of 8 and 6 respectively in GRID calculations. Et and Ep (not shown) are dependent on the angle made by the hydrogen bond at the target and probe atoms respectively. They take values between 0 and 1. Originally GRID was developed for being used as a Structure-based drug design (SBDD) tool and not as a QSAR tool, but the publication of the article Multivariate characterization of molecules for QSAR analysis (41) opened the door for using the results of GRID computation as molecular descriptors. 12 1.INTRODUCTION The rational for these applications is based on the idea that the MIF computed for small compounds contains a lot of information related to its potential to interact with a receptor. Therefore the energy values can be used to describe the molecules in diverse applications. For example, when the MIF computed for active and inactive molecules differ at a certain region, these differences in the MIF can be associated to the changes observed in the biological activity. This is the underlying idea in the CoMFA (42) and GRID/GOLPE methodologies. However, for carrying out such comparison of MIF computed on different compounds, the structures must be first superimposed in the space, in such a way that the energies computed at the same position of the space could be directly comparable. This structural superimposition or alignment is not an easy task. When the compounds share a common scaffold or evident pharmacophoric elements, it is feasible, but when they are structurally diverse or such common features are not so clear, the procedure is difficult and the results are often arbitrary. Moreover, the procedure is difficult to perform in an automatic way and usually require intensive human intervention which limits the applicability of the method and the size of the series which can be afforded to investigate. GRID independent descriptors GRID INdependent Descriptors (GRIND) were first published by Pastor et al. (43) and afterwards improved by Fontaine et al. (44,45), as a new generation of MIF-based alignment-independent molecular descriptors, specifically designed to characterize ligand-receptor interactions. The main idea which underlies in the GRIND is to replace the absolute spatial coordinates associated to every MIF variable by some sort of internal geometric description. The GRIND method does not aim to capture all the information present in the MIF, just to identify relevant regions of interaction and describe their relative positions. A GRIND calculation starts with the computation of one or several MIF, using diverse probes. Typically, the calculation includes the hydrophobic probe (DRY), the hydrogen bond acceptor probe (O), and the hydrogen bond donor probe (N1). The shape probe (TIP) is one of the most used probes since year 2004, when Fontaine et al. (44,45) developed it ad hoc for being used a shape description in GRIND 13 1.INTRODUCTION computations. These probes represent the most important non-covalent interactions found in biological receptors. Figure 5. GRIND descriptors calculation. 14 1.INTRODUCTION Once the MIF have been computed they are discretized by an algorithm which uses the intensity and the distance of the MIF nodes in order to identify the most relevant regions (hot spots). This discretization method has been criticized (46) due to its limitation for selecting relevant nodes in certain cases. Before starting the computation, the algorithm requires to set the number of selected nodes to a fixed number. This constrain creates limitations in the description of non homogeneous series because: (i) not all interaction regions are represented when the number of selected nodes is short, or when the number of selected nodes is large enough but there is a strong region that masks weaker regions (non sensitive); (ii) selected nodes do not always represent only relevant interaction regions whether the number of selected nodes is too large (non specific). Then, for every posible couple of MIF computed, the selected hot spots are encoded into alignment independent descriptors using a Maximum Auto and Cross Correlation (MACC). In practice, every couple of selected points is considered, but only one couple is stored for each distance bin according the criteria of maximum value of the product of their MIF energies. Stored data allows tracing back the nodes that originate the selected product and represent them in 3D, which is useful for the chemical interpretation of the models. All the varible computed for a couple of MIF are called correlogram. The aforementioned probes (DRY, O, N1 and TIP) generate ten correlograms, four of which are called auto-correlograms (DRY-DRY, O-O, N1-N1, TIP-TIP) and the six remaining are called cross-correlograms (DRY-O, DRY-N1, DRYTIP, O-N1, O-TIP, N1-TIP). Each correlogram is scaled using precomputed factors, to make sure that every correlogram contains value approximately in the range 0-1. The ensemble of all the correlograms represents all the interactions that one compound can make in a compact and understandable way. In these correlograms, every GRIND variable represents both the presence and the intensity of a couple of nodes present at a certain distance. Using the appropriate software it is possible to visualize the couple of nodes which has been used to assign a value for a certain GRIND variable in a certain compound. The described procedure allows obtaining molecular descriptors which do not require superimposing the compounds. However, this approach is not free, and during the MIF processing some information is lost and 15 1.INTRODUCTION some information is confounded (47). For example, the selection of the representative distance of each bin for a series of compounds is computed taking into account only the product with the highest value for each distance bin and molecule. In series of structurally related compounds, this choice can pick different node couples for representing the same structural features, producing a sort of inconsistence in the description which makes the interpretability of the model very difficult. An illustrative example could be seen in figure 6, where similar molecules and the selected MACC variables for each one at the same bin distance are shown. This figure reveals the two problems that MACC selection can produce: inconsistency (a) and confusion (b). The inconsistency problem appears when the compounds contain alternative sites representing the same variable and the method, based only in the criteria of maximum MIF energy product, selects different features in the compounds; while the phenomenon of the confusion consists of selecting different variable representatives for each molecule when they do not contain the same alternative sites representing the same variable and then the variable is representing two or more different and unrelated positions, creating a variable that can be considered to be a mixture of the different interactions selected for each compound. Figure 6. Example of ambiguous node couple selection in MACC. In spite of the fact that GRIND descriptors are alignment independent, they are not conformation independent. This limitation, present in any 16 1.INTRODUCTION 3D descriptor, can be a problem when the descriptors are used for comparing structures with large conformational freedom, specially if the consistency of the conformations have not been considered when the 3D structures were generated. Ideally, 3D descriptors must be built starting from realistic bioactive conformations of the compounds (e.g. those obtained in crystal complexes with the receptors). However, these conformations are seldom known and alternatively, less quality approaches must be used, like the use of receptor-docked poses, minimum energy conformations or extended conformations (e.g. those obtained with rule-based methods like CORINA (48)). In any case, the GRIND can also be considered more robust to small conformational changes than other 3D descriptors (e.g. MIF) because they use relative distances between interaction regions which tend to remain more constant in front of small conformational changes that other descriptors in which the variables are associated to precise Cartesian coordinates in space (49). See Figure 7. Figure 7. Differences between the conformational dependence of GRIND descriptors and GRID computed MIF. Since its publication, the original GRIND article has been cited around one hundred fifty times (details in Annex I) demonstrating that this methodology is now a commonly used tool. Even if the GRIND descriptors have been applied in different fields, like protein-protein recognition (50), database mining (51) and scaffold hopping (52), they have been applied mainly in 3D-QSAR (53-56). 17 1.INTRODUCTION 1.3 3D-Quantivative Structure-Activity Relationship Introduction Quantitative Structure-Activity Relationship (QSAR) is a set of mathematical and statistical techniques that tries to explain the differences observed in the biological activity of a set of compounds in terms of the differences observed in their structure. The result of a QSAR study is a mathematical model that describes this relationship. It is important to emphasize that a QSAR model is not a mechanistic model, like the ones found in Physics or Chemistry. Such models are only possible for phenomena which could be described exhaustively, which is not the case in most drug discovery process. QSAR models belong to an inferior rank, the so-called empirical models that approximate the response of the system in a limited range of the variables involved (57). QSAR models can be used for predicting the biological properties of new compounds or for unveiling structural characteristics present in active compounds. However, QSAR models have some severe limitations which must be borne in mind when they are applied in practice. First, the usefulness of these models is limited by the quality of the series used for building the models (training series), since the model can make predictions only for compounds with a similar structure to those included in the training series. In addition, QSAR models cannot evaluate the effect on the activity of structural features which are present in all the compounds of the training series, because these characteristics do not contribute to explain the differences in the activity. Further limitations are introduced by the variables used to describe the molecular structure. No molecular descriptor is perfect and every method used for describing the structure of the compounds in the training series has pros and cons. For example, models created with 3D descriptors are more general than models obtained using 2D descriptors and less dependent on the molecular topology. 3D descriptors can lead to the same or very similar MIF for different 2D structures which contain the same interaction properties; meanwhile 2D descriptors will be different. On the other hand, 3D descriptors suffer from the aforementioned problem of the conformations, which is absent in 2D descriptors. 18 1.INTRODUCTION The first approaches which can be considered QSAR are the so-called Free-Wilson and Fujita-Ban methods (58), which use discrete parameters to characterize the substituents present in congeneric series. There, the activities of a series of derivative of a reference structure are described by means of equation 6. BA = ∑ ai I i + μ eq.6 where BA is the biological activity of each product, ai is the contribution to the activity of each substituent i, and Ii is a binary variable which takes the value 1 when the substituent i is present and 0 when the substituent i is absent. The µ constant corresponds to the mean activity of the series in the Free-Wilson method and to the activity of the product without substitution in the Fujita-Ban method. Models of this type are valid only for describing congeneric series and therefore only serve to determine the optimal combination of substituents. Other QSAR approaches do not use discrete values, but parameters expressing physico-chemical properties of the substituents like their size, electronic properties or hydrophobicity. The first QSAR equation of this type was published by Hansch et al. (59) to explain the activity of plant growth regulators. In this method, the models are expressed by a mathematical function such as equation 7. log A = a1 x1 + a 2 x 2 + ... + a n x n + cte eq.7 The two aforementioned methods, Fujita-Ban and Hansch, are limited to the description of congeneric series, since their variables must make reference to specific positions in a common structural scaffold. A way of breaking this limitation is to use descriptors linked to specific 3D coordinates of the space, like the MIF. Such methods, also known as 3DQSAR allow describing structurally unrelated compounds, as far as we can provide a consistent compounds alignment. The use of 3D descriptors has the advantage of expanding the field of application and providing a more realistic representation of the compounds. On the other hand, in most cases the bioactive conformation of the compounds is unknown, thus limiting the quality of the descriptors for the aforementioned reasons. In QSAR, this problem is mitigated by the fact that the model describes only “the differences in 19 1.INTRODUCTION structure” and therefore, constant errors in the structure of all the compounds are canceled out and have no impact in the final quality of the models obtained. Another problem of 3D-QSAR studies, also related with the use of 3D descriptors, consists of the generation of thousands of variables, difficult to handle and to apply in regression analysis. In this case, the application of multivariate analysis techniques for extracting information and building regression models is compulsory. Among the most popular methods are the Principal Component Analysis (PCA) and Partial Least Square (PLS) regression. Principal component analysis Principal Component Analysis (PCA) (60,61) is a technique that allows the discovery of trends in a set of objects defined by several variables. In few words, PCA is applied to a X matrix, where each row contains the variables (descriptors) representing an object (molecule). The result of the analysis is a summary of the original matrix which can be used to describe the objects using a few, highly informative variables called Principal Components (PC). The underlying formula in PCA calculations is defined by equation 8. X = 1 ⋅ x' + T ⋅ P + E eq.8 where X is the object matrix, 1 ⋅ x' represents the variable averages, P is the loading matrix, that contains the weight of each variable in the model, T is the scores matrix, that contains information about the objects, and E is the residual matrix that contains the information not explained by the model. If the original matrix contains M objects described by N variables in the original space and the PCA extracts K PC’s, the dimensions of the matrixes must be: X matrix MxN, T matrix MxK, P matrix KxN and E matrix MxN, as is graphically summarized in Figure 8. 20 1.INTRODUCTION Figure 8. Matrix decomposition for a PCA model with M objects, N variables and K principal components. In PCA, the PCs are extracted in such a way that the projection of the X matrix on the PC maximizes the sum of squares. Also, each PC extracted must be orthogonal to the previous ones, that is, each PC is completely independent to each other and there is no correlation between the information contained in them. As a consequence, the first PCs condense much of the information present in the original X matrix and a 2D or 3D scatter plot of the first PC clearly shows the types of objects, the presence of clusters, outliers, etc. On the other hand, the scatterplot or bar plot of loadings are useful to identify the variables which discriminate between the objects. Figure 9. PCA scores plot of a typical GRIND calculation. 21 1.INTRODUCTION Figure 10. PCA loading plot of a typical GRIND calculation. Partial least squares Partial Least Squares (PLS) (62) is a regression analysis tool, which connects the information included in two blocks of variables, X and Y, to each other. It is used for building predictive models when the number of variables is much higher than the number of objects. In the context of 3D-QSAR the biological activity is used as Y variable. The function relating X with Y variables can be represented by the equation 9. Y = XB + G eq.9 where B is the regression coefficient matrix and G a noise matrix. The B matrix can be split into three matrixes: the weights (W and C) and the loadings (P) of the model (63). B = W ( P 'W ) −1 C ' eq.10 PLS regression analysis is usually carried out using the NIPALS algorithm (64), which can be outlined in the following steps: 22 1.INTRODUCTION wa ' = u a ' X /(u a ' u a ) eq.11 w a = wa / wa eq.12 t a = X wa /( wa ' wa ) eq.13 c a ' = t a ' Y /(t a ' t a ) u a = Yca /(c a ' c a ) eq.14 eq.15 For each dimension (a=1...n), these first five steps are iterated until convergence, meaning that the vectors do not change by more than a certain error value. u1, the starting score vector, is a randomly generated vector or better, some arbitrary column of Y. To keep stable the numeric computations, the length of the weight vector w is always kept equal to one. After these five steps have been converged, the following steps are started. p a ' = t a ' X /(t a ' t a ) E = X − t a pa ' F = Y − t a ca ' eq.16 eq.17 eq.18 In equation 16 the loading vector of the X matrix (pa) is calculated. In equations 17 and 18, matrixes X and Y are updated (deflated) by subtracting the variance explained by the last component. These are the steps defined in the classical NIPALS PLS algorithm for each dimension. When the computation of one dimension is finished, the original X and Y matrix are deflated to obtain E and F, which are then used as the starting point for the next step. One of the problems of PLS regression models is the possibility to overfit, that is, explain the noise present in the model instead of the underlying relationship. In order to avoid overfitting, the determination of the suitable number of Latent Values (LV) cannot be done based on the quality of the fitting but on the predictive quality of the model. Ideally, such predictive ability must be evaluated using an external set, however the selection of an external test is not an easy task and in practice, the most common way to assess the predictive ability of the model is to use cross-validation. In the cross-validation the objects involved in the construction of the model are also used for the validation. There are different cross-validation methods depending on how many 23 1.INTRODUCTION objects are used in each interaction. Two examples are: Leave One Out (LOO), where one object is extracted from the model and predicted with the model obtained with the whole set without itself, Random Groups (RG), where a number of k groups of j objects are extracted randomly and predicted in front of all the remaining objects. The selection of one Figure 11. Flow chart of NIPALS PLS algorithm, where N is the number of X variables, M the number of objects, K the number of Y variables and A is the number of Latent Values. Parenthesis show that value enclosed will be the final size of the matrix, but in each step the real dimension is 1. of the cross-validation methods is a philosophical choice, for example, LOO obtains good results when data is clustered because the extraction of one element does not affect the robustness of the model, while RG could obtain a poor prediction whether one obtained group contains 24 1.INTRODUCTION many elements of a cluster (65). Cross-validation methods are repeated until every object has been extracted and predicted once. Then the predicted Y values ( y ' ) are compared with the real Y values ( y ) in order to obtain a quantification of the prediction. Two metrics used for assessing the prediction are Standard Deviation of Error of Prediction (SDEP) and the predictive correlation coefficient (q2), defined by the following equations: SDEP = ∑ ( y − y ') 2 N ⎡ ( y − y ' )2 ⎤ ∑ ⎥ q = 1− ⎢ ⎢∑ y−y 2 ⎥ ⎦ ⎣ 2 ( ) eq.19 eq.20 where y is the real value, y ' is the predicted value, y is the average Y value, and N is the number of objects. PLS is a suitable technique in situations in which the characteristics of the data do not allow to make standard assumptions. Models are validated using the same cross-validation methods mentioned above or resampling techniques, replacing inferencial statistics methods like Analysis of Variance (ANOVA) or hypothesis contrast tests. In QSAR, the PLS models can be used for prediction, but they can also be interpreted in structural terms. Such interpretation consists of the identification of the structural characteristics (X variables) that have a major influence in the activity (Y). In that way, the identification of these variables must be focused on the weight values of each variable for the number of LV of interest. These weights are commonly interpreted on each latent value as the sum of all the weights obtained in the previous latent values and they are commonly known as PLS coefficients. Often, a PLS model does not shown an acceptable q2. In some situations, this is a symptom that some of the X variables, relevant for fitting the model, have a negative effect on the model predictive ability. In order to improve the quality of the models and remove such X variables, several variable selection methods have been proposed. One of the most used in 3D-QSAR is the Fractional Factorial Design (FFD) variable selection algorithm described in GOLPE (66). The idea is to evaluate the effect 25 1.INTRODUCTION on the model SDEP of every single variable and variable combination (67). Since the individual evaluation of the impact in the model of every variable could be extremely time-consuming, a design matrix, like the one that can be shown in figure 12, is used for selecting a subset of variables. When variables are removed, the model is created and evaluated based on the SDEP value. Thereby, every variable effect on SDEP will be computed as the average SDEP for all models that include the variable minus the average SDEP for the models that do not include it. The statistical significance of these variables effects will be evaluated comparing them with average scores obtained for dummy variables by means of a Student’s t test. Model 1 Model 2 Model 3 … Model J-1 Model J x1 … + x2 + … - x3 + + … + x4 + … - x5 + + … + + x6 + + … + - x7 + … + + x8 + + … + - x9 + + … + … … … … … … … xn + + … + - Figure 12. Matrix for selecting the variables to evaluate in the Fractional Factorial Design. Frequently, the FFD selection has an important impact in the interpretability of 3D-QSAR PLS since the total number of variables is largely reduced. 1.4 Ligand-Based Virtual Screening Introduction Virtual screening methodologies emerged at the end of the nineties (68) to lead the identification of new molecular scaffolds which open new chemical spaces for a target. They were developed as new methods for supporting hit finding and lead optimization in drug discovery using computer programs in contrast to high-throughput screening. The 26 1.INTRODUCTION potential of this approach has been demonstrated by the identification of several inhibitors and antagonists (69-71). Virtual screening has also been developed thanks to the existence of different large databases of ligands, as well as, the knowledge of different structures that are able to bind with a specific target. Virtual screening can be split into two categories: targetbased virtual screening (TBVS), where the efforts for obtaining new hits and leads use the structure of the target and ligand-based virtual screening (LBVS) where only known active ligands are used for discovering new ones. In target-based ligand screening, the effort to find a new structure is made through docking programs which score the ligand taking into account the structure of the target. In contrast, ligand-based virtual screening applies the knowledge of active ligands for a specific receptor, used as templates, to extract computationally compounds from a database depending on the molecular similarity to the templates structures. Molecular similarity The application of molecular similarity into ligand-based virtual screening is based on the idea that two molecules that are structurally similar must have a likely binding affinity. This molecular similarity is not limited to the same atoms in similar positions, but they can be seen as a similarity in the chemical properties of the compounds, that is, compounds may share their chemical properties despite of having a different molecular structure. The use of molecular descriptors as well as the limitations of this method has been already discussed in this work. Thereby the usefulness of molecular similarity methods is commonly limited by the quality of this description (72,73). The correct assessment of the molecular similarity is an important step in virtual screening. Several scoring functions have been proposed for sorting the structures extracted from a database, depending on the similarity that the molecules share with the template. Usually these score functions are based on the calculation of distances between the descriptors; the sort of distances used commonly depends on the descriptors. 27 1.INTRODUCTION Once the descriptors are selected and the score function is chosen, two more steps must be completed in order to obtain good results: template selection and database creation. Template selection When more than one ligand is able to bind the receptor, selection, validation and analysis of the ligands is necessary. The templates may not share the same molecular structure because, for example, they can adopt a different position within the pocket. In these cases, we must identify cluster of structures which must be taken into account in the database search. There are several alternatives in order to deal with this problem, like using different metrics or splitting the structures into clusters and execute a different search for each one. Usually, the crystal structure of the target with a ligand bound is considered as the ‘gold standard’ (74), but a detailed analysis of the parameters of the crystal preparation, like B-factors and the consistence of the hydrogen bonds must be done anyway. Another necessary validation is to check the correct assignment of the ionization states for all the ligands included in the template set. This is a critically step and even if there are different pieces of software that are able to predict the ligand ionization state for a given pH, the prediction of the true ionization states within the binding site are not too reliable. When 3D descriptors are used for describing the molecules, an additional problem in order to choose the templates structures is the search of their bioactive conformation. Database creation The starting point in many VS studies is a database able to cover a wide range of the chemical space. These kind of databases can contain around 8 million of purchasable compounds, like the ZINC (75) or WOMBAT (World of Molecular BioAcTivity) (76) databases. In such large databases, only a small percentage of the compounds is relevant for the search, and for some applications it is preferable the use of smaller databases known 28 1.INTRODUCTION as focused databases (77,78), where only a piece of the whole chemical space is covered. Besides these, pharmaceutical companies have their own databases, populated with in-house accessible compounds, adapted to diverse projects and carefully maintained to optimize the searches. In this sense and in order to remove irrelevant compounds, a set of filter steps can be applied to the database. The first filter is commonly a druglike filter. There are several criteria that can be applied but a common one used is to keep only the molecules that are composed of the elements H, C, N, O, P, S, Cl and Br, and posses a molecular weight<500Da (79) or use the Lipinski rule of five (80). Another filter that could be applied is a filter based on the size of the molecules, since tiny and huge molecules are usually not good candidates because they are not in the range of so-called lead-like molecules (81). Assessing the performance Once a new virtual screening method is developed, an assessment of its performance is mandatory. The main aspects to be assessed are the sensitivity, the specificity and the originality of the results obtained. Many authors have reported several methods to assess the performance, but nowadays only a few of them are used due to its significance. All metrics are based on splitting the known ligands into a template and test set (known actives), and on measuring the recognition of the actives made by the virtual screening method, that is, to check the ranking of the known active ligands extracted from the database. These measurements are accepted as standard, but the values obtained can be compromised by several factors depending on the used database; for example, a database where there are compounds those are able to bind with the target, but they are not identified, can give way to a low value in the metric. On the other hand, if the database contains compounds very dissimilar with the ligands, the value of the metric will be increased artificially. In order to avoid these kind of problems, standard databases as Directory of Useful Decoys (DUD) (82) were developed. The most commonly metrics are based on the Receiver Operating Characteristic (ROC) curves (83), being the Boltzmann-enhanced discrimination of Receiver Operating Characteristic (BEDROC) one of the most calculated nowadays (84). The BEDROC (85) differs from other metrics, because it emphasizes the “early recognition” of actives, 29 1.INTRODUCTION obtaining a higher value when the actives are recovered early. This behavior is achieved by applying a higher weight to actives recovered early than to actives recovered towards the end. The BEDROC is calculated according equation 21: n BEDROC = ∑e α − ri / N Ra sinh(α / 2) 1 + α (1− Ra ) n ⎛ 1 − e ⎞ cosh(α / 2) − cosh(α / 2 − αRa ) 1 − e ⎜ ⎟ N ⎜⎝ eα / N − 1 ⎟⎠ i =1 −α × eq.21 where n is the number of known actives structures, N is the number of inactive structures, ri is the rank of the ith active structure, Ra is the ratio of active to inactive structures n/N, and α is a weighting factor, which controls the “early recognition” element. 3D virtual screening: the bioactive conformation problem One important aspect of any VS method is the choice of suitable molecular descriptors. Ideally, the description should be focused on the physicochemical features which are involved in the ligand-receptor interaction. Usually, virtual screening methods use 2D molecular descriptors that are simpler and faster than 3D descriptors, but they are commonly focused on describing the topology of the 2D templates that frequently implies the selection of hits from the same structural family. One of the aims of a virtual screening search is to find compounds with some novelty degree with respect to the templates, that is, the structural family of some of the extracted compounds should be different. 3D descriptors have advantages over 2D descriptors since they are more focused on the physicochemical mechanism and not in the direct use of the molecule topology, which allows extracting compounds with scaffolds that differ from templates scaffolds, providing a higher abstraction of the topological structure of the templates. The aforementioned GRIND are interested candidates for this application, and some authors have published their application in virtual screening (86,87). However, its application has some drawbacks like the conformational problem (47) and the identification of the bioactive conformation of the templates. 30 1.INTRODUCTION Indeed, one of the main drawbacks of using 3D descriptors in VS is the selection of the bioactive conformation for the template or template compounds and the incorporation of multiple conformations in the search. In order to know whether a molecule can exhibit a bioactive conformation towards a target of interest, the database can be extended by computing a representative sample of accessible conformations for every molecule. Hence, all conformations can be included in the study and then the similar one to the bioactive should be recovered first. Nevertheless, a suitable description of the conformational space is not trivial, and can be addressed only in an approximated way. On the other hand, the selection of the template bioactive conformation is not easy, in absence of information about the receptor structure. In these cases, the bioactive conformation can be guessed using the concept of active-analogue approach (AAA) formalism (88), assuming that all active compounds for the same target must share a similar conformation. Even so, computational approaches for identifying common conformations would require obtaining all possible conformations of each molecule and searching the similar one between them, but this can be an extremely computationally expensive process in practice. 1.5 Software Development Introduction The computational chemistry methods described in prior sections must be implemented into suitable software. Since some of the methods are rather complex, the quality of the software in this field is of critical importance for making them accessible to the regular user. This means that the software must be robust, reliable and easy to maintain, but also, user-friendly and easy to use. Software can be defined as: “A collection of instructions or statements in a computer language where an input state is translated into and output state”. 31 1.INTRODUCTION Although software was developed and applied as solution for a lot of problems in order to save time and money, several times it failed to achieve this goal, because the development process was not well defined and was incorrectly carried out. The software development process is not an easy task and must deal with several problems like software complexity, software reliability, maintenance, etc. When a new piece of software is developed, its life cycle (89) must be taken into account. The life cycle of software consists of several processes: definition of the problem, description of the demanded requirements, analysis, design, implementation, verification, validation, integration and test. After these processes, the operational phase starts, where software is extended and maintenance is required. When the development of a new software is carried out, assigned times for different tasks should fulfill the next rules (assigned as a rule of thumb by Brooks (90)): 1/3 must be invested in planning, 1/6 in code codification, 1/4 in component tests and 1/4 in system tests, that is, the half of the time should be spent in testing. In general, the software development is a very complex process, limiting the quality of the software. In order to manage this complexity, several engineering models have been proposed, defining a series of rules which should be applied in order to obtain high quality software. The process models have evolved along the history of the software development and the choice of the most appropriate model depends on the peculiarities of the software which must be developed. The most relevant models are: waterfall, spiral and win-win. The waterfall model was defined in 1970 by Royce (91), where each task was developed after the previous one, making the model very linear and in consequence simple and attractive. Figure 13 shows how the process tasks are carried out. This model does not spedifies how a previous result must be modified when a problem related to an early step appears during the development. This is a key drawback, since the requirements are not completely known when the development starts and modifications of these requirements are very. 32 1.INTRODUCTION Figure 13. Flow chart of the waterfall model. The spiral model is a modification of the waterfall model defined by Boehm (92), where work cycles are included. This is the most commonly used nowadays. Each work cycle starts with the identification of the objectives and finalizes with the revision of the current achieved goals and the plans for the next cycle. A schematic view of the model is represented in the figure 14. The progressive changes carried out in software development are the center of this methodology. Usually one project is modified and new requirements are included when a new version is released. The win-win model, also proposed by Boehm, is a modification of the spiral model and tries to create the rules for the development taking into account all people involved in the project. Besides these models, there are also several standards (93) in order to evaluate the quality of the software. Each one of these standards is focused on different features, some examples are: Capability Maturity Model (CMM), ISO9000, Performance Engineering Maturity Model (PEMM), etc. When a novel software is developed, two key aspects must be decided: the user interface and the programming language. 33 1.INTRODUCTION Figure 14. Flow chart of the spiral model. User interface The User Interface (UI) is the part of the software devoted to interact with the users, which can be used for controling and modifying its behavior. The UI is one of the most important aspects of the software development. Great software with inadequate UI can fail in the market, while there are a lot of examples of poor software with a good interface which have reached success. For designing a comfortable interface, the developers must investigate how typical users would like to interact with the software and what they expect to obtain from the results. There has been an evolution of the UI mostly due to the dependence on the available peripherals and the kind of tasks assigned to the software. Along the history of the UI, four main interaction paradigms can be defined due to its significance: • 34 Batch interfaces, which are non-interactive user interfaces where the user specifies all the details of the job in advance, in 1.INTRODUCTION • • • order to batch processing, and receives the output when all the processing is completed. The computer does not prompt for further input after the processing has started. Command-line user interfaces (CLI), where the user provides the input by typing a command string on the computer keyboard and the system provides output by printing text on the computer monitor. Graphical user interfaces (GUI), which accepts input via devices such as computer keyboard and mouse and provides graphical output on the computer monitor. Touch User Interface (TUI), are graphical user interfaces which use a touch screen display as a combined input and output device. The latest trend in the development of UI is to mimic the way that humans interact with real objects in the real world. Probably, the most important step forward in the UI evolution was the development of the GUI. A series of standards defined around pioneering GUI (e.g. the IBM Common User Access, and the Open Foundation Motif) promoted the convergence of newer interfaces towards common interaction paradigms, shared between many applications, thus making possible that the skills developed for one application could be applied to many others. Two examples of the benefits of the GUI in drug discovery are pipeline-pilot (94) and Knime (95), pieces of software that have moved from the CLI mode to the GUI, allowing the user to describe complex computation protocols using a graphical data flow diagram. Nowadays, several of these four paradigms can be found in different programs commonly used in Drug Discovery. Most recent programs tend to implement GUI, but a lot of them still can be used in CLI mode or batch mode in order to improve the efficiency and to make them compatible with older versions. Programming languages A programming language is a machine-readable language designed to express computations that can be performed by a computer. The programming languages have evolved from a machine-like language to a human-like language during the history. The first language generation 35 1.INTRODUCTION was known as assembly languages, where the code was machine code. These kind of languages are at the bottom level of abstraction from the machine and are completely dependent on the machine where they are written. A second generation of languages developed, at the end of the fifties, includes one level more of abstraction; one example of this group of languages would be FORTRAN that is still used on scientific and mathematical environments. A third generation of languages also known as structure programming languages includes improvements like data abstraction, separately module compilation, data structuring, etc. This latest group can be split into three classes: general purpose high level languages, object oriented high level languages and specialized languages. • • • General purpose high level languages are languages that are suitable for most computer applications. They must support at least: comparison of strings and constants, branch and looping constructs and ability to read and write both sequential and random files. Examples are C or PASCAL. Object oriented high level languages are languages where the data and the methods used to modify and to access to this data are encapsulated within an “object”, which creates a convenient level of abstraction. Another important improvement of these kind of languages is the reusability of the code, that is, the objects coded in one application can be used in another one without rewriting the implemented code, and without the need to know how this implementation and which kind of data was used. The object must be seen as a black box where a series of inputs will be converted to a series of outputs. Commonly these languages include a lot of libraries which simplify the work of the programmer, being the most commonly used nowadays. Examples are: C++ or JAVA. Specialized languages are languages of which syntax was specifically designed for a particular application, like management of symbols and lists, vector and matrix manipulation, etc. These languages facilitate the translation of the design specifications into code but they are not easily portable. Examples are: LISP or PROLOG. Apart from them, there are languages of higher abstraction level, like the “scripting” languages, that are interpreted and include a lot of functions that resolve common problems like string parsing or HTTP connection establishment, making the programming of these tasks less 36 1.INTRODUCTION expensive. These languages use an interpreter which translates, in real time, the instructions into machine code which make them less efficient than compiled languages. These languages are frequently used in the field of bioinformatics where file processing and string parsing are very common tasks. Examples are: Perl, Phython or shell scripting On top of the abstraction scale one can find platform-independent object-oriented languages, allowing the programmer to develop software for multiple operating systems and hardware platforms. Languages belonging to this category can be grouped into two different types, those that use a virtual machine to reach the abstraction and those that use specialized libraries to provide an extra layer of abstraction at compilation time and which can run over diverse operating systems without limitations. In the first case, the most known example is JAVA (96) which uses a virtual machine running over the operating system to avoid the operating system dependence; this virtual machine introduces a sublevel of translation at run time, making JAVA programs slower than others that do not need the virtual machine. In the other category there is Qt (97), a multiplatform software development framework based on C++, able to compile a common source code (so called “portable code”) into executable code adapted for a large number of popular operating systems and hardware platforms (SGI Irix, Linux, Apple MacOS, Microsoft Windows, etc). 37 2.RESULTS AND DISCUSSION 39 2.RESULTS AND DISCUSSION After the brief overview of drug design, computational methods and software development concepts provided in the previous section, we will describe and discuss here the results obtained in order to summarize them in an understandable way. A more detailed description of these results can be found in the publications and documents attached in the next sections. As stated in the Objectives section, the main aim of the present thesis is to develop a new generation of alignment-independent descriptors. Our work started by analyzing the problems and limitations detected by us and by other authors in the GRIND, which we consider the state-of-theart in the field of molecular descriptors for drug discovery. Here we report the results of such analysis: 1. Often, the nodes selected by the original GRIND algorithm in the MIF discretization step miss important regions or overlook the influence of certain atoms. Moreover, this step requires a tedious manual adjustment, which is nearly impossible to optimize when the series contains highly dissimilar compounds. Therefore, we need to develop an improved MIF discretization algorithm. 2. The encoding step of the original GRIND algorithm was also a source of problems (like the inconsistency and confusion errors reported in section 1.2). In particular, the results of MACC method were not optimum in series containing structurally related compounds, in which such problems become evident and hamper the interpretation of the models in structural terms. Again, we detected the need to improve the method by developing an alternative encoding algorithm. 3. The results of a 3D-QSAR model obtained with GRIND were not easy to interpret. Many ALMOND users complained about the need to open multiple windows, crowding the desktop and the lack of a straightforward approach for carrying out such interpretation. We find out that ALMOND was not well adapted to the needs of the users and decided that we needed to develop a new software, much easier to use and much more adapted to the diverse tasks involved in the computation, inspection of the GRIND, integrating also all the tools required to build, validate and interpret 3D-QSAR models. 41 2.RESULTS AND DISCUSSION Therefore, the first task identified was the development of a novel MIF discretization algorithm, which we called AMANDA. The details of this part of our work were described in publication 1. The new algorithm was developed in order to improve the node selections carried out by the original GRIND algorithm implemented in ALMOND. In response to the problems related to the selection of a fixed number of nodes, AMANDA is able to correct the number of nodes selected automatically for each compound analyzed. This solves two major problems of the original algorithm: to select nodes for all the interaction regions (the original algorithm selected a fixed number of points and sometimes they were not enough for representing all the interactions) and to avoid selecting nodes where interactions are not present (the fixed number of nodes should be always selected by the original algorithm independently whether they represented or not interactions). The quality of the results obtained by this algorithm was tested using two methods: measuring the significance of the hot spots extracted and checking its relevance in 3DQSAR models. In order to measure the significance, the results of the hot spot selection were compared with real receptor atoms in a large collection of ligand-receptor complexes. The comparison was carried out automatically and quantified in terms of sensitivity and specificity, by means of ad hoc developed software. The analysis was tackled for comparing the hot spots obtained with standard algorithms, ALMOND algorithm and AMANDA, obtaining quite positive results. On the other hand, a comparison, based on already published QSAR applications, was also carried out, obtaining an improvement in the quality of the results as well. In addition, the improvement in computational speed was also evaluated, obtaining a huge improvement of around 500 times. The improvements in the quality of description (especially for series containing highly dissimilar compounds) and the increase in the speed of the algorithm allowed considering the application of the new GRIND, the so-called GRIND-2, in other fields of drug discovery. In particular, we were interested in testing the suitability of GRIND-2 derived principal properties for applications requiring the description of the molecular similarity, like the ligand-based Virtual Screening. This part of the work is fully described in publication 2. Despite of the application of the GRIND descriptors in Virtual Screening was not new, the suitability of GRIND derived principal properties for the description of molecular similarity was never validated systematically. The speed increment obtained by GRIND-2 allows generating molecular descriptors for millions of compounds in few days and the application of 42 2.RESULTS AND DISCUSSION PCA method allows summarizing all the information in a few principal properties. In order to evaluate the quality of the description, a standard and well-known method to measure the molecular similarity was used: Virtual Screening (VS). In the study, the evaluation of the performance of the principal properties was carried out for several databases, obtaining values for standard metrics used in Virtual Screening that are at the same level as the state-of-the-art methods. These results demonstrate the suitability of the principal properties for describing the molecular similarity despite of 3D descriptors as GRIND-2 should include some degree of novelty in the extracted results that cannot be evaluated using the present VS metrics. Furthermore, studies in order to determine the optimal number of PCA components used for describing the chemical space were carried out, obtaining as conclusion that the optimum value must be around the number of properties that explains over 70% and 80% of the total variance. Finally, a successful evaluation of the stability of the scores spaces was also obtained by means of the comparison of original and projected scores for different databases. The next task identified as needed for the improvement of GRIND was to develop encoding algorithms alternative to MACC. These were described in publication 3 (manuscript draft). A novel algorithm, socalled Consistently Large Auto and Cross-Correlograms (CLACC), was developed in order to improve the interpretability of the GRIND in QSAR studies and remove the inconsistence of the results detected in MACC. MACC algorithm selects the representative of each variable for every molecule taking into account only the value of the highest energy product of each molecule. On the contrary, the CLACC algorithm aims to introduce consistency in the choice, by analyzing if the node couples picked for the compounds j represent the same information than the node couples extracted for the ith compound (for every i ≠ j in the series). A prerequisite for this selection is to define a method, not alignment-dependent, which scores if two node couples extracted for two structurally related compounds represent or not the same information. In CLACC this evaluation is carried out by comparing the hot spot “landscape” obtained from such nodes; in series of structurally related compounds, similar node couples can be recognized, since based on this comparison, the rest of the regions show a relatively similar spatial distribution. In CLACC this idea is applied to generate a feature-based structural alignment of the compounds, which is valuable on its own for aligning the compounds. Afterwards, distance criteria are used for 43 2.RESULTS AND DISCUSSION picking node couples which are consistent for all the compounds within the series. The quality of the CLACC method was validated by comparing the 3DQSAR models obtained using CLACC and MACC. The results exhibit a significant improvement of the model interpretability. In particular, when the 3D-QSAR models were obtained for series of compounds for which the ligand-protein complexes structures are known, the results of CLACC show a much clearer matching than MACC with recognizable receptor elements. Furthermore, the predictive quality of the models is also improved. With respect to the algorithm implementation, it is relevant to highlight the importance of the implementation of a fast clustering algorithm for identifying consistent variables in a reasonable period of time. Finally, all these high-performance algorithms and applications were implemented into a novel piece of software, Pentacle, following the aforementioned spiral model of development and GUI development principles. An extended discussion of the program can be found in publication 4 (manuscript draft). All the previous developed algorithms need to be implemented into a software tool which carry out the computations and presents the results. Our intention was to develop a reliable and user-friendly application that can be used as a model of development for future applications in drug discovery. In addition, Pentacle was conceived to be commercial software, adding new requirement in terms of quality and portability among the most popular hardware platforms. We adopted a spiral model of software engineering, for considering it the most adapted to the peculiarities of the scientific software: continuous methodology modifications and addition of new features. The requirements of code portability were addressed by using the Qt programming framework (97). A lot of attention was also paid to the user interface, developing two different ones: an elaborated GUI and a command line interface. Pentacle should be an integrated tool, which the user can use to compute and handle GRIND-2 for many diverse tasks. We selected these tasks to be the directing principle of the GUI design and, as a result, we organized the Pentacle main window into different tabs, each one assigned to a different task and containing all the graphics, data and widgets required for the user to work, with independence of other tabs. The entire GUI was built for allowing three different levels of use: toolbox, regular and advanced. In the toolbox level, the program applies many default settings and the user can run a 44 2.RESULTS AND DISCUSSION GRIND-2 and use the descriptors for building QSAR models pressing only the buttons of the toolbox, from left to right. In the regular use, more advanced users can tune-up the program settings to adapt the computations to the characteristics of the series, in a more interactive mode of use. The advanced level allows users with a deep understanding of the method to set up many adjustable parameters and to customize the AMANDA, MACC and CLACC algorithms. A comprehensive command line interface was also implemented, for allowing the integration of Pentacle into automatic computation and results handling protocols. Pentacle includes other advanced features: the use of “snapshots” for storing and retrieving the projects at any time, a full inter-system portability of the results and new visualization and wizards tools. In spite of our intentions and of the large effort devoted to the development, the quality, reliability and user-friendly characteristics of any software can only be credibly assessed by typical users in real world applications. Currently, Pentacle is being tested by a selected panel of users and the feedback will be used to further improve the software. 45 3.PUBLICATIONS 47 PUBLICATION 1 Durán A, Martínez GC, Pastor M. Development and validation of AMANDA, a new algorithm for selecting highly relevant regions in Molecular Interaction Fields. J Chem Inf Model. 2008 Sep;48(9):1813-23. PUBLICATION 2 Durán A, Zamora I, Pastor M. Suitability of GRIND-based principal properties for the description of molecular similarity and ligand-based virtual screening. J Chem Inf Model. 2009 Sep;49(9):2129-38. 3.PUBLICATIONS PUBLICATION 3 Consistently Large Auto and Cross Correlation (CLACC): a novel algorithm for encoding relevant molecular interaction fields regions into alignment-independent descriptors Ángel Durán, Laura López and Manuel Pastor (manuscript draft) 75 3.PUBLICATIONS Consistently Large Auto and Cross Correlation (CLACC): a novel algorithm for encoding relevant molecular interaction fields regions into alignment-independent descriptors Ángel Durán, Laura López and Manuel Pastor Research Unit on Biomedical Informatics (GRIB), IMIM, Universitat Pompeu Fabra, Dr. Aiguader 88, E-08003 Barcelona, Spain. The usefulness of Molecular Interaction Fields (MIF) as molecular descriptors (MD) is limited by the need of aligning the structures. MIFbased alignment-independent descriptors like the Grid-INdependent Descriptors (GRIND) are able to capture much of the original information and produce reasonably good results in many applications. However, the mathematical transform applied to the MIF to obtain alignment independency (Maximum Auto and Cross Correlation, MACC) has some limitations and does not guarantee that variables represent exactly the same information in every compound of the series. Here we present an enhanced version of MACC, called Consistently Large Auto and Cross Correlation (CLACC), which solves the problem of the variable consistency. The method can be used for replacing MACC for the computation of GRIND on series of structurally related compounds, improving the quality of the 3D QSAR models obtained. The advantages of CLACC over MACC are presented by comparing the models obtained with both methods from diverse points of view, demonstrating the large superiority of CLACC over MACC both in terms of predictive ability and interpretability. INTRODUCTION Virtually every computational method used in drug discovery requires, as a preliminary step, converting molecules into numbers, often called molecular descriptors (MD). The relevance and accuracy of such description conditions the quality of the results that the method can yield and therefore, much attention has been paid in the last decades to the development of many different MD, suitable for specific purposes. Among the vast collection of MD available (1), those based on Molecular Interaction Fields (MIF) have gained a reputation of being highly relevant for drug discovery applications (2). The application of MIF in drug discovery started with the pioneering work of P. Goodford (3), since then, many other MIF-like and MIF-derived MD have been developed and applied to diverse tasks. Among these, MIF are one of the basis of 3D Quantitative Structure-Activity Relationships (3D QSAR) methods (4) like the popular CoMFA (5) and COMSIA (6) methods. The direct use of MIF as MD in tasks involving the comparison of several compounds has the inconvenience that all the structures must be structurally aligned. Only then, the MIF variables represent comparable information. In many cases, this process 77 3.PUBLICATIONS is difficult and time consuming. For this reason, several alignment-independent MIF-based descriptors have been proposed. Most of them are based on the application of a mathematical transform which changes the system of reference, from absolute xyz to some sort of internal coordinates. This is the case of the GRid-Independent Descriptors (GRIND) (7). The GRIND were developed as alignment-independent descriptors specifically for the purpose of obtaining 3D QSAR models without the need to align the compounds. An exhaustive review of the methods can be found elsewhere (2) but in few words, the method computes a set of MIF (typically four, using Hydrogen Bond Acceptor, Hydrogen Bond Donor, Hydrophobic and Shape probes) and extracts from them a series of representative points of the space (nodes), so-called “hot spots”. The relative position of the “hot spots” is encoded using the Maximum Auto and Cross Correlation (MACC) method which yields a vector of values called “correlograms”. Every position in this vector represents a distance range or “bin” and the value is the product of the field energies of a couple of nodes, separated by this distance. Often, a MIF contains many node couples separated by a certain distance; in these cases, the MACC algorithm scores the node couples according to the product of their interaction energies and the ones with a higher value, representing the most intense interactions, are picked. The original GRIND, implementing the MACC algorithm, has been applied in numerous 3D QSAR applications, yielding good models (813) without the need of carrying out the structural alignment of the series. However, the attainment of an alignment-independent description is not free; the transform applied to the MIF is based on two assumptions: (i) for each 78 distance bin each compound has, as a maximum, a single couple of relevant hot spots; (ii) the couple of nodes selected for a distance, in a certain compound, represent the same structural couple of features for all the rest of the compounds in the series. Both assumptions are obviously a simplification and in many series, they proved to be wrong. As a consequence, a certain percentage of the GRIND variables are contaminated by two problems which we called confusion and inconsistency. The first problem (confusion) appears when the GRIND are used for comparing diverse compounds, for example in a QSAR model. In most cases, the compounds present in the series share the most important pharmacophoric features and the couples of regions described by a GRIND variable in all the compounds are equivalent. However, as it is illustrated in Figure 1a this is not necessarily true for all series, in particular when the compounds do not belong to congeneric series or when the structures contain diverse couples of features separated by similar distances. In typical applications the problem is mitigated by the simultaneous use of multiple correlograms; two couples of regions can share the same distances, but their distances with respect to other regions will be different and therefore any confusion present in a correlogram is broken in the rest. As a consequence, confusion has no large impact in the quality of the regression models, even if they became much more complex to interpret and understand. The second problem (inconsistency) appears when a single compound contains more than one couple of structural features separated by the same distance, as is illustrated in Figure 1b. In these cases, the choice of one or another by the MACC is arbitrary, often based in minute differences in the MIF products and the 3.PUBLICATIONS observation of a single correlogram does not reflect anyhow the simultaneous presence of both regions. The inconsistency of the GRIND can seriously hamper the predictive ability and the interpretability of GRIND derived QSAR models. The problem is particularly evident when the molecules under study belong to the same structural family, since the visual inspection of the same variable in diverse compounds can identify completely unrelated structural features (see Figure1b), thus making the model interpretation impossible and discouraging the use of the GRIND. Therefore, we decided to develop a new hot spot encoding algorithm, aiming to replace the MACC in GRIND applications in which the aforementioned problems are detrimental for the quality of the results. In particular, for the aforementioned reasons, we wanted to improve the quality of the QSAR models obtained for series of structurally related compounds, improving their predictive ability and interpretability. study. CLACC starts by selecting several candidate node couples for every member of the series, building a pool from which the algorithm picks the ones which are more likely to represent equivalent regions for all the compounds in the series. Hence, the MD obtained are much more consistent and the quality of the QSAR models is largely improved, both in terms of predictive ability and interpretability. The method has been validated by computing CLACC on many several series, and comparing the results obtained with those obtained with GRIND (some of which have been previously published). The results of such comparison will be summarized here, including an in-depth comparison of the results obtained for a few series which will illustrate the advantages of using CLACC over MACC in terms of the interpretability of the results. This work is part of the updating of the original GRIND, already started with the development of AMANDA (14) a novel MIF discretization algorithm, aiming to obtain a new generation of alignment-independent MD (GRIND-2), with improved performance over the original version. METHODS Figure 1. Example of confusion (a) and inconsistency (b) MACC problems. Here we will introduce a novel encoding methodology named Consistently Large Auto and Cross Correlation (CLACC) which we propose as an alternative to MACC in series of structurally related compounds. Unlike the MACC, the selection of node couples is not carried out compoundwise, but is based on an analysis of the compounds present of the series under CLACC method. The CLACC method involves three different steps: candidate selection, alignment and consolidation. Here we included a detailed description of these steps, but the complexity of the procedure forced us to omit many computational details in order to obtain an understandable description. These can be obtained consulting the flow charts provided as Supplementary Material. Candidate selection. For every compound in the series and every distance bin, the CLACC algorithm preselects the n candidates node couples with the highest product of MIF energy 79 3.PUBLICATIONS values. This part of the algorithm is identical to MACC except for the fact that the algorithm does not select the single highest value but the n highest. Alignment step. Once all the compounds in the series have been processed and we have a set of n candidate node couples for representing every distance we need to apply a method that ensure the consistency of the information represented by every variable. The basic hypothesis is that in most QSAR series, all the active compounds share a few pharmacophoric features. This step aims to recognize some highly common features and to use them for carrying out a feature-based structural alignment which serves as the basis for the next step. CLACC works by computing for each node in the pool a vector describing the distribution, in terms of distance to this node, of all the hot spots extracted for all the MIF. This vector represents the “MIF landscape” from the node point of view, which is invariant to the xyz coordinates of the node and which allow the comparison with other nodes in diverse compounds. As far as the diverse compounds contain roughly the same features, these vectors obtained from equivalent positions will exhibit certain similarities. Technically, the vectors are computed using a method similar to the anchor-GRIND (15), but representing only the presence or absence of an interaction at the distance of interest without noting the value of the energy product and using wider distance bins. The final vector (called “viewpoint”) is a fingerprint-like array of binary values where a value of 1 indicates the presence of an interaction at a certain distance and a value of 0 its absence. Once all the viewpoints are computed, CLACC performs the search of a short-list of node couples showing a high degree of similarity for most of the compounds in the dataset. This task is 80 carried out by applying an agglomerative clustering method to every variable, using the pool of candidate node couples. The similarity of two node couples is scored in terms of the differences between the viewpoints of their respective nodes. Then the clustering method progresses until the algorithm detects that a cluster contains a representative for every compound in the series (and then, this variable is included in the highly consistent shortlist) or when the distances computed are too large (and then the variable is discarded). Once the short-list of variables is compiled, a final list is extracted by prioritizing the variables which allows an easier assignment of a single node couple for every compound in the series (basically, those in which the last computed cluster contains fewer candidates for each compound). The final list contains a list of anchor node couples which are then used to align all the compounds. The alignment algorithm is iterative and uses the anchor node couples in one compound to define a provisional alignment template, on top of which we align a second molecule using orthogonal procrustes analysis (16). The coordinates of the anchor nodes are averaged to obtain a new alignment template which is used to align the third molecule and so forth until all the compounds are aligned. Consolidation step. Once all the molecules have been superimposed, the consistency of the node couple candidates for each variable can be assessed simply by measuring which ones are closer in space. In this step, we applied again agglomerative clustering for selecting the best node couple candidate for each variable. The method works much like in the previous step, but now the selection is based on distances, which makes the computation simpler and faster. Also, in this case, the goal is to select the best node couple (the 3.PUBLICATIONS most consistent for all the compounds) for every variable. Sometimes, not one of the candidates node couples extracted for a certain compounds can be considered consistent with the rest of the compounds, probably because this compound lacks this structural feature. In this case, the method can be configured to work in two alternative ways: by selecting the most likely candidate or by removing the whole variable from the analysis. This last alternative has the advantage of producing only MD which are guaranteed to represent consistent information for all the compounds in the series. Data set. Eleven representative series have been selected for validating the CLACC methodology and evaluating the quality of the QSAR models obtained with CLACC methodology. Eight of these series (labeled as 5HT, GPb, steroids, cocaine, quinoxalines, plasmepsin, xanthines and elastase in Table 1) have been previously published in 3D QSAR studies involving other methodologies, thus allowing comparison between the performance of our algorithm with other state-of-the-art methods. Two of them (FXa and TACE in Table 1) correspond to series for which the bioactive conformation of at least one of the compounds has been determined experimentally using X-ray crystallography. These series are particularly useful to show how the models obtained using CLACC are easier to interpret, and how the structural interpretation match closely the information provided by the receptor structure. Finally, one of the series (A3 in Table 1) was used to carry out a detailed comparison between two alternative uses of CLACC algorithm: using the built-in structural alignment or using pre-aligned molecules. The compounds of these series were compiled from (17) with the restrictions of being actives (pKi value higher than 6) and sharing the common scaffold shown in Scheme 1. The size of the series, a short description and the original references are reported in Table 1. Scheme 1. Scaffold shared by all the structures of the A3 series. H N N N N O N N NH2 NH2 O GRIND computation. The GRIND calculations carried out for the validation of the CLACC methodology and described here make use of the AMANDA algorithm for discretizing the MIF. This novel algorithm offers several advantages in terms of speed and quality in front of the original GRIND. All the computations were carried out using the program Pentacle (24) with default settings and probes (DRY, O, N1 and TIP). 3D QSAR analysis. The 3D QSAR models were built using the chemometric tools incorporated in the program Pentacle. The quality of the 3D QSAR models was evaluated in terms of predictive ability, using Leave-One-Out (LOO) cross validation, and also in terms of model interpretability. For this last aspect, the GRIND were visualized using the interactive 3D-graphical tools included in Pentacle. This software allows the simultaneous representation of molecules not involved in the computation, which makes possible the representation of the binding site for these series in which its structure is available, thus allowing to evaluate the 81 3.PUBLICATIONS Table 1. Series used in this study. Name Plasmepsin quinoxalines xanthines elastase A3 5HT cocaine GPb steroids FXa TACE Description Plasmodium falciparum Plasmepsin II Inhibitors Antagonists for human adenosine A1 Antagonists for human adenosine A1 Human Neutrophil Elastase Inhibitors Antagonist for human adenosine A3 Butyrophenones with Serotoninergic (5-HT2A) Affinites GBR compounds inhibitors of [125I]RTI-55 binding to human DAT Glucose Analogue Inhibitors of the Glycogen Phosphorylase Steroid Binding to the Corticosteroid-Binding Globulin Receptor Coagulation Factor Xa inhibitors Inhibitors of TFN-a convertase correspondence between the regions highlighted by the models and actual residues of the binding site. In all the models, a mild variable selection (a maximum of two FFD runs (25)) was applied, using the default parameters implemented in Pentacle (2LV, LOO cross-validation, retain uncertain variables). External structural alignment. In order to validate the quality of the feature-based alignment provided by CLACC, some of the series were aligned using external alignment tools. In series FXa and TACE the structure of the crystallized ligand was used as template, while in series A3 the compound labeled as 140 (17) was used as a template. In all instances, the alignment was carried out running the script “fragment_superpose.svl” provided by the Chemical Computing Group (CCG), Inc.. This script is based on the superimposition of a common substructure core define for all the ligands. The alignment of all the compounds in the series with the template required multiple runs of the script, as well as a final manual readjustment. All the process was done using MOE software (26). 82 Compounds 16 21 18 40 20 25 Reference (18) (19) (18) (20) (17) (7) 56 (21) 10 (7) 31 (7) 26 19 (22) (23) RESULTS AND DISCUSSION We have developed a novel algorithm which can be used to replace the MACC in GRIND computations in series of compounds showing a certain structural similarity. The basic hypothesis in CLACC is that most series used in QSAR share some common pharmacophoric features, either because they belong to the same chemical family, share a common scaffold or have been selected to interact with the same receptor. If this is true, the algorithm tries to find the most common features and performs a feature-based alignment. Once the compounds were aligned, the algorithm selects, from a pool of candidates, node couples based on the series consistency and not only on the field product (unlike MACC). From a computational point of view, the algorithm includes three sequential steps: candidate selection, alignment and consolidation. The first step involves the analysis of a single compound, much like MACC, while the alignment and consolidation steps can be carried out only after all the compounds in the series have been processed (e.g. Figure 2). The method works as follows: first, for each 3.PUBLICATIONS compound in the series, the algorithm pre-selects several candidate node couples, representing every distance bin (candidate selection step). Once all the compounds are processed, the method extracts a small subset of node couples showing a high degree of consistency between all the compounds in the series, and uses them to carry out a featurebased spatial alignment (alignment step). Then, the method selects for every distance bin, the candidate node couple which shows a higher degree of consistency within the series (consolidation step). In the alignment step, the consistency between the candidate node couple distances was based on the comparison of the MIF hot spots “landscape”, while in the consolidation step two node couples are considered consistent simply when both nodes are close in the space. In the particular case in which the compounds were structurally superimposed (e.g. series of ligand-receptor complexes obtained either experimentally or computationally), the alignment step can be skipped. In any other case, the algorithm produces as a by-product a feature-based superimposition of the compounds, which can be very useful for the model interpretation. A detailed description of every method step, as well Figure 2. Results of the CLACC algorithm in selecting a variable for the 5HT series. as of the consistency criteria used in the alignment step can be found in the Methods section. At the end, the CLACC method yields a set of correlograms, exactly like the ones produced by MACC. Indeed, in many cases the variables selected are similar to those extracted by the MACC method, since the criteria of the maximum energy product is latent in the algorithm, and is used to populate the pool of candidates in the first step. Therefore, the main differences are restricted to the variables introducing the undesirable confusion and inconsistence problems described above. In either case, CLACC tries to solve the problem by picking the node couples representing the same structural features in the maximum possible number of compounds. However, in most QSAR series, some of the compounds lack a certain structural feature found in other structures. When the CLACC algorithm detects an inconsistency in a certain variable (the information represented in some molecules is diverse from the information represented in the rest of the series) two alternatives are possible: preserving the non-consistent variables (soft), selecting in that case those with the highest energy (MACC default behavior), or removing them from the compounds in which they represent a different information. The first alternative is more conservative and represents an intermediate solution between the MACC and the strictest CLACC algorithm. The second alternative (strict) produces a cleaner description of the series, containing only consistent information for all the series, even if this option leads to remove a considerable amount of information, in some cases. The differences in the results obtained using the soft and the strict alternatives can be easily appreciated in Figure 3. CLACC Validation. In order to validate the new algorithm, it was applied to several series for obtaining 3D QSAR models. The effect of the 83 3.PUBLICATIONS Figure 3. Comparison between the selected variables obtained by CLACC when non-consistent variables are kept (soft) (a) and removed (strict) (b) for cocaine (1) and steroids (2) series. application of CLACC on the models must be evaluated from two different points of view: the effect of CLACC on their predictive ability and on the interpretability of the results. With respect to the effect on CLACC on the predictive ability, we ran a first validation batch using four series, labeled as plasmepsin, quinoxalines, xanthines and elastase (see Methods for details). For every series, we obtained QSAR models using MACC, soft CLACC (retaining non-consistent values) and strict CLACC (removing non-consistent values). The results were listed in Table 2. In all instances, the CLACC algorithm performs better than the MACC method both in terms of fitting (r2) and of predictive ability (LOO q2). The differences are not large, but significant. Consistently, the strict CLACC produces better results than the soft CLACC. These results are 84 encouraging and seem to indicate that the CLACC is alleviating to some extent the aforementioned problems of GRIND consistency. CLACC derived models in general and strict CLACC models in particular are more predictive because every variable represents the same piece of information for every compound in the series. Therefore, predictions for new compounds are more reliable. As stated before, the CLACC application includes an alignment step and a consolidation step. In order to gain further understanding of the CLACC effect on the quality of the models we decided to run additional tests to evaluate both steps separately. With respect to the alignment step we ran CLACC on the series labeled as A3 in Table 1 twice; once running the full algorithm and once pre-aligning the structures with an external tool (see Methods) and skipping the alignment step. The visual inspection of the aligned 3.PUBLICATIONS Table 2. QSAR model results for the MACC and whole CLACC methods (alignment plus consolidation). CLACC MACC 2 2 r q plasmepsin 0.99 quinoxalines soft LV 2 r q 0.78 5 0.99 0.86 0.60 3 xanthines 0.96 0.89 elastase 0.70 0.48 strict LV 2 r q2 0.81 5 1.00 0.88 5 0.90 0.67 3 0.95 0.77 3 2 0.97 0.90 2 0.98 0.93 2 2 0.74 0.54 2 0.79 0.55 1 structures using CLACC and MOE (see Figure 4) shows clearly that our algorithm works rather well, producing results that are comparable with those obtained with MOE, and the common scaffold is aligned as expected. Obviously, the CLACC algorithm does not modify the conformations of the molecules and therefore the method cannot be expected to yield good results when the compounds have not been modeled in their bioactive conformations. In order to obtain a quantification of the effect of the alignment on the model we compared the predictive ability of the QSAR models obtained with both alignment methods. The results (Table 3) show that the both methods perform equally well and produce similar LOO q2 values. 2 LV For validating the effect of the consolidation step we carried out an external alignment of four series (5HT, cocaine, GPb and steroids), as described in the Method section, and compared the predictive ability of the models obtained using the CLACC and MACC methodology. The results shown in Table 4 indicate that the CLACC methodology produces slightly better results, in particular when the strict option is applied. The only exception is the 5HT series, where the strict option yields slightly worse results. Remarkably, this 5HT series has the peculiarity of describing compounds which are suspected to bind in two alternative orientations (27). We can speculate that in this particular case some of the Figure 4. Examples of alignment obtained with CLACC (a) and MOE (b) on the A3 series. 85 3.PUBLICATIONS Table 3. Comparison of the values of CLACC obtained using external alignment and the method implemented in CLACC. CLACC Alignment soft r2 A3 q2 External Alignment strict LV 0.88 0.73 2 r2 q2 soft r2 LV 0.99 0.84 4 q2 0.88 0.73 strict r2 LV 2 q2 1.00 0.89 LV 5 Table 4. Comparison of the 3D QSAR results obtained with the different methodologies. CLACC MACC 2 2 r q 5HT 0.89 cocaine soft LV 2 r q 0.82 2 0.90 0.89 0.58 5 GPb 0.92 0.72 steroids 0.86 0.78 strict LV 2 r q2 LV 0.82 2 0.86 0.75 2 0.91 0.60 4 0.75 0.65 2 2 0.93 0.70 2 1.00 0.90 3 2 0.88 0.81 2 0.93 0.87 2 non-consistent variables are actually describing the ability of the compound to bind in the opposite orientation and therefore, removing these variables are decreasing the predictive power of the model. Interpretability improvements. The interpretation of GRIND derived QSAR model is usually carried out by identifying the variables with largest PLS coefficients and associating these variables with structural features present in active compounds and absent in inactive compounds (for variables with positive coefficients) and vice versa (for variables with negative coefficients). This process requires some graphical 2 tools that allow visualization of the couple of nodes chosen, in a certain object, for assigning a value to the variable under study. Even if software like ALMOND or Pentacle incorporate such tools, the process is not easy for MACC derived GRIND, especially when the compounds are not aligned and the variable presents inconsistencies. In these cases, the node couples shown for diverse compounds are scattered in different regions of the space, making hard to link them to any common ligand feature. On the other hand, CLACC derived GRIND-2 are built using feature-aligned structures, and the interpretation shows the node couples Table 5. Quality of the models obtained using MACC, soft CLACC and strict CLACC for the FXa and TACE series. CLACC MACC 86 soft strict r2 q2 LV r2 q2 LV r2 q2 LV FXa 0.62 0.27 2 0.68 0.38 2 0.95 0.74 3 TACE 0.78 0.55 2 0.95 0.62 3 0.91 0.65 3 3.PUBLICATIONS in the same region of the space for every compound in the series. Furthermore, most inconsistencies are removed (in particular in strict CLACC), guaranteeing that every variable represents only consistent information. As a consequence, the interpretation of CLACC is far simpler and less ambiguous than the MACC. Another aspect of the interpretability is related with the degree of correspondence between the MIF regions identified by the model and actual atoms of the binding site. In other words; is our interpretation depicting a realistic representation of the binding model? In order to assess whether this is true or not and the improvements introduced by CLACC we ran our method on a last test set, containing the series FXa and TACE. In both series, the structure of the ligand-receptor complex for one of the compounds has been determined experimentally by X-ray crystallography and is available. This structure has been used to align the rest of the structures in approximate bioactive conformations. Hence, for this series we can present the GRIND-2 variables superimposed on the receptor model and check the correspondence between the selected node couples and groups of the binding site. Before entering into details of the interpretation it must be mentioned that the quality of the models obtained using CLACC was rather good, and compared very favorably with MACC derived models, following the aforementioned trends. These results are summarized in Table 5. FXa series. The FXa series contains a series of 26 inhibitors of Factor Xa, published recently by Qiao et. al. (22), including some representatives with binding affinities in the subnanomolar range. The best model was obtained using strict CLACC (r2: 0.95, LOO q2: 0.74). The interpretation of this model, by representing variables with the highest PLS coefficients, like the DRYDRY variable shown in Figure 5a, highlights some of the regions already identified in the original article as determinant for the activity, such as the interactions with an hydrophobic patch at the bottom of the S1 pocket, and the interaction with the edges of Phe174 and Tyr99 in the S4 pocket (see Figure 5a). The detailed interpretation of the model is beyond the scope of this work, but it should be noted how the variable represented in Figure 5a represents the same kind of interaction for all the compounds in the series, and how the interpretation is straightforward and requires no effort from the side of the researcher. With respect to the MACC model, Figure 5b shows the variable with the highest coefficient in the DRYDRY correlogram. In a certain way, this variable represents the same information (two hydrophobic regions separated by a certain distance) described by the CLACC variable, but in this case the choice of the nodes was different for every compound. The first hydrophobic regions, in the S1 pocket, are more diffuse, but still identifiable. On the contrary, the other hydrophobic regions are not coincident with the S4 pocket except for a handful of compounds and it is not possible to point out defined hydrophobic residues originating these regions, like in the case of the CLACC model. TACE series. The TACE series includes 19 potent inhibitors of TFN-a convertase reported by Guo et al. (23). Like in the previous series, the best model was obtained using strict CLACC (r2: 0.91, LOO q2: 0.65), even if in this case the quality is comparable with the model obtained using soft CLACC. As in the previous case we have represented one the variables with the highest PLS 87 3.PUBLICATIONS Figure 5. Important DRY-DRY variables in the models obtained for the FXa series, represented on top of all the compounds of the series and a few selected residues of the receptor binding site (a) using CLACC, linking the S1 pocket and the region created by Phe174 and Tyr99 at the S4 hydrophobic pocket (b) using MACC, linking the S1 pocket and scattered hydrophobic regions around the ligands. See text for details. coefficients for both the CLACC (6a) and MACC (6b) models. Figure 6a shows a N1-DRY variable linking a hydrophobic region located at the S1’/S3’, in front of the quinoline groups and a polar region located in the surrounding of Thr347. Other variables (not shown) also highlight the hydrophobic region in front of His405, reported in (23) as important for its interaction with the middle phenyl ring present in the ligand structure. It can be seen, as in the prior series, that the regions highlighted by the most important variables overlap relevant atoms of the binding site, thus demonstrating that the model interpretation can provide realistic information about of the receptor structure, always within the limitations of the QSAR formalism. In the MACC mode, the DRY-N1 correlogram does not show positive coefficients. Figure 6b represents the variable with highest coefficient, belonging to the O-N1 correlogram. In this case, one of the ends of the variable is consistently representing the hydrogen bond donor Figure 6. Important variables in the models obtained for the TACE series, represented on top of all the compounds of the series and a few selected residues of the receptor binding site (a) using CLACC, variables from DRY-N1 correlogram, linking the S1’/S3’ pocket and a polar region near Thr347 (b) using MACC, variables from the O-N1 correlogram. See text for details. 88 3.PUBLICATIONS region in front of the quinoline nitrogen, but the other end links different hydrogen bond acceptor regions scattered around the entire binding site, not allowing a clear interpretation. All these examples show the large improvement in the interpretability of the QSAR models introduced by the use of CLACC methodology with respect to the MACC models. CLACC models are simpler to understand, and show a clearer correspondence between the regions highlighted by the model and actual regions of the binding site. CONCLUSIONS We have developed a novel encoding algorithm, suitable for replacing the MACC algorithm for the computation of GRIND, which solves or mitigates some of the most important drawbacks reported for these descriptors. The method is applicable for series of compounds showing some degree of structural similarity, like the series used in most QSAR studies. As its predecessor, the CLACC algorithm produces fully alignment-independent descriptors, but during the computation procedure, the compounds are aligned on the basis of a few pharmacophoric features identified automatically by the method. The method is much more computationally intensive than MACC, but it is suitable for being applied in series of the size used typically in QSAR, producing results in a reasonable amount of time. The CLACC algorithm has been validated here from diverse points of view. Its application for computing GRIND produced more predictive QSAR models, in terms of higher crossvalidated q2. The models are much easier to interpret and the results, in terms of the regions highlighted by the model, show a nice correspondence with actual regions present in the receptor binding site, as it was demonstrated by studying a few crystallographic complexes. All in all, the combination of the AMANDA-CLACC algorithms can be considered to conform together a new generation of alignment independent descriptors, the so-called GRIND-2, solving most of the drawbacks reported in the original GRIND. To conclude, it is worth stressing that GRIND-2, like its predecessor, can generate alignment-independent descriptors, but the results are still dependent on the conformations of the structures used as a starting point. The novel improvements incorporated into the encoding algorithm and described here, do not solve any problem linked to the use of non-representative conformations. However, the GRIND-2 are relative robust to small changes in the conformation of the structures and, for 3D QSAR applications, they can provide suitable MD starting from any conformation as far as these were generated in a consistent way. Moreover, the bioactive conformation can be approached or guessed using the classic active analogue approach on a set of active compounds described by GRIND2. ACKNOWLEDGMENT We thank Molecular Discovery Ltd. for supporting this research, including a grant to one of us (AD). The project also received partial funding from the Spanish Ministerio de Educación y Ciencia (project SAF200508025-C03) and the Instituto de Salud Carlos III (Red HERACLES RD06/0009). REFERENCES AND NOTES (1) Todeschini R, Consonni V. Handbook of Molecular Descriptors. Wenheim: Wiley-VCH; 2000. 89 3.PUBLICATIONS (2) Molecular Interaction Fields. Applications in Drug Discovery and ADME Prediciton. Weinheim: Wiley-VCH Verlag GmbH &Co.; 2006. )bridged 2-aminobenzonitriles inhibiting HIV-1 reverse transcriptase. J.Med.Chem. 2005;48(11):3756-3767. (3) Goodford PJ. A computational procedure for determining energetically favorable binding sites on biologically important macromolecules. J.Med.Chem. 1985;28(7):849-857. (14) Duran A, Martinez GC, Pastor M. Development and validation of AMANDA, a new algorithm for selecting highly relevant regions in Molecular Interaction Fields. J.Chem.Inf.Model. 2008;48(9):1813-1823. (4) 3D QSAR in Drug Design. Theory Methods and Applications. Leiden: ESCOM Science Publishers; 1993. (5) Cramer RD, Patterson DE, Bunce JD. Comparative molecular field analysis (CoMFA). 1. Effect of shape on binding of steroids to carrier proteins. J.Am..Chem. Soc. 1998;110(18):59595967. (6) Klebe G, Abraham U, Mietzner T. Molecular similarity indices in a comparative analysis (CoMSIA) of drug molecules to correlate and predict their biological activity. J.Med.Chem. 1994;37(24):4130-4146. (7) Pastor M, Cruciani G, McLay I, Pickett S, Clementi S. GRid-INdependent descriptors (GRIND): a novel class of alignment-independent three-dimensional molecular descriptors. J.Med.Chem. 2000;43(17):3233-3243. (8) Li Q, Jorgensen FS, Oprea T, Brunak S, Taboureau O. hERG Classification Model Based on a Combination of Support Vector Machine Method and GRIND Descriptors. Mol.Pharmaceutics 2008;5(1):117-127. (9) Carosati E, Lemoine H, Spogli R, Grittner D, Mannhold R, Tabarrini O, et al. Binding studies and GRIND/ALMOND-based 3D QSAR analysis of benzothiazine type KATP-channel openers. Bioorg.Med.Chem. 2005;13(19):5581-5591. (10) Ermondi G, Caron G. GRIND-based 3DQSAR to predict inhibitory activity for similar enzymes, OSC and SHC. Eur.J.Med.Chem. 2008;43(7):1462-1468. (11) Kabeya LM, da Silva CHTP, Kanashiro A, Campos JM, Azzolini AECS, Polizello ACM, et al. Inhibition of immune complex-mediated neutrophil oxidative metabolism: A pharmacophore model for 3-phenylcoumarin derivatives using GRIND-based 3D-QSAR and 2D-QSAR procedures. Eur.J.Med.Chem. 2008;43(5):996-1007. (12) Larsen SB, Jorgensen FS, Olsen L. QSAR models for the human H+/peptide symporter, hPEPT1: Affinity prediction using alignmentindependent descriptors. J.Chem.Inf.Model. 2008;48(1):233-241. (13) Sciabola S, Carosati E, Baroni M, Mannhold R. Comparison of ligand-based and structure-based 3D-QSAR approaches: A case study on (aryl- 90 (15) Fontaine F, Pastor M, Zamora I, Sanz F. Anchor-GRIND: filling the gap between standard 3D QSAR and the GRid-INdependent descriptors. J.Med.Chem. 2005;48(7):2687-2694. (16) Ten Berge J. Orthogonal procrustes rotation for two or more matrices. Psychometrika 1977;42(2):267-276. (17) Moro S, Bacilieri M, Cacciari B, Spalluto G. Autocorrelation of molecular electrostatic potential surface properties combined with partial least squares analysis as new strategy for the prediction of the activity of human A(3) adenosine receptor antagonists. J.Med.Chem. 2005;48(18):5698-5704. (18) Fontaine F, Pastor M, Sanz F. Incorporating molecular shape into the alignment-free GridIndependent Descriptors. J.Med.Chem. 2004;47(11):2805-2815. (19) Martinez A, Gutierrez-de-Teran H, Brea J, Ravina E, Loza MI, Cadavid MI, et al. Synthesis, adenosine receptor binding and 3D-QSAR of 4substituted 2-(2'-furyl)-1,2,4-triazolo[1,5a]quinoxalines. Bioorg.Med.Chem. 2008;16(4):2103-2113. (20) Cuevas C, Pastor M, Perez C, Gago F. Comparative binding energy (COMBINE) analysis of human neutrophil elastase inhibition by pyridone-containing trifluoromethylketones. Comb.Chem.High Throughput Screen. 2001;4(8):627-642. (21) Benedetti P, Mannhold R, Cruciani G, Pastor M. GBR compounds and mepyramines as cocaine abuse therapeutics: Chemometric studies on selectivity using grid independent descriptors (GRIND). J.Med.Chem. 2002;45(8):1577-1584. (22) Qiao JX, Cheney DL, Alexander RS, Smallwood AM, King SR, He K, et al. Achieving structural diversity using the perpendicular conformation of alpha-substituted phenylcyclopropanes to mimic the bioactive conformation of ortho-substituted biphenyl P4 moieties: discovery of novel, highly potent inhibitors of Factor Xa. Bioorg.Med.Chem.Lett. 2008;18(14):4118-4123. (23) Guo Z, Orth P, Wong SC, Lavey BJ, Shih NY, Niu X, et al. Discovery of novel spirocyclopropyl hydroxamate and carboxylate 3.PUBLICATIONS compounds as TACE inhibitors. Bioorg.Med.Chem.Lett. 2009;19(1):54-57. (24) Pentacle, Version 1.0.4; Molecular Discovery Ltd.: Perugia, Italy; 2009. (25) Baroni M, Costantino G, Cruciani G, Riganelli D, Valigi R, Clementi S. Generating Optimal Linear PLS Estimations (GOLPE): An Advanced Chemometric Tool for Handling 3DQSAR Problems. Quant.Struct-Act.Rel. 1993;12(1):9-20. (26) MOE Molecular Operating Environment, Version 2008.10; Chemical Computing Group Inc.: Montreal, Canada; 2008. (27) Dezi C, Brea J, Alvarado M, Ravina E, Masaguer CF, Loza MI, et al. Multistructure 3DQSAR studies on a series of conformationally constrained butyrophenones docked into a new homology model of the 5-HT2A receptor. J.Med.Chem. 2007;50(14):3242-3255. 91 3.PUBLICATIONS SUPPLEMENTARY MATERIAL Flow chart of the whole CLACC algorithm. 93 3.PUBLICATIONS Flow chart of the clustering algorithms. 94 3.PUBLICATIONS PUBLICATION 4 Pentacle. Integrated software for computing and handling GRIND-2 alignment-independent descriptors Ángel Durán and Manuel Pastor (manuscript draft) 95 3.PUBLICATIONS Pentacle. Integrated software for computing and handling GRIND-2 alignment-independent descriptors Ángel Durán and Manuel Pastor Research Unit on Biomedical Informatics (GRIB), IMIM, Universitat Pompeu Fabra, Dr. Aiguader 88, E-08003 Barcelona, Spain. Novel computational chemistry methods are more useful when they are implemented in user-friendly and reliable software. We introduce Pentacle, a new software for computing and handling GRIND-2 alignment-independent descriptors, describing how it was developed, the software engineering development models and the user interface principles used for its design, with the aim that such information can be useful for the development of other drug discovery software. INTRODUCTION Today, the drug discovery process involves routinely the use of multiple computational tools, which are used for describing compounds and fragments, designing novel compounds and predicting their biological properties. In most of these tools, chemical structures must be translated into numbers which are commonly known as molecular descriptors (MD). MD provide an abstract representation of the molecule, translating certain characteristics into numbers with an interpretable meaning. Multiple MD have been published (1), adapted to many diverse purposes. Among these, descriptors based on Molecular Interaction Field (MIF) calculations have been extensively used in drug discovery (2), since they provide an accurate characterization of how small molecules can establish energetically favorable interaction with biological receptors. MIF are constituted by several thousand variables, each one representing the energy of interaction of a molecule with a chemical probe at a certain position of the space, and therefore, the information contained, even if highly valuable is too diluted to be used without transform. For this reason, different MIF-derived MD have been developed (e.g. VolSurf (3) and GRIND (4,5)). Their basic idea is to extract the most useful information present in the MIF, condensating it in fewer variables. In addition, most MIFderived MD allow to compare compounds without the need of an structural alignment. The GRIND are an example of successful MIF-derived, alignmentindependent MD. Initially, in 2000, they were designed only for QSAR applications, but it has been applied in many other fields like library design (6), binding site characterization (7), and Virtual Screening (VS) (8). In few words, the GRIND are obtained starting from a collection of Molecular Interaction Fields computed using diverse chemical probes, which were discretized by finding the more representative positions (hot spots). The relative position of these hot spots was encoded into a few arrays of values 97 3.PUBLICATIONS (correlograms), representing the product of energies of couples of hot spots located at certain distance ranges. One of the advantages of the GRIND is that every variable has a clear meaning: they represent the presence of a couple of nodes, separated by a certain distance range. Therefore, this variable can be visualized for every compound in the series, simply showing the couple of nodes selected during the GRIND computation. However, this visualization requires devoted software, able to store the coordinates of the nodes used during the computation and to represent them in 3D. The original GRIND method used ALMOND software (4) to generate the descriptors. ALMOND is an example of integrated software platform, in which the user can compute the MIF using the original P. Goodford GRID (9), generate the MD and build QSAR models using a set of integrated chemometric tools (PCA and PLS). The software contains visualization tools which allow representing the GRIND as lines linking couples of nodes, as well as the results obtained with the built-in tools. In this work we introduce Pentacle, a software aiming to replace ALMOND as the reference software platform for computing and manipulating GRIND descriptors. It includes tools for the application of the GRIND in 3D QSAR studies, and support for the application of GRIND derived principal properties in ligand based Virtual Screening (10). Pentacle has been built with the aim of going one step forward in the development of applications for drug discovery, applying software engineering methods from initial steps of development, clear user interface design principles and all the feedback received from ALMOND users in order to obtain a high quality, reliable and user-friendly software. 98 METHODS In this section we will describe the source of the improvements introduced in the software, divided in methodology improvements, GUI design, technological issues and development issues. Methodology improvements. Pentacle implements several improvements over the original GRIND methodology: an improved MIF discretization algorithm named AMANDA (11) and a novel alignment-independent encoding, replacing the original MACC, called CLACC (12). The MD obtained using these improved algorithms can be considered a new generation of alignment-independent MD and will be called GRIND-2 here. However, in order to maintain compatibility and allow to reproduce old results, Pentacle implements also the original GRIND methodology, producing results equivalent to those obtained with ALMOND. Table 1 summarizes the methodology improvements of Pentacle, in comparison with ALMOND. With respect to the MIF discretization algorithm, Pentacle implements the AMANDA algorithm, which allows obtaining more realistic results and much faster than the original algorithm implemented in GRIND. The hot spot regions are extracted without the need of any user supervision or algorithm adjustments, and the final results yield a representative number of nodes for each MIF or no nodes when no pharmacophoric relevant region was found. With respect to the encoding, the new CLACC method (12) can solve the problem of the variable inconsistency often found in GRIND studies (2) as a consequence of the use of MACC. The new encoding algorithm is able to produce much more consistent MD, the application of which in QSAR studies 3.PUBLICATIONS leads to more predictive models, far easier to interpret. Besides these two improvements, Pentacle implements the use of GRIND derived principal properties for Virtual Screening (10). The implementation of the newer and faster AMANDA algorithm allows creating a VS database of several million of compounds in few days and querying it in few seconds. GUI design.The GUI development is one of the most critical points in any software implementation since it will define how the users will interact with the application. Generally, the users are already used to work with graphical interfaces and therefore, a complete GUI is almost mandatory in every new software. GUI design must be guided by widely accepted interaction paradigms in order to create user friendly software, and be adapted to the specific tasks that the user must complete in front of the interface. In this case, the design was guided by a careful analysis of such tasks. In addition, the feedback provided by ALMOND users was a useful source of information. These tasks that the user carries out in a typical application of GRIND for drug discovery were divided into two categories: interactive and noninteractive. A whole list with a brief explanation can be found in table 2 and table 3. Technological issues. Pentacle was developed for drug discovery professionals working in either academic or enterprise environments. The hardware platforms used in these environments are diverse and no single operative system or hardware dominates the market. Ideally, our software must be able to run in any popular platform. Several solutions can be adopted for obtaining an intersystem portable code, but in this work, Qt (13) was the solution selected. Qt is a multiplatform software development framework based on C++ that allows compiling a single version of source code into executable code suitable for most operating systems. Due to this decision, the most extended operating systems, Microsoft Windows (any of its versions), Linux (including different distributions and kernels) and Macintosh OS, are supported in Pentacle. Moreover, Qt does not require a virtual machine, producing efficient code and was easily integrated with other ANSI C and C++ libraries already developed in our lab. Development issues. The Pentacle implementation was carried out applying software development techniques devoted to obtain a scalable and reliable code in every step. The scalability requirement is directly connected to the field of application. In drug discovery, improvements and new methodologies are continuously emerging, creating the need of flexible implementations in software to add endless modifications and new features. For these reasons, a spiral model of development (14) was applied. This model successfully Table 1. Methods used in ALMOND and in Pentacle. ALMOND Pentacle main improvements Discretization original GRIND Encoding MACC faster. More specific and more sensitive results more consistent variables Descriptors GRIND original GRIND AMANDA MACC CLACC GRIND GRIND-2 better results in terms of predictive ability and interpretability of the QSAR models obtained 99 3.PUBLICATIONS Table 2. Non-interactive tasks identified in Pentacle. task Encode description computes the GRIND descriptors input one molecule Export exports GRIND descriptors in external formats analyses sets of the vectors to adjust their size and to select consistent descriptions for every molecule, picking the MACC distance representative builds and validates a chemometric model, including variable selection a descriptor vector projects a molecule in any model, producing a prediction in terms of position, similarity or dependent variable values obtains a database for virtual screening extracts the most similar compounds to the training set a molecule plus a model Consolidate Model Project Database creation Querying Database a set of descriptor vectors a consolidated matrix a set of molecules a set of molecules conforming the training set output a descriptor vector in binary format plus semantic value information a descriptor vector in external format a consolidated matrix a PCA, PLS or template model in internal binary format depending on the model type a database for Virtual Screening a set of the most similar molecules to the training set Table 3. Interactive tasks identified in Pentacle. task Import series Result inspection Model inspection Model interpretation Query interpretation description imports a collection of molecules generates conformations, adjust pH and ionization status, add extra information visualizes GRIND in 2D or 3D together with the molecules structures visualizes Models in 2D or 3D together with the molecules structures interprets a model in chemical terms interprets chemically the results of a Virtual Screening query accomplishes Pentacle implementation requirements since it starts with the user requests and follows with iterative cycles of development and testing until the product is obtained, including the feedback of the users in every iteration. Furthermore, the spiral model has shown to be very effective for developing complex applications in several areas with similar requirements of continuous updating. New suggestions received from users can be added without much 100 effort since Pentacle was developed focusing on the scalability and reusability of the code already written. In addition, a clear separation between GUI and computation was kept in order to allow reusing computational classes in other applications. One important aspect is the class hierarchy and modularity created, since new computational classes can be added without modifying higher level classes with the only restriction of using the 3.PUBLICATIONS communication interface already designed. The source code was developed using different languages according to the function of the code. Algorithms were written in ANSI-C code, meanwhile storage classes and high level computation classes in C++ and GUI classes in Qt. Pentacle development was carried out paying attention to the calculation performance. Algorithms were written in ANSI-C in order to take advantage of the speed of non-object oriented language (avoiding object creation and management) and the facilities for efficiently handling data provided by C based languages. The computation speed improvement obtained by the highperformance implemented algorithms allowed the use of GRIND derived principal properties for ligand-based Virtual Screening applications (10). The most critical parts of the algorithm for querying and creating Virtual Screening were also developed in ANSI-C, in order to improve their performance. RESULTS User interface. The graphical user interface (GUI) implemented in Pentacle provides full control of both interactive and non-interactive tasks. In noninteractive tasks (e.g. compute descriptors or build a PCA model) the GUI allows the users to set-up the initial conditions of the tasks and then to start (run) tasks, which take some time to complete. These tasks will run in separate threads and will not block the GUI. Once they were completed, the GUI guides the user interaction with the results in order to extract from them the most relevant information. The GUI was divided in tabs, being each one associated with one of the main aforementioned tasks. Only a little part of the GUI is “transversal” and visible in every step: a log window (which can be collapsed) and a status bar (Figure 1). Tabs were defined to provide the users all the information needed to interact efficiently with the GUI in every task, as well as for allowing easy transitions between the different steps of the work (Table 4). One of the aims of this separation is the compartimentation of the information, including within each tab only that information needed for performing the task. Furthermore, tabs are sorted by tasks (in a logical way of working) from left to right, interconnected and activated or deactivated according to the jobs that can be carried out. Thus, one tab can be automatically activated when a task in a previous tab has successfully finished whereas it can be deactivated whether data in a previous tab was modified and this change has effects in the data shown by the current tab. This behavior confers Pentacle the ability of showing only relevant and consistent data in every step. Pentacle includes three levels of use: toolbox, regular and advanced. Thus, the users can carry out their tasks using Pentacle in one of these levels based on their expertise and needs. In toolbox level, the users can run Pentacle to carry out a typical computation only pressing the buttons in the button bar without worrying about setting up the parameters of the different methods. Pentacle computation options are set up with default values that allow complete standard computations. In regular level, basic options of the methods can be modified. Finally, in advanced level, the expert users can change the advanced options for a customized use of the AMANDA, MACC and CLACC algorithms. Basic options can be directly modified in the GUI whereas for accessing to the advanced options the users have to press specific less accessible buttons. Pentacle incorporates computation templates, which allow the 101 3.PUBLICATIONS Table 4. Tabs include in Pentacle main window and associated tasks. tab name Molecules Descriptors Results Models Interpretation Prediction Query task importing molecules. Checking their characteristics and 3D structure set-up the GRIND method graphical interpretation of the results (GRIND) setting up and building PCA and PLS models that use GRIND graphical interpretation of the PLS and PCA models carrying out and inspecting of predictions from previously generated PLS models visualization of the results of a Virtual Screening query Figure 1. Tabs and transversal elements present in Pentacle GUI. users to save user-defined options for every method that can be applied in future calculations. Pentacle can also be handled using a command line interface (CLI) mode. Most of the Pentacle functionalities are accessible using the CLI, which opens the possibility to use the program in batch, insert it in complex workflows or by means of a WEB interface. Pentacle CLI should be used for running intensive calculations that need to compute several 102 molecules in batch mode. For example, Virtual Screening database creation can only be carried out using the CLI. The command line uses a command text file that describes the different options for the calculations, and options are human understandable lines where the different calculation values are set. The GUI includes a widget that automatically creates the command file and launches Pentacle in command mode for a GRIND computation project or for 3.PUBLICATIONS creating Virtual Screening database. A summary of the most important CLI commands is included in Table 5. New graphics and tools. Results interpretation is an important step of any GRIND study. It must be borne in mind that the graphic interpretation of a GRIND variable requires to represent the node-couple selected for a certain molecule. Therefore, for a series of compounds, many different graphics (each one representing a single molecule) must be often inspected. To help in this task, Pentacle incorporates interpretation tools consisting of three linked elements: a 3D viewer, where the 3D structure of the molecules is shown, and two 2D graphics for representing separately variables and compounds (Figure 2). These tools are always integrated in the same window and all their elements are interconnected: the 3D graphic represents the selected variable(s) using the chosen compound(s). Consistent color models were used for the 2D plot backgrounds: green color for PLS graphics and blue for PCA, in order to avoid mistakes when both kinds of models were generated. In addition, a wizard interpretation tool for QSAR models was also designed. This tool tries to help nonexpert users in the interpretation of the model variables, selecting those most meaningful and configuring the interpretation tab to show helpful graphics and the best 3D molecule representations. Two new graphical representations of the results were implemented in Pentacle. The first one shows the encoding results of a GRIND calculation (MACC or CLACC results) in a “heatmap” style (Figure 3a). The “heatmap” creates a topographical map of the encoded values, coloring the representation based on the value of the product of the energy. The heatmaps are illustrations of the top vision of the old correlograms representations. This new kind of graphic provides an easy comparison between the profiles of the molecules correlograms, allowing the identification of the principal differences between them. The second one is related to the Virtual Screening. It is often useful to represent the training set in a 2D scatterplot representing the whole database, however the representation of the scores space for millions of compounds (database) provides no information about the density of compounds found at different locations and, when the size of the database is extremely large, cannot be feasible. Pentacle presents a new type of graphic in which the space is represented by means of a mosaic, with cells colored a in a grey scale (Figure 3b). Thus, the training set and the molecules extracted from the database can be represented on this graphic, showing their location and the population of compounds around them. Based on the experience provided by ALMOND users, the graphics and representations were developed for being Table 5. List of CLI commands. command line option -c -vs -mvs -qvs -pred -ddb -mdb Action creates a project for computing GRIND descriptors creates a virtual screening database using only one processor creates a virtual screening database using several processors runs a query on a Virtual Screening database obtains a prediction from a model defragments a database merges two databases 103 3.PUBLICATIONS a) c) b) Figure 2. Typical Pentacle interpretation interface: a) variables and b) compounds 2D graphics, and c) 3D viewer. Figure 3. New tools for interpretation: a) heatmap and b) database mosaic. . fully customizable, in terms of the colors, point shapes and size. This also makes easier the use of the software for color-blind people. Project management. Pentacle introduces the concept of projects and snapshots for GRIND computations. All the computation results are stored in a specific directory with a header file associated that contains some useful information for interpreting the content of the directory. The combination of this 104 file and this directory constitutes what we called project. Projects can be saved all in the same directory (default) or in the current execution directory (old style). The users set a name for the project when the molecules are imported and it is automatically saved when any change in the calculations is detected. In addition, Pentacle allows saving the status of a project at any time in the so called “snapshots”. The saved snapshots are stored and handled by 3.PUBLICATIONS Pentacle and can be recovered in any moment. The implementation of the snapshots confers Pentacle more flexibility for working, allowing testing and comparing different results of the same series with different parameters without creating new projects. Portability. The use of Qt framework allows producing executable versions of Pentacle for some of the most popular hardware platforms used in drug discovery: Windows, Linux (32 and 64 bits). In addition, the portable data types embedded in Qt allow producing fully portable projects and results. This means that, for example, a project generated in Windows can be read by other user using a 64 bits Linux operative system, and the users can share files produced by Pentacle calculations without worrying about how data was obtained, where it was carried out or which files were used for calculations. Complete file portability was implemented for models, virtual screening databases, projects and templates. Virtual Screening capabilities. Pentacle includes tools for computing GRIND principal properties for a large collection of compounds, generating a database. The application contains tools for handling these collections and to use them to run ligand-based virtual screening, starting from a set of template structures. The results of the queries can be visualized using the aforementioned mosaic tools, or as a list of structures, which can also be exported. In order to address the problem of conformational flexibility in virtual screening, the databases can be built using for each compound a collection of structures, representative of diverse conformations. The template set can contain also diverse conformations of the active compounds. In addition, Pentacle contains a set of tools for assessing the performance of Figure 4. Appearance of the Virtual Screening evaluation tools. the query in a certain database by means of standard Virtual Screening metrics like BEDROC, AUC, recovery, etc (see Figure 4). These methods required to prepare ad hoc databases, contaminated with a certain number of known active compounds, the recovery of which is used for quantifying the quality of the results. Real world testing.The spiral model 105 3.PUBLICATIONS adopted allowed testing Pentacle from early development steps. The feedback received from the users has been incorporated from the beginning and we believe that the release version has a high level of usability, customization and reliability. The general impressions of the users were very positive, being remarkable those opinions which show the ease of use even when Pentacle was used for the first time. CONCLUSIONS We have developed Pentacle as a replacement of ALMOND for the computing and handling of GRIND. It incorporates many improvements in terms of the methods implemented, the general usability and computation speed. For the development of Pentacle we applied a spiral software engineering model, which has demonstrated to be convenient for drug discovery software. The user interface of Pentacle has been developed starting from a rational design which considered the task involved in GRIND studies, and applied general principles of design like the masking of any non-necessary information or the design for users with different skill levels. The resulting GUI, according to the user’s opinion, is highly customizable, reliable and easy to learn. The novel concepts of snapshots, projects and portability for GRIND descriptors software represents a breakthrough with respect to previous pieces of software that support GRIND calculations. The improvement of the interpretation tools plus the new wizards simplifies and reduces the effort necessary for extracting useful information from the QSAR models. For all the above reasons we considered Pentacle an interesting example of software designed specifically for drug discovery, and 106 some of the techniques and experiences reported here can be helpful for guiding the development of other scientific tools in this field. ACKNOWLEDGMENT We thank Molecular Discovery Ltd. for supporting this research, including a grant to one of us (AD). The project also received partial funding from the Spanish Ministerio de Educación y Ciencia (project SAF200508025-C03) and the Instituto de Salud Carlos III (Red HERACLES RD06/0009). REFERENCES AND NOTES (1) Todeschini R, Consonni V. Handbook of Molecular Descriptors. Wenheim: Wiley-VCH; 2000. (2) Molecular Interaction Fields. Applications in Drug Discovery and ADME Prediciton. Weinheim: Wiley-VCH Verlag GmbH &Co.; 2006. (3) Cruciani G, Crivori P, Carrupt P, Testa B. Molecular fields in quantitative structure– permeation relationships: the VolSurf approach. J. Mol. Struct-Theochem 2000;503(1-2):17-30. (4) ALMOND, Version 3.3.0; Molecular Discovery Ltd.: Perugia, Italy; 2000. (5) Pastor M, Cruciani G, McLay I, Pickett S, Clementi S. GRid-INdependent descriptors (GRIND): a novel class of alignment-independent three-dimensional molecular descriptors. J.Med.Chem. 2000;43(17):3233-3243. (6) Fontaine F, Pastor M, Gutierrez-de-Teran H, Lozano JJ, Sanz F. Use of alignment-free molecular descriptors in diversity analysis and optimal sampling of molecular libraries. Mol. Diversity 2003;6(2):135-147. (7) Gutierrez-de-Teran H, Centeno N, Pastor M, Sanz F. Novel approaches for modeling of the A(1) adenosine receptor and its agonist binding site. Proteins: Struct Funct Bioinf. 2004;54(4):705-715. (8) Ahlstrom M, Ridderstrom M, Luthman K, Zamora I. Virtual screening and scaffold hopping based on GRID molecular interaction fields. J.Chem.Inf.Model. 2005;45(5):1313-1323. (9) Goodford PJ. A computational procedure for determining energetically favorable binding sites 3.PUBLICATIONS on biologically important macromolecules. J.Med.Chem. 1985;28(7):849-857. (10) Duran A, Zamora I, Pastor M. Suitability of GRIND-based principal properties for the description of molecular similarity and ligandbased virtual screening. J.Chem.Inf.Model. 2009;49(9):2129-2138. (11) Duran A, Martinez GC, Pastor M. Development and validation of AMANDA, a new algorithm for selecting highly relevant regions in Molecular Interaction Fields. J.Chem.Inf.Model. 2008;48(9):1813-1823. (12) Duran A, Lopez L, Pastor M. Consistently Large Auto and Cross Correlation (CLACC): a novel algorithm for encoding relevant molecular interaction fields regions into alignmentindependent descriptors (in preparation). (13) Qt. Available at:http://www.qtsoftware.com/ (14) Boehm BW. A spiral model of software development and enhancement. Computer 1988;21(5):61-72. 107 4.FUTURE WORK 109 4.FUTURE WORK Application of principal properties for structure masking Classically, the collaboration between pharmaceutical companies or between pharmaceutical companies and Academia in drug discovery has been hampered by the (understandable) reluctance of the companies to share valuable data. Any method allowing to share molecular descriptors without disclosing the structures from which they have been obtained would be extremely interesting. However, most of the method published so far do not guarantee a complete structural masking and diverse reverse-engineering methods can be applied in order to guess the structures of the compounds. As stated in publication 2, one of the potential applications of GRIND-derived principal properties is to summarize the data extracted from a 3D structure, preserving what is more informative and relevant and discarding the rest. Indeed, the data present in the first n informative principal properties can be considered as an irreversible encoding of the 3D molecule structure, since part of the data have been discarded. This property points out GRIND-2 derived principal properties as a promising method of structural masking, even if its suitability for this purpose has not yet been tested and validated. Automatic bioactive conformation Probably, the main drawback of any 3D molecular descriptors is their conformation dependence (see section 1.2). In some applications, like QSAR, the impact of the conformational dependence in the results is not so high, because constant errors tend to cancel out and simple extended conformations can be used. However, this approach is not adequate for other applications, like VS. Ideally, only the bioactive conformations are a suitable starting point for the computation of 3D molecular descriptors. Nevertheless, the bioactive conformations are frequently unknown. Classically, the bioactive conformations can be guessed, under certain conditions, using the Active Analogue Approach (AAA) (88), which postulates that any molecule with the ability to interact with a certain receptor should share a common 3D pharmacophore. The search for a common set of 3D features can be carried out using GRIND-2 descriptors computed for large collections of ligand conformations, taking also advantage of the new algorithms developed for similar purposes in CLACC (search of most common node couples). Some 111 4.FUTURE WORK preliminary test have been carried out, obtaining promising results, and we plan to incorporate in Pentacle a full implementation of this methodology and to validate its application on diverse fields of drug discovery. 112 5.CONCLUSIONS 113 5.CONCLUSIONS 1. We developed a new MIF discretization algorithm (AMANDA) with significant advantages over previously published methodologies, in terms of speed of calculation and quality of the hot spots selected. 2. We developed a new region encoding algorithm (CLACC), alternative to the MACC, for series containing structurally related compounds, which allows obtaining better QSAR models, both in terms of predictive ability and interpretability. 3. The application of AMANDA, together with the optional application of CLACC defines a novel type of alignment-independent descriptors (GRIND-2), with significant advantages over the original GRIND. 4. We have proposed and validated a new method for describing the molecular similarity based on principal properties derived from GRIND-2. 5. The new GRIND-2 descriptors, as well as the AMANDA and CLACC algorithms have been implemented in novel software (Pentacle), including all the tools required for their application in QSAR and Virtual Screening, with many advantages over previous software (ALMOND) in terms of reliability, stability, usability and speed of computation. 115 6.REFERENCES 117 6.REFERENCES (1) Carroll PM, Dougherty B, Ross-Macdonald P, Browman K, FitzGerald K. Model systems in drug discovery: chemical genetics meets genomics. Pharmacol.Ther. 2003;99(2):183-220. (2) Drews J. Drug discovery: a historical perspective. Science 2000;287(5460):1960-1964. (3) Langley JN. On the reaction of cells and of nerve-endings to certain poisons, chiefly as regards the reaction of striated muscle to nicotine and to curari. J.Physiol. 1905;33(4-5):374-413. (4) Chain E, Florey HW, Gardner AD, Heatley NG, Jennings MA, OrrEwing J, et al. The classic: penicillin as a chemotherapeutic agent. 1940. Clin.Orthop.Relat.Res. 2005;439:23-26. (5) Scapin G. Structural biology and drug discovery. Curr.Pharm.Des. 2006;12(17):2087-2097. (6) Augen J. The evolving role of information technology in the drug discovery process. Drug Discov.Today 2002;7(5):315-323. (7) Stahl M, Guba W, Kansy M. Integrating molecular design resources within modern drug discovery research: the Roche experience. Drug Discov.Today 2006;11(7-8):326-333. (8) Hopkins AL. Network pharmacology: the next paradigm in drug discovery. Nat.Chem.Biol. 2008;4(11):682-690. (9) Kong DX, Li XJ, Zhang HY. Where is the hope for drug discovery? Let history tell the future. Drug Discov.Today 2009;14(3-4):115-119. (10) Kapetanovic IM. Computer-aided drug discovery and development (CADDD): in silico-chemico-biological approach. Chem.Biol.Interact. 2008;171(2):165-176. (11) Smith C. Drug target identification: a question of biology. Nature 2004;428(6979):225-231. (12) Ohlstein EH, Ruffolo RR,Jr, Elliott JD. Drug discovery in the next millennium. Annu.Rev.Pharmacol.Toxicol. 2000;40:177-191. (13) Snoep JL, Bruggeman F, Olivier BG, Westerhoff HV. Towards building the silicon cell: a modular approach. BioSystems 2006;83(23):207-216. (14) Bauer-Mehren A, Furlong L, Rautschka M, Sanz F. From SNPs to pathways: integration of functional effect of sequence variations on models of cell signalling pathways. BMC Bioinformatics 2009;10:S6. 119 6.REFERENCES (15) Waszkowycz B. Towards improving compound selection in structure-based virtual screening. Drug Discov.Today 2008;13(5-6):219226. (16) Franceschi F, Duffy EM. Structure-based drug design meets the ribosome. Biochem.Pharmacol. 2006;71(7):1016-1025. (17) Pereira DA, Williams JA. Origin and evolution of high throughput screening. Br.J.Pharmacol. 2007;152(1):53-61. (18) Vistoli G, Pedretti A, Testa B. Assessing drug-likeness: what are we missing? Drug Discov.Today 2008;13(7-8):285-294. (19) Lill MA. Multi-dimensional QSAR in drug discovery. Drug Discov.Today 2007;12(23-24):1013-1017. (20) Bergmann R, Liljefors T, Sorensen MD, Zamora I. SHOP: receptorbased Scaffold HOPping by GRID-based similarity searches. J.Chem.Inf.Model. 2009;49(3):658-669. (21) van de Waterbeemd H, Gifford E. ADMET in silico modelling: towards prediction paradise? Nat.Rev.Drug Discov. 2003;2(3):192-204. (22) Todeschini R, Consonni V. Handbook of molecular descriptors. Wenheim: Wiley-VCH; 2000. (23) Wessel MD, Jurs PC, Tolan JW, Muskal SM. Prediction of human intestinal absorption of drug compounds from molecular structure. J.Chem.Inf.Comput.Sci. 1998;38(4):726-735. (24) Purvis GD,3rd. Size-intensive descriptors. J.Comput.Aided Mol.Des. 2008;22(6-7):461-468. (25) Kier LB, Hall LH. Molecular connectivity VII: specific treatment of heteroatoms. J.Pharm.Sci. 1976;65(12):1806-1809. (26) Kier LB, Hall LH, Murray WJ, Randic M. Molecular connectivity I: relationship to nonspecific local anesthesia. J.Pharm.Sci. 1975;64(12):1971-1974. (27) Kier LB, Murray WJ, Hall LH. Molecular connectivity IV: relationships to biological activities. J.Med.Chem. 1975;18(12):1272-1274. (28) Kier LB, Murray WJ, Randic M, Hall LH. Molecular connectivity V: connectivity series concept applied to density. J.Pharm.Sci. 1976;65(8):1226-1230. (29) Murray WJ, Hall LH, Kier LB. Molecular connectivity III: relationship to partition coefficients. J.Pharm.Sci. 1975;64(12):1978-1981. 120 6.REFERENCES (30) Murray WJ, Kier LB, Hall LH. Molecular connectivity VI: examination of the parabolic relationship between molecular connectivity and biological activity. J.Med.Chem. 1976;19(5):573-578. (31) Hall LH, Kier LB, Murray WJ. Molecular connectivity II: relationship to water solubility and boiling point. J.Pharm.Sci. 1975;64(12):1974-1977. (32) Singh J, Deng Z, Narale G, Chuaqui C. Structural interaction fingerprints: a new approach to organizing, mining, analyzing, and designing protein-small molecule complexes. Chem.Biol.Drug Des. 2006;67(1):5-12. (33) Randic M. The connectivity J.Mol.Graph.Model. 2001;20(1):19-35. index 25 years after. (34) Oprea T. On the information content of 2D and 3D descriptors for QSAR. J.Braz.Chem.Soc. 2002;13(6):811-815. (35) Liljefors T. Progress in force-field calculaitons of molecular interaction fields and intermolecular interactions 3D QSAR in Drug Design. : Kluwer / ESCOM Science Publishers; 1998. p. 3. (36) Goodford PJ. A computational procedure for determining energetically favorable binding sites on biologically important macromolecules. J.Med.Chem. 1985;28(7):849-857. (37) Wade RC, Clark KJ, Goodford PJ. Further development of hydrogen bond functions for use in determining energetically favorable binding sites on molecules of known structure. 1. Ligand probe groups with the ability to form two hydrogen bonds. J.Med.Chem. 1993;36(1):140-147. (38) Wade RC, Goodford PJ. Further development of hydrogen bond functions for use in determining energetically favorable binding sites on molecules of known structure. 2. Ligand probe groups with the ability to form more than two hydrogen bonds. J.Med.Chem. 1993;36(1):148-156. (39) Boobbyer DN, Goodford PJ, McWhinnie PM, Wade RC. New hydrogen-bond potentials for use in determining energetically favorable binding sites on molecules of known structure. J.Med.Chem. 1989;32(5):1083-1094. (40) Wade RC. Molecular Interaction Fields. 3D QSAR in Drug Design. Theory, Methods and Applications The Netherlands: ESCOM Science Publishers; 1993. p. 486-505. 121 6.REFERENCES (41) Goodford P. Multivariate characterization of molecules for QSAR analysis. J.Chemometrics 1996;10(2):107-117. (42) Cramer RD, Patterson DE, Bunce JD. Comparative molecular field analysis (CoMFA). 1. Effect of shape on binding of steroids to carrier proteins. J.Am.Chem.Soc. 1998;110(18):5959-5967. (43) Pastor M, Cruciani G, McLay I, Pickett S, Clementi S. GRidINdependent Descriptors (GRIND): a novel class of alignmentindependent three-dimensional molecular descriptors. J.Med.Chem. 2000;43(17):3233-3243. (44) Fontaine F, Pastor M, Sanz F. Incorporating molecular shape into the alignment-free GRid-INdependent Descriptors. J.Med.Chem. 2004;47(11):2805-2815. (45) Fontaine F, Pastor M, Zamora I, Sanz F. Anchor-GRIND: filling the gap between standard 3D QSAR and the GRid-INdependent descriptors. J.Med.Chem. 2005;48(7):2687-2694. (46) Afzelius L, Masimirembwa C, Karlen A, Andersson T, Zamora I. Discriminant and quantitative PLS analysis of competitive CYP2C9 inhibitors versus non-inhibitors using alignment independent GRIND descriptors. J.Comput.Aided Mol.Des. 2002;16(7):443-458. (47) Pastor M. Alignment-independent descriptors from molecular interaction fields. Molecular Interaction Fields Germany: Wiley-VCH Verlag GmbH & Co.; 2006. p. 117-143. (48) CORINA; Version 2.4; Molecular Networks GmbH: Erlangen, Germany; (49) Caron G, Ermondi G. Influence of conformation on GRIND-based three-dimensional quantitative structure activity relationship (3D-QSAR). J.Med.Chem. 2007;50(20):5039-5042. (50) Ortuso F, Langer T, Alcaro S. GBPM: GRID-based pharmacophore model: concept and application studies to protein-protein recognition. Bioinformatics 2006;22(12):1449-1455. (51) Cruciani G, Pastor M, Mannhold R. Suitability of molecular descriptors for database mining. A comparative analysis. J.Med.Chem. 2002;45(13):2685-2694. (52) Ahlstrom M, Ridderstrom M, Luthman K, Zamora I. Virtual screening and scaffold hopping based on GRID molecular interaction fields. J.Chem.Inf.Model. 2005;45(5):1313-1323. 122 6.REFERENCES (53) Ermondi G, Caron G. GRIND-based 3D-QSAR to predict inhibitory activity for similar enzymes, OSC and SHC. Eur.J.Med.Chem. 2008;43(7):1462-1468. (54) Ermondi G, Visentin S, Caron G. GRIND-based 3D-QSAR and CoMFA to investigate topics dominated by hydrophobic interactions: The case of hERG K(+) channel blockers. Eur.J.Med.Chem. 2008;44(5):1926-1932. (55) Li Q, Jorgensen FS, Oprea T, Brunak S, Taboureau O. hERG classification model based on a combination of support vector machine method and GRIND descriptors. Mol.Pharm. 2008;5(1):117-127. (56) Carosati E, Lemoine H, Spogli R, Grittner D, Mannhold R, Tabarrini O, et al. Binding studies and GRIND/ALMOND-based 3D QSAR analysis of benzothiazine type K-ATP-channel openers. Bioorg.Med.Chem. 2005;13(19):5581-5591. (57) Box GEP, Hunter WG, Hunter SJ, Hunter WG. Statistics for experimenters: an introduction to design, data analysis, and model building. : Wiley-Interscience; 1978. (58) Kubinyi H. From narcosis to hyperspace: The history of QSAR. Quant.Struct-Act.Rel. 2002;21(4):348-356. (59) Hansch C, Maloney PP, Fujita T, Muir RM. Correlation of biological activity of Phenoxyacetic acids with Hammett substituent constants and partition coefficients. Nature 1962;194:178-180. (60) Wold S, Esbensen K, Geladi P. Principal component analysis. Chemometrics Intellig.Lab.Syst. 1987;2(1-3):37-52. (61) De Maesschalck R, Jouan-Rimbaud D, Massart DL. The Mahalanobis distance. Chemometrics Intellig.Lab.Syst. 2000;50(1):1-18. (62) Geladi P, Kowalski BR. Partial least-squares regression: a tutorial. Anal.Chim.Acta 1986;185(1):1. (63) Lindgren F. Third generation PLS. Some elements and applications. Solfjadern Offset AB. Umeå: Umeå University; 1994. (64) Wold H. Path models with latent variables: The NIPALS approach. Quantitative Sociology: International perspectives on mathematical and statistical model building NY: Academic Press; 1975. p. 307-357. (65) Cruciani G, Clementi S, Pastor M. GOLPE-guided region selection. 3D QSAR in Drug Design : Kluwer / ESCOM Science Publishers; 1998. p. 71. 123 6.REFERENCES (66) Baroni M, Costantino G, Cruciani G, Riganelli D, Valigi R, Clementi S. Generating Optimal Linear PLS Estimations (GOLPE): an advanced chemometric tool for handling 3D-QSAR problems. Quant.StructAct.Rel. 1993;12(1):9-20. (67) Cruciani G, Watson KA. Comparative molecular field analysis using GRID force-field and GOLPE variable selection methods in a study of inhibitors of glycogen phosphorylase b. J.Med.Chem. 1994;37(16):25892601. (68) Oprea T, Matter H. Integrating virtual screening in lead discovery. Curr.Opin.Chem.Biol. 2004;8(4):349-358. (69) Cavasotto CN, Orry AJ, Murgolo NJ, Czarniecki MF, Kocsi SA, Hawes BE, et al. Discovery of novel chemotypes to a G-protein-coupled receptor through ligand-steered homology modeling and structure-based virtual screening. J.Med.Chem. 2008;51(3):581-588. (70) Engel S, Skoumbourdis AP, Childress J, Neumann S, Deschamps JR, Thomas CJ, et al. A virtual screen for diverse ligands: discovery of selective G protein-coupled receptor antagonists. J.Am.Chem.Soc. 2008;130(15):5115-5123. (71) Markt P, Feldmann C, Rollinger JM, Raduner S, Schuster D, Kirchmair J, et al. Discovery of novel CB2 receptor ligands by a pharmacophore-based virtual screening workflow. J.Med.Chem. 2009;52(2):369-378. (72) Kubinyi H. Similarity and dissimilarity: a medicinal chemist's view. Perspect.Drug Discov.Des. 1998;9-11(0):225-252. (73) Martin YC, Kofron JL, Traphagen LM. Do structurally similar molecules have similar biological activity? J.Med.Chem. 2002;45(19):4350-4358. (74) Klebe G. Virtual ligand screening: strategies, perspectives and limitations. Drug Discov.Today 2006;11(13-14):580-594. (75) Irwin JJ, Shoichet BK. ZINC: a free database of commercially available compounds for virtual screening. J.Chem.Inf.Model. 2005;45(1):177-182. (76) Olah M, Mracec M, Ostopovici L, Rad R, Bora A, Hadaruga N, et al. WOMBAT: World of Molecular Bioactivity. Chemoinformatics in Drug Discovery 2004:223-239. (77) Weis DC, Visco Jr. DP, Faulon J. Data mining PubChem using a support vector machine with the Signature molecular descriptor: 124 6.REFERENCES Classification of factor XIa inhibitors. J.Mol.Graph.Model. 2008 11;27(4):466-475. (78) Krovat EM, Langer T. Impact of scoring functions on enrichment in docking-based virtual screening: an application study on renin inhibitors. J.Chem.Inf.Comput.Sci. 2004;44(3):1123-1129. (79) Bohacek RS, McMartin C, Guida WC. The art and practice of structure-based drug design: a molecular modeling perspective. Med.Res.Rev. 1996;16(1):3-50. (80) Lipinski CA, Lombardo F, Dominy BW, Feeney PJ. Experimental and computational approaches to estimate solubility and permeability in drug discovery and development settings. Adv.Drug Deliv.Rev. 2001;46(1-3):3-26. (81) Oprea T. Current trends in lead discovery: are we looking for the appropriate properties? J.Comput.Aided Mol.Des. 2002;16(5-6):325-334. (82) Huang N, Shoichet BK, Irwin JJ. Benchmarking sets for molecular docking. J.Med.Chem. 2006;49(23):6789-6801. (83) Witten IH, Frank E. Data mining: practical machine learning tools and techniques with Java implementations. New York: Morgan Kaufmann; 1999. (84) Hristozov DP, Oprea T, Gasteiger J. Virtual screening applications: a study of ligand-based methods and different structure representations in four different scenarios. J.Comput.Aided Mol.Des. 2007;21(1011):617-640. (85) Truchon JF, Bayly CI. Evaluating virtual screening methods: good and bad metrics for the "early recognition" problem. J.Chem.Inf.Model. 2007;47(2):488-508. (86) Gregori-Puigjane E, Mestres J. SHED: Shannon entropy descriptors from topological feature distributions. J.Chem.Inf.Model. 2006;46(4):1615-1622. (87) Carosati E, Mannhold R, Wahl P, Hansen JB, Fremming T, Zamora I, et al. Virtual screening for novel openers of pancreatic K(ATP) channels. J.Med.Chem. 2007;50(9):2117-2126. (88) Marshall GR. Binding-site modeling of unknown receptors. 3D QSAR in Drug Design: Theroy Methods and Applications The Netherderlands: ESCOM Science Publishers; 1994. p. 80-113. 125 6.REFERENCES (89) Madhavji NH. The process cycle [software engineering]. Software Engineering Journal 1991;6(5):234-242. (90) Brooks FP, Jr. No silver bullet essence and accidents of software engineering. Computer 1987;20(4):10-19. (91) Royce, W. Managing the development of large software systems: concepts and techniques. ICSE '87: Proceedings of the 9th international conference on Software Engineering Los Alamitos, CA, USA: IEEE Computer Society Press; 1987. (92) Boehm BW. A spiral model of software development and enhancement. Computer 1988;21(5):61-72. (93) Weitzenfeld A. Ingeniería de software orientada a objetos con uml, Java e Internet. ; 2004. (94) Accelrys. Pipeline Pilot. http://accelrys.com/products/index.html. (95) Knime. Available at: http://www.knime.org/. (96) Java. Available at: http://java.sun.com/. (97) Qt. Available at: http://www.qtsoftware.com/. 126 Available at: 7.ANNEXES 127 7.ANNEXES ANNEX I GRIND CITATIONS 129 7.ANNEXES 1. 2. 3. 4. 5. 6. 7. 8. 9. 10. 11. 12. 13. 14. Bergmann R, Liljefors T, Sorensen MD, Zamora I. SHOP: Receptor-Based Scaffold HOPping by GRID-Based Similarity Searches. J.Chem.Inf.Model. 2009;49(3):658-669. Carrieri A, Muraglia M, Corbo F, Pacifico C. 2D-and 3D-QSAR of Tocainide and Mexiletine analogues acting as Na(v)1.4 channel blockers. Eur.J.Med.Chem. 2009;44(4):1477-1485. Carrieri A, Perez-Nueno VI, Fano A, Pistone C, Ritchie DW, Teixido J. Biological Profiling of Anti-HIV Agents and Insight into CCR5 Antagonist Binding Using in silico Techniques. ChemMedChem 2009;4(7):1153-1163. Drakulic BJ, Zalaru C, Lovu M. Acute Toxicity of Substituted 2-(1H-pyrazol-1yl)acetanilides and Related Commercially Available Local Anesthetics Toward Mice. A GRIND/ALMOND-Based 3-D QSAR Study. QSAR Comb.Sci. 2009;28(2):206-217. Duran A, Zamora I, Pastor M. Suitability of GRIND-Based Principal Properties for the Description of Molecular Similarity and Ligand-Based Virtual Screening. J.Chem.Inf.Model. 2009;49(9):2129-2138. Fechner N, Jahn A, Hinselmann G, Zell A. Atomic Local Neighborhood Flexibility Incorporation into a Structured Similarity Measure for QSAR. J.Chem.Inf.Model. 2009;49(3):549-560. Fortuna CG, Barresi V, Musso N, Musumarra G. Synthesis and applications of new trans 1-indolyl-2-(1-methylpyridinium and quinolinium-2-yl)ethylenes. Arkivoc 2009(Part 8):222-229. Kang NS, Lee GN, Yoo S. Predictive models of Cannabinoid-1 receptor antagonists derived from diverse classes. Bioorg.Med.Chem.Lett. 2009;19(11):2990-2996. Larsen SB, Omkvist DH, Brodin B, Nielsen CU, Steffansen B, Olsen L, et al. Discovery of Ligands for the Human Intestinal Di-/Tripeptide Transporter (hPEPT1) Using a QSAR-Assisted Virtual Screening Strategy. ChemMedChem 2009;4(9):1439-1445. Pestana CR, Silva CHTP, Pardo-Andreu GL, Rodrigues FP, Santos AC, Uyemura SA, et al. Ca2+ binding to c-state of adenine nucleotide translocase (ANT)-surrounding cardiolipins enhances (ANT)-Cys(56) relative mobility: A computational-based mitochondrial permeability transition study. Biochim.Biophys.Acta, Bioenerg. 2009;1787(3):176-182. Scior T, Medina-Franco JL, Do Q-, Martinez-Mayorga K, Yunes Rojas JA, Bernard P. How to Recognize and Workaround Pitfalls in QSAR Studies: A Critical Review. Curr.Med.Chem. 2009;16(32):4297-4313. Strombergsson H, Kleywegt GJ. A chemogenomics view on protein-ligand spaces. BMC Bioinformatics 2009;10(Suppl. 6). Tiikkainen P, Poso A, Kallioniemi O. Comparison of structure fingerprint and molecular interaction field based methods in explaining biological similarity of small molecules in cell-based screens. J.Comput.Aided Mol.Des. 2009;23(4):227-239. Tosco P, Ahring PK, Dyhring T, Peters D, Harpsoe K, Liljefors T, et al. Complementary Three-Dimensional Quantitative Structure-Activity Relationship Modeling of Binding Affinity and Functional Potency: A Study on alpha(4)beta(2) Nicotinic Ligands. J.Med.Chem. 2009;52(8):2311-2316. 131 7.ANNEXES 15. Weisel M, Proschak E, Kriegl JM, Schneider G. Form follows function: Shape analysis of protein cavities for receptor-based drug design. J.Proteomics 2009;9(2):451-459. 16. Zhou P, Chen X, Shang Z. Side-chain conformational space analysis (SCSA): A multi conformation-based QSAR approach for modeling and prediction of protein-peptide binding affinities. J.Comput.Aided Mol.Des. 2009;23(3):129141. 17. Braun GH, Jorge DMM, Ramos HP, Alves RM, da Silva VB, Giuliatti S, et al. Molecular dynamics, flexible docking, virtual screening, ADMET predictions, and molecular interaction field studies to design novel potential MAO-B inhibitors. J.Biomol.Struct.Dyn. 2008;25(4):347-355. 18. Carosati E, Budriesi R, Loan P, Ugenti MP, Frosini M, Fusi F, et al. Discovery of novel and cardioselective diltiazem-like calcium channel blockers via virtual screening. J.Med.Chem. 2008;51(18):5552-5565. 19. da Silva VB, Kawano DF, Gomes AdS, Carvalho I, Taft CA, Tomich de Paula da Silva,Carlos Henrique. Molecular dynamics, density functional, ADMET predictions, virtual screening, and molecular interaction field studies for identification and evaluation of novel potential CDK2 inhibitors in cancer therapy. J.Phys.Chem.A 2008;112(38):8902-8910. 20. Douguet D. Ligand-based approaches in virtual screening. Curr.Comput.-Aided Drug Des. 2008;4(3):180-190. 21. Duran A, Martinez GC, Pastor M. Development and validation of AMANDA, a new algorithm for selecting highly relevant regions in molecular interaction fields. J.Chem.Inf.Model. 2008;48(9):1813-1823. 22. Ermondi G, Caron G. GRIND-based 3D-QSAR to predict inhibitory activity for similar enzymes, OSC and SHC. Eur.J.Med.Chem. 2008;43(7):1462-1468. 23. Fortuna CG, Barresi V, Berellini G, Musumarra G. Design and synthesis of trans 2-(furan-2-yl)vinyl heteroaromatic iodides with antitumour activity. Bioorg.Med.Chem. 2008;16(7):4150-4159. 24. Guido RVC, Oliva G, Andricopulo AD. Virtual screening and its integration with modern drug design technologies. Curr. Med. Chem. 2008;15(1):37-46. 25. Hillebrecht A, Klebe G. Use of 3D QSAR models for database screening: A feasibility study. J.Chem.Inf.Model. 2008;48(2):384-396. 26. Kabeya LM, da Silva CHTP, Kanashiro A, Campos JM, Azzolini AECS, Polizello ACM, et al. Inhibition of immune complex-mediated neutrophil oxidative metabolism: A pharmacophore model for 3-phenylcoumarin derivatives using GRIND-based 3D-QSAR and 2D-QSAR procedures. Eur.J.Med.Chem. 2008;43(5):996-1007. 27. Kalliokoski T, Ronkko T, Poso A. FieldChopper, a new tool for automatic model generation and virtual screening based on molecular fields. J.Chem.Inf.Model. 2008;48(6):1131-1137. 28. Kontijevskis A, Komorowski J, Wikberg JES. Generalized proteochemometric model of multiple cytochrome P450 enzymes and their inhibitors. J.Chem.Inf.Model. 2008;48(9):1840-1850. 29. Lapins M, Eklund M, Spjuth O, Prusis P, Wikberg JES. Proteochemometric modeling of HIV protease susceptibility. BMC Bioinformatics. 2008;9(181). 30. Larsen SB, Jorgensen FS, Olsen L. QSAR models for the human H+/peptide symporter, hPEPT1: Affinity prediction using alignment-independent descriptors. J.Chem.Inf.Model. 2008;48(1):233-241. 132 7.ANNEXES 31. Li Q, Jorgensen FS, Oprea T, Brunak S, Taboureau O. hERG classification model based on a combination of support vector machine method and GRIND descriptors. Mol.Pharm. 2008;5(1):117-127. 32. Marin RM, Aguirre NF, Daza EE. Graph theoretical similarity approach to compare molecular electrostatic potentials. J.Chem.Inf.Model. 2008;48(1):109118. 33. Martinez A, Gutierrez-de-Teran H, Brea J, Ravina E, Loza MI, Cadavid MI, et al. Synthesis, adenosine receptor binding and 3D-QSAR of 4-substituted 2-(2`furyl)-1,2,4-triazolo[1,5-a]quinoxalines. Bioorg.Med.Chem. 2008; 16(4):21032113. 34. Mauser H, Guba W. Recent developments in de novo design and scaffold hopping. Curr.Opin.Drug Discovery Dev. 2008;11(3):365-374. 35. Mohr JA, Jain BJ, Obermayer K. Molecule kernels: A descriptor- and alignment-free quantitative structure-activity relationship approach. J.Chem.Inf.Model. 2008;48(9):1868-1881. 36. Ragno R, Simeoni S, Rotili D, Caroli A, Botta G, Brosch G, et al. Class IIselective histone deacetylase inhibitors. Part 2: Alignment-independent GRIND 3-D QSAR, homology and docking studies. Eur.J.Med.Chem. 2008;43(3):621632. 37. Ren Y, Chen G, Hu Z, Chen X, Yan B. Applying novel three-dimensional holographic vector of atomic interaction field to QSAR studies of artemisinin derivatives. QSAR Comb.Sci. 2008;27(2):198-207. 38. Ruan Z, Wang H, Ren Y, Chen Y, Han J, Pang X, et al. Pseudo receptor probes: A novel pseudo receptor-based QSAR method and application into studies on a new kind of selective vascular endothelial growth factor-2 receptor inhibitors. Chemometrics Intellig.Lab.Syst. 2008;92(2):157-168. 39. Sciabola S, Stanton RV, Wittkopp S, Wildman S, Moshinsky D, Potluri S, et al. Predicting kinase selectivity profiles using free-Wilson QSAR analysis. J.Chem.Inf.Model. 2008;48(9):1851-1867. 40. Tintori C, Corradi V, Magnani M, Manetti F, Botta M. Targets Looking for Drugs: A Multistep Computational Protocol for the Development of StructureBased Pharmacophores and Their Applications for Hit Discovery. J.Chem.Inf.Model. 2008;48(11):2166-2179. 41. Urbano-Cuadrado M, Ruiz IL, Gomez-Nieto MA. Description and application of similarity-based methods for fast and simple QSAR model development. QSAR Comb.Sci. 2008;27(4):457-468. 42. von Korff M, Freyss J, Sander T. Flexophore, a new versatile 3D pharmacophore descriptor that considers molecular flexibility. J.Chem.Inf.Model. 2008;48(4):797-810. 43. Arakawa M, Hasegawa K, Funatsu K. The recent trend in QSAR modeling Variable selection and 3D-QSAR methods. Curr.Comput.-Aided Drug Des. 2007;3(4):254-262. 44. Bergmann R, Linusson A, Zamora I. SHOP: Scaffold HOPping by GRID-based similarity searches. J.Med.Chem. 2007;50(11):2708-2717. 45. Buttingsrud B, King RD, Alsberg BK. An alignment-free methodology for modelling field-based 3D-structure activity relationships using inductive logic programming. J.Chemometrics 2007;21(12):509-519. 46. Caballero J, Tundidor-Camba A, Fernandez M. Modeling of the inhibition constant (K-i) of some cruzain ketone-based inhibitors using 2D spatial 133 7.ANNEXES 47. 48. 49. 50. 51. 52. 53. 54. 55. 56. 57. 58. 59. 60. 61. 134 autocorrelation vectors and data-diverse ensembles of Bayesian-regularized genetic neural networks. QSAR Comb.Sci. 2007;26(1):27-40. Capdevila E, Molist M, Vilaplana-Polo M, Brosa C. 20 years of research on brassinosteroids at the Steroids Laboratory of IQS. Afinidad 2007;64(529):303323. Caron G, Ermondi G. Influence of conformation on GRIND-based threedimensional quantitative structure-activity relationship (3D-QSAR). J.Med.Chem. 2007;50(20):5039-5042. Carosati E, Mannhold R, Wahl P, Hansen JB, Fremming T, Zamora I, et al. Virtual screening for novel openers of pancreatic K-ATP channels. J.Med.Chem. 2007;50(9):2117-2126. Ceroni A, Costa F, Frasconi P. Classification of small molecules by two- and three-dimensional decomposition kernels. Bioinformatics 2007;23(16):20382045. Dutta D, Guha R, Wild D, Chen T. Ensemble feature selection: Consistent descriptor subsets for multiple QSAR models. J.Chem.Inf.Model. 2007;47(3):989-997. Ekins S, Mestres J, Testa B. In silico pharmacology for drug discovery: methods for virtual ligand screening and profiling. Br.J.Pharmacol. 2007;152(1):9-20. Korhonen S, Tuppurainen K, Asikainen A, Laatikainen R, Perakyla M. SOMFA on large diverse xenoestrogen dataset: The effect of superposition algorithms and external regression tools. QSAR Comb.Sci. 2007;26(7):809-819. Kumar A, Ghosh I. Mapping selectivity and specificity of active site of plasmepsins from Plasmodium falciparum using molecular interaction field approach. Protein Pept.Lett. 2007;14(6):569-574. Lamanna C, Catalan A, Carocci A, Franchini C, Tortorella V, Vanderheyden PML, et al. AT(1) receptor ligands: Virtual-screening-based design with TOPP descriptors, synthesis, and biological evaluation of pyrrolidine derivatives. ChemMedChem 2007;2(9):1298-1310. Melville JL, Hirst JD. TMACC: Interpretable correlation descriptors for quantitative structure-activity relationships. J.Chem.Inf.Model. 2007;47(2):626634. Neves MAC, Dinis TCP, Colombo G, Melo MLS. Combining computational and biochemical studies for a rationale on the anti-aromatase activity of natural polyphenols. ChemMedChem 2007;2(12):1750-1762. Renner S, Hechenberger M, Noeske T, Boecker A, Jatzke C, Schmuker M, et al. Searching for drug scaffolds with 3D pharmacophores and neural network ensembles. Angew.Chem.Int. Ed. 2007;46(28):5336-5339. Saquib M, Gupta MK, Sagar R, Prabhakar YS, Shaw AK, Kumar R, et al. C-3 Alkyl/Arylalkyl-2,3-dideoxy hex-2-enopyranosides as antitubercular agents: Synthesis, biological evaluation, and QSAR study. J.Med.Chem. 2007;50(13):2942-2950. Sciabola S, Carosati E, Cucurull-Sanchez L, Baroni M, Mannhold R. Novel TOPP descriptors in 3D-QSAR analysis of apoptosis inducing 4-aryl-4Hchromenes: Comparison versus other 2D-and 3D-descriptors. Bioorg.Med.Chem. 2007;15(19):6450-6462. Todorov NP, Alberts IL, de Esch IJP, Dean PM. QUASI: A novel method for simultaneous superposition of multiple flexible ligands and virtual screening using partial similarity. J.Chem.Inf.Model. 2007;47(3):1007-1020. 7.ANNEXES 62. Tropsha A, Golbraikh A. Predictive QSAR Modeling workflow, model applicability domains, and virtual screening. Curr.Pharm.Des. 2007;13(34):3494-3504. 63. Urbano Cuadrado M, Luque Ruiz I, Gomez-Nieto MA. QSAR models based on isomorphic and nonisomorphic data fusion for predicting the blood brain barrier permeability. J.Comput.Chem. 2007;28(7):1252-1260. 64. Urbano-Cuadrado M, Carbo JJ, Maldonado AG, Bo C. New quantum mechanics-based three-dimensional molecular Descriptors for use in QSSR approaches: Application to asymmetric catalysis. J.Chem.Inf.Model. 2007;47(6):2228-2234. 65. Arimoto R. Computational models for predicting interactions with cytochrome p450 enzyme. Curr.Top.Med.Chem. 2006;6(15):1609-1618. 66. Bologa C, Revankar C, Young S, Edwards B, Arterburn J, Kiselyov A, et al. Virtual and biomolecular screening converge on a selective agonist for GPR30. Nat.Chem.Biol. 2006;2(4):207-212. 67. Braiuca P, Boscarol L, Ebert C, Linda P, Gardossi L. 3D-QSAR applied to the quantitative prediction of penicillin G amidase selectivity. Adv.Synth.Catal. 2006;348(6):773-780. 68. Braiuca P, Ebert C, Basso A, Linda P, Gardossi L. Computational methods to rationalize experimental strategies in biocatalysis. Trends Biotechnol. 2006;24(9):419-425. 69. Broccolo F, Cainelli G, Caltabiano G, Cocuzza C, Fortuna C, Galletti P, et al. Design, synthesis, and biological evaluation of 4-alkyliden-beta lactams: New products with promising antibiotic activity against resistant bacteria. J.Med.Chem. 2006;49(9):2804-2811. 70. Buttingsrud B, Ryeng E, King RD, Alsberg BK. Representation of molecular structure using quantum topology with inductive logic programming in structure-activity relationships. J.Comput.Aided Mol.Des. 2006;20(6):361-373. 71. Chang C, Swaan P. Computational approaches to modeling drug transporters. Eur.J.Med.Chem. 2006;27(5):411-424. 72. Costescu A, Moldovan C, Diudea MV. QSAR modeling of steroid hormones. Match-Commun.Math.Co. 2006;55(2):315-329. 73. Crivori P, Reinach B, Pezzetta D, Poggesi I. Computational models for identifying potential P-glycoprotein substrates and inhibitors. Mol.Pharm. 2006;3(1):33-44. 74. Dervarics M, Otvos F, Martinek T. Development of a chirality-sensitive flexibility descriptor for 3+3D-QSAR. J.Chem.Inf.Model. 2006;46(3):14311438. 75. Dudek A, Arodz T, Galvez J. Computational methods in developing quantitative structure-activity relationships (QSAR): A review. Comb.Chem.High Throughput Screen. 2006;9(3):213-228. 76. Gedeck P, Rohde B, Bartels C. QSAR - How good is it in practice? Comparison of descriptor sets on an unbiased cross section of corporate data sets. J.Chem.Inf.Model. 2006;46(5):1924-1936. 77. Gregori-Puigjane E, Mestres J. SHED: Shannon Entropy Descriptors from topological feature distributions. J.Chem.Inf.Model. 2006;46(4):1615-1622. 78. Hoppe C, Steinbeck C, Wohfahrt G. Classification and comparison of ligandbinding sites derived from grid-mapped knowledge-based potentials. J.Mol.Graph.Model. 2006;24(5):328-340. 135 7.ANNEXES 79. Menezes I, Leitao A, Montanari C. Three-dimensional models of non-steroidal ligands: A comparative molecular field analysis. Steroids 2006;71(6):417-428. 80. Montanari M, Cass Q, Leitao A, Andricopulo A, Montanari C. The role of molecular interaction fields on enantioselective and nonselective separation of chiral sulfoxides. J.Chromatogr.A 2006;1121(1):64-75. 81. Ortuso F, Langer T, Alcaro S. GBPM: GRID-based pharmacophore model: concept and application studies to protein-protein recognition. Bioinformatics 2006;22(12):1449-1455. 82. Polanski J, Bak A, Gieleciak R, Magdziarz T. Modeling robust QSAR. J.Chem.Inf.Model. 2006;46(6):2310-2318. 83. Richmond NJ, Abrams CA, Wolohan PRN, Abrahamian E, Willett P, Clark RD. GALAHAD: 1. Pharmacophore identification by hypermolecular alignment of ligands in 3D. J.Comput.Aided Mol.Des. 2006;20(9):567-587. 84. Korhonen S, Tuppurainen K, Laatikainen R, Perakyla M. Comparing the performance of FLUFF-BALL to SEAL-CoMFA with a large diverse estrogen data set: From relevant superpositions to solid predictions. J.Chem.Inf.Model. 2005;45(6):1874-1883. 85. Ahlstrom M, Ridderstrom M, Luthman K, Zamora I. Virtual screening and scaffold hopping based on GRID molecular interaction fields. J.Chem.Inf.Model. 2005;45(5):1313-1323. 86. Aureli L, Cruciani G, Cesta M, Anacardio R, De Simone L, Moriconi A. Predicting human serum albumin affinity of interleukin-8 (CXCL8) inhibitors by 3D-QSPR approach. J.Med.Chem. 2005;48(7):2469-2479. 87. Berthold M, Glen R, Diederichs K, Kohlbacher O, Fischer I, editors. Molecular similarity searching using COSMO screening charges (COSMO/3PP). Computational Life Sciences,Proceedings; Lecture Notes in Computer Science; 2005. 88. Berellini G, Cruciani G, Mannhold R. Pharmacophore, drug metabolism, and pharmacokinetics models on non-peptide AT(1), AT(2), and AT(1)/AT(2) angiotensin II receptor antagonists. J.Med.Chem. 2005;48(13):4389-4399. 89. Budriesi R, Carosati E, Chiarini A, Cosimelli B, Cruciani G, Ioan P, et al. A new class of selective myocardial calcium channel modulators. 2. Role of the acetal chain in oxadiazol-3-one derivatives. J.Med.Chem. 2005;48(7):24452456. 90. Carosati E, Lemoine H, Spogli R, Grittner D, Mannhold R, Tabarrini O, et al. Binding studies and GRIND/ALMOND-based 3D QSAR analysis of benzothiazine type K-ATP-channel openers. Bioorg.Med.Chem. 2005;13(19):5581-5591. 91. Cianchetta G, Li Y, Kang J, Rampe D, Fravolini A, Cruciani G, et al. Predictive models for hERG potassium channel blockers. Bioorg.Med.Chem.Lett. 2005;15(15):3637-3642. 92. Cianchetta G, Singleton R, Zhang M, Wildgoose M, Giesing D, Fravolini A, et al. A pharmaeophore hypothesis for P-glycoprotein substrate recognition using GRIND-based 3D-QSAR. J.Med.Chem. 2005;48(8):2927-2935. 93. Crivori P, Poggesi I. Predictive model for identifying potential CYP2D6 inhibitors. Basic.Clin.Pharmacol.Toxicol. 2005;96(3):251-253. 94. Cruciani G, Carosati E, De Boeck B, Ethirajulu K, Mackie C, Howe T, et al. MetaSite: Understanding metabolism in human cytochromes from the perspective of the chemist. J.Med.Chem. 2005;48(22):6970-6979. 136 7.ANNEXES 95. Fontaine F, Pastor M, Zamora I, Sanz F. Anchor-GRIND: Filling the gap between standard 3D QSAR and the GRid-INdependent Descriptors. J.Med.Chem. 2005;48(7):2687-2694. 96. Freyhult E, Prusis P, Lapinsh M, Wikberg J, Moulton V, Gustafsson M. Unbiased descriptor and parameter selection confirms the potential of proteochemometric modelling. BMC Bioinformatics. 2005;6. 97. Garcia M, Martin-Santamaria S, Cacho M, de la Llave F, Julian M, Martinez A, et al. Synthesis, biological evaluation, and three-dimensional quantitative structure-activity relationship study of small-molecule positive modulators of adrenomedullin. J.Med.Chem. 2005;48(12):4068-4075. 98. Hirons L, Holliday J, Jelfs S, Willett P, Gedeck P. Use of the R-group descriptor for alignment-free QSAR. QSAR Comb. Sci. 2005;24(5):611-619. 99. Korhonen S, Tuppurainen K, Laatikainen R, Perakyla M. Improving the performance of SONIFA by use of standard multivariate methods. SAR QSAR Environ.Res. 2005;16(6):567-579. 100. Lapinsh M, Prusis P, Uhlen S, Wikberg J. Improved approach for proteochemometrics modeling: application to organic compound - amine G protein-coupled receptor interactions. Bioinformatics 2005;21(23):4289-4296. 101. Lewis R, Ertl P, Jacoby E, Tintelnot-Blomley M, Gedeck P, Wolf R, et al. Computational chemistry at novartis. Chimia 2005;59(7-8):545-549. 102. Martinek T, Otvos F, Dervarics M, Toth G, Fulop F. Ligand-based prediction of active conformation by 3D-QSAR flexibility descriptors and their application in 3+3D-QSAR models. J.Med.Chem. 2005;48(9):3239-3250. 103. Moro S, Bacilieri M, Cacciari B, Spalluto G. Autocorrelation of molecular electrostatic potential surface properties combined with partial least squares analysis as new strategy for the prediction of the activity of human A(3) adenosine receptor antagonists. J.Med.Chem. 2005;48(18):5698-5704. 104. Pratuangdejkul J, Schneider B, Jaudon P, Rosilio V, Baudoin E, Loric S, et al. Definition of an uptake pharmacophore of the serotonin transporter through 3DQSAR analysis. Curr.Med.Chem. 2005;12(20):2393-2410. 105. Sciabola S, Carosati E, Baroni M, Mannhold R. Comparison of ligand-based and structure-based 3D-QSAR approaches: A case study on (aryl-)bridged 2aminobenzonitriles inhibiting HIV-1 reverse transcriptase. J.Med.Chem. 2005;48(11):3756-3767. 106. Stiefl N, Baumann K. Structure-based validation of the 3D-QSAR technique MaP. J.Chem.Inf.Model. 2005;45(3):739-749. 107. Vedani A, Dobler M, Dollinger H, Hasselbach K, Birke F, Lill M. Novel ligands for the chemokine receptor-3 (CCR3): A receptor-modeling study based on 5D-QSAR. J.Med.Chem. 2005;48(5):1515-1527. 108. Vulpetti A, Crivori P, Cameron A, Bertrand J, Brasca M, D'Alessio R, et al. Structure-based approaches to improve selectivity: CDK2-GSK3 beta binding site analysis. J.Chem.Inf.Model. 2005;45(5):1282-1290. 109. Afzelius L, Zamora I, Masimirembwa C, Karlen A, Andersson T, Mecucci S, et al. Conformer- and alignment-independent model for predicting structurally diverse competitive CYP2C9 inhibitors. J.Med.Chem. 2004;47(4):907-914. 110. Ballistreri F, Barresi V, Benedetti P, Caltabiano G, Fortuna C, Longo M, et al. Design, synthesis and in vitro antitumor activity of new trans 2-[2(heteroaryl)vinyl]-1,3-dimethylimidazolium iodides. Bioorg.Med.Chem. 2004;12(7):1689-1695. 137 7.ANNEXES 111. Barbany M, Gutierrez-De-Teran H, Sanz F, Villa-Freixa J. Towards a MIPBased alignment and docking in computer-aided drug design. Proteins: Struct.Funct.Bioinf. 2004;56(3):585-594. 112. Bender A, Glen R. Molecular similarity: a key technique in molecular informatics. Org.Biomol.Chem. 2004;2(22):3204-3218. 113. Bender A, Mussa H, Gill G, Glen R. Molecular surface point environments for virtual screening and the elucidation of binding patterns (MOLPRINT 3D). J.Med.Chem. 2004;47(26):6569-6583. 114. Bender A, Mussa H, Glen R, Reiling S. Similarity searching of chemical databases using atom environment descriptors (MOLPRINT 2D): Evaluation of performance. J.Chem.Inf.Comput.Sci. 2004;44(5):1708-1718. 115. Benedetti P, Mannhold R, Cruciani G, Ottaviani G. GRIND/ALMOND investigations on CysLT(1) receptor antagonists of the quinolinyl(bridged)aryl type. Bioorg.Med.Chem. 2004;12(13):3607-3617. 116. Chae C, Yoo S, Shin W. Novel receptor surface approach for 3D-QSAR: The weighted probe interaction energy method. J.Chem.Inf.Comput.Sci. 2004;44(5):1774-1787. 117. Cratteri P, Romanelli M, Cruciani G, Bonaccini C, Melani F. GRIND-derived pharmacophore model for a series of alpha-tropanyl derivative ligands of the sigma-2 receptor. J.Comput.Aided Mol.Des. 2004;18(5):361-374. 118. Crivori P, Zamora I, Speed B, Orrenius C, Poggesi I. Model based on GRIDderived descriptors for estimating CYP3A4 enzyme stability of potential drug candidates. J.Comput.Aided Mol.Des. 2004;18(3):155-166. 119. Cruciani G, Baroni M, Carosati E, Clementi M, Valigi R, Clementi S. Peptide studies by means of principal properties of amino acids derived from MIF descriptors. J.Chemometrics 2004;18(3-4):146-155. 120. Cruciani G, Benedetti P, Caltabiano G, Condorelli D, Fortuna C, Musumarra G. Structure-based rationalization of antitumor drugs mechanism of action by a MIF approach. Eur.J.Med.Chem. 2004;39(3):281-289. 121. de Groot M, Kirton S, Sutcliffe M. In silico methods for predicting ligand binding determinants of cytochromes P450. Curr.Top.Med.Chem. 2004;4(16):1803-1824. 122. Ekins S, Swaan P. Development of computational models for enzymes, transporters, channels, and receptors relevant to ADME/Tox. Reviews in Computational Chemistry,Vol 20; Reviews in Computational Chemistry; 2004. p. 333-415. 123. Fontaine F, Pastor M, Sanz F. Incorporating molecular shape into the alignmentfree GRid-INdependent Descriptors. J.Med.Chem. 2004;47(11):2805-2815. 124. Gutierrez-de-Teran H, Centeno N, Pastor M, Sanz F. Novel approaches for modeling of the A(1) adenosine receptor and its agonist binding site. Proteins: Struct.Funct.Bioinf. 2004;54(4):705-715. 125. Klein C, Kaiser D, Ecker G. Topological distance based 3D descriptors for use in QSAR and diversity analysis. J.Chem.Inf.Comput.Sci. 2004;44(1):200-209. 126. Montanari M, Andricopulo A, Montanari C. Calorimetry and structure-activity relationships for a series of antimicrobial hydrazides. Thermochim.Acta 2004;417(2):283-294. 127. Oprea T, Matter H. Integrating virtual screening in lead discovery. Curr.Opin.Chem.Biol. 2004;8(4):349-358. 138 7.ANNEXES 128. Pirard B. Computational methods for the identification and optimisation of high quality leads. Comb.Chem.High Throughput Screen. 2004;7(4):271-280. 129. Prusis P, Dambrova M, Andrianov V, Rozhkov E, Semenikhina V, Piskunova I, et al. Synthesis and quantitative structure-activity relationship of hydrazones of N-Amino-N `-hydroxyguanidine as electron acceptors for xanthine oxidase. J.Med.Chem. 2004;47(12):3105-3110. 130. Sutherland J, O'Brien L, Weaver D. A comparison of methods for modeling quantitative structure-activity relationships. J.Med.Chem. 2004;47(22):55415554. 131. Tuppurainen K, Viisas M, Perakyla M, Laatikainen R. Ligand intramolecular motions in ligand-protein interaction: ALPHA, a novel dynamic descriptor and a QSAR study with extended steroid benchmark dataset. J.Comput.Aided Mol.Des. 2004;18(3):175-187. 132. Barbany M, Gutierrez-de-Teran H, Sanz F, Villa-Freixa J, Warshel A. On the generation of catalytic antibodies by transition state analogues. ChemBioChem 2003;4(4):277-285. 133. Brea J, Masaguer C, Villazon M, Cadavid M, Ravina E, Fontaine F, et al. Conformationally constrained butyrophenones as new pharmacological tools to study 5-HT2A and 5-HT2C receptor behaviours. Eur.J.Med.Chem. 2003;38(4):433-440. 134. Fontaine F, Pastor M, Gutierrez-de-Teran H, Lozano JJ, Sanz F. Use of alignment-free molecular descriptors in diversity analysis and optimal sampling of molecular libraries. Mol.Diversity 2003;6(2):135-147. 135. Korhonen S, Tuppurainen K, Laatikainen R, Perakyla M. FLUFF-BALL, a template-based grid-independent superposition and QSAR technique: Validation using a benchmark steroid data set. J.Chem.Inf.Comput.Sci. 2003;43(6):17801793. 136. Kovatcheva A, Buchbauer G, Golbraikh A, Wolschann P. QSAR modeling of alpha-campholenic derivatives with sandalwood odor. J.Chem.Inf.Comput.Sci. 2003;43(1):259-266. 137. Lapinsh M, Prusis P, Mutule I, Mutulis F, Wikberg J. QSAR and proteochemometric analysis of the interaction of a series of organic compounds with melanocortin receptor subtypes. J.Med.Chem. 2003;46(13):2572-2579. 138. Lavine B, Davidson C, Breneman C, Katt W. Electronic van der Waals surface property descriptors and genetic algorithms for developing structure-activity correlations in olfactory databases. J.Chem.Inf.Comput.Sci. 2003;43(6):18901905. 139. Melani F, Gratteri P, Adamo M, Bonaccini C. Field interaction and geometrical overlap: A new simplex and experimental design based computational procedure for superposing small ligand molecules. J.Med.Chem. 2003;46(8):1359-1371. 140. Stiefl N, Baumann K. Mapping property distributions of molecular surfaces: Algorithm and evaluation of a novel 3D quantitative structure-activity relationship technique. J.Med.Chem. 2003;46(8):1390-1407. 141. Stiefl N, Bringmann G, Rummey C, Baumann K. Evaluation of extended parameter sets for the 3D-QSAR technique MaP: Implications for interpretability and model quality exemplified by antimalarially active naphthylisoquinoline alkaloids. J.Comput.Aided Mol.Des. 2003;17(5-6):347365. 139 7.ANNEXES 142. Wolohan P, Reichert D. CoMFA and docking study of novel estrogen receptor subtype selective ligands. J.Comput.Aided Mol.Des. 2003;17(5-6):313-328. 143. Zamora I, Afzelius L, Cruciani G. Predicting drug metabolism: A site of metabolism prediction tool applied to the cytochrome P4502C9. J.Med.Chem. 2003;46(12):2313-2324. 144. Oprea T. Chemical space navigation in lead discovery. Curr.Opin.Chem.Biol. 2002;6(3):384-389. 145. Vedani A, Dobler M. 5D-QSAR: The key for simulating induced fit? J.Med.Chem. 2002;45(11):2139-2149. 146. Afzelius L, Masimirembwa C, Karlen A, Andersson T, Zamora I. Discriminant and quantitative PLS analysis of competitive CYP2C9 inhibitors versus noninhibitors using alignment independent GRIND descriptors. J.Comput.Aided Mol.Des. 2002;16(7):443-458. 147. Baumann K. Distance Profiles (DiP): A translationally and rotationally invariant 3D structure descriptor capturing steric properties of molecules. Quant.StructAct.Rel. 2002;21(5):507-519. 148. Baumann K. An alignment-independent versatile structure descriptor for QSAR and QSPR based on the distribution of molecular features. J.Chem.Inf.Comput.Sci. 2002;42(1):26-35. 149. Benedetti P, Mannhold R, Cruciani G, Pastor M. GBR compounds and mepyramines as cocaine abuse therapeutics: Chemometric studies on selectivity using grid independent descriptors (GRIND). J.Med.Chem. 2002;45(8):15771584. 150. Boyer S, Zamora I. New methods in predictive metabolism. J.Comput.Aided Mol.Des. 2002;16(5-6):403-413. 151. Cruciani G, Pastor M, Mannhold R. Suitability of molecular descriptors for database mining. A comparative analysis. J.Med.Chem. 2002;45(13):26852694. 152. Erhardt P. Medicinal chemistry in the new millennium. A glance into the future. Pure Appl. Chem. 2002;74(5):703-785. 153. Flower D, editor. Molecular informatics: Sharpening drug design's cutting edge. Drug Design: Cutting Edge Approaches; Royal Society of Chemistry Special Publications; 2002. 154. Klein C, Kaiblinger N, Wolschann P. Internally defined distances in 3Dquantitative structure-activity relationships. J.Comput.Aided Mol.Des. 2002;16(2):79-93. 155. Kubinyi H. From narcosis to hyperspace: The history of QSAR. Quant.StructAct.Rel. 2002;21(4):348-356. 156. Lavine B, Workman J. Chemometrics. Anal.Chem. 2002;74(12):2763-2769. 157. Masimirembwa C, Ridderstrom M, Zamora I, Andersson T. Combining pharmacophore and protein modeling to predict CYP450 inhibitors and substrates. Cytochrome P450,PT C; Methods in Enzymology; 2002. p. 133-144. 158. Flower D, editor. Virtual techniques for lead optimisation. Drug Design: Cutting Edge Approaches; Royal Society of Chemistry Special Publications; 2002. 159. Oprea T. On the information content of 2D and 3D descriptors for QSAR. J.Braz.Chem.Soc. 2002;13(6):811-815. 160. Putta S, Lemmen C, Beroza P, Greene J. A novel shape-feature based approach to virtual library screening. J.Chem.Inf.Comput.Sci. 2002;42(5):1230-1240. 140 7.ANNEXES 161. Rodrigo J, Barbany M, Gutierrez-de-Teran H, Centeno N, de-Caceres M, Dezi C, et al. Comparison of biomolecules on the basis of molecular interaction potentials. J.Braz.Chem.Soc. 2002;13(6):795-799. 162. Salamon E, Mannhold R, Weber H, Lemoine H, Frank W. 6-sulfonylchromenes as highly potent K-ATP-channel openers. J.Med.Chem. 2002;45(5):1086-1097. 163. Tuppurainen K, Viisas M, Laatikainen R, Perakyla M. Evaluation of a novel electronic eigenvalue (EEVA) molecular descriptor for QSAR/QSPR studies: Validation using a benchmark steroid data set. J.Chem.Inf.Comput.Sci. 2002;42(3):607-613. 164. Vedani A, Dobler M. Multidimensional QSAR: Moving from three- to fivedimensional concepts. Quant.Struct-Act.Rel. 2002;21(4):382-390. 165. Wong M, Tehan B, Lloyd E. Molecular mapping in the CNS. Curr.Pharm.Des. 2002;8(17):1547-1570. 166. Bostrom J. Reproducing the conformations of protein-bound ligands: A critical evaluation of several popular conformational searching tools. J.Comput.Aided Mol.Des. 2001;15(12):1137-1152. 167. Holtje H, Sippl W, editors. From molecular interaction fields (MIF) to a widely applicable set of descriptors. Rational Approaches to Drug Design; 2001. 168. Holtje H, Sippl W, editors. GRIND (grid independent descriptors) in 3D structure-metabolism relationships. Rational Approaches to Drug Design; 2001. 169. de Souza L, Canuto S. Efficient estimation of second virial coefficients of fused hard-sphere molecules by an artificial neural network. PCCP 2001;3(21):47624768. 170. Holtje H, Sippl W, editors. Grid INdependent Descriptors (GRIND) in the rational design of muscarinic antagonists. Rational Approaches to Drug Design; 2001. 171. Boyer S, Zamora I. New methods in predictive metabolism. Mol.Diversity 2000;5(4):277-287. 141 7.ANNEXES ANNEX II PENTACLE USER MANUAL 143 7.ANNEXES Pentacle An advanced tool for computing and handling GRid-INdependent Descriptors Ángel Durán and Manuel Pastor Research Group on Biomedical Informatics (GRIB), IMIM/UPF, Barcelona, Spain [email protected] http://cadd.imim.es/ Version 1.04 Manual Version 1.0 145 7.ANNEXES 1. Introduction 1.1. What is Pentacle? The Pentacle software is a computational tool for computing alignment-free molecular descriptors, also called GRid-INdependent descriptors or GRIND. Encoding the molecules into a set of descriptors is the first step for most computational methods and the choice of the appropriate descriptors is of critical importance for their success. You can compute many different molecular descriptors, some are more complex and some are simpler, and everyone describes different molecular properties. If you want to use them for Drug Design, the GRIND are a good compromise. You can learn more about GRIND reading the original reference [1], but the main features of GRIND are: Based on Molecular Interaction Fields, describe the ability of the molecules to interact with other molecules Suitable for representing binding affinity Alignment independent. Do not require to superimpose the compounds 3D and conformation dependent. Describe a certain 3D structure, but are robust to small-medium conformational changes Fast to compute. In the order of 50.000 compounds per day and CPU. Suitable for 3D-QSAR, subset selection, library design, similarity searching and virtual screening. Apart from computing the descriptors, Pentacle includes chemometric tools which allow using them to build QSAR models, carry out virtual screening, etc. 1.2. What can I do with Pentacle? With Pentacle you can: 146 Compute GRIND for series of chemical compounds Visualize the descriptors using diverse graphical representations: correlograms, heatmaps and 3D molecular graphics Export the descriptors to standard interchange formats Use the GRIND to build PCA and PLS models Represent the results of the PCA and PLS models using diverse 2D plots Interpret the models using ad hoc developed tools Store the models in you own model library and use them to predict the properties of other compounds Build databases of compounds and carry out a similarity search (virtual screening) 7.ANNEXES 2. How to... If you are impatient to use Pentacle this section is for you. In this section we describe the general procedure for carrying out the most common operations. A more detailed description of the program options can be found in section 3: Reference Manual. 2.1. Import your compounds and compute GRIND The starting material for obtaining GRIND is a collection of compounds. You must have collected their 3D structure in one of the following standard formats: Tripos mol2, MDL SDFile (3D variant) or GRID kout. The structures must be reasonably correct, must include correct bond orders and the hydrogen atoms must have been added. Start the program and select the command “Molecules >> Import series” (or press the icon in the toolbar or press CTRL+I). A dialog as the following in shown: Press the buttons on the right to select directly the mol2, kout or SDFiles files from a standard dialog (from which you can select multiples files). You can also select a “file list”: a simple text file which contains the names of the mol2 or SDFiles you want to import. The names of the files selected, and the names of the molecules inside, will be shown on the left hand side window. By default, the files are imported at the protonation state present in the file. If you want, you can choose to define a pH and let the program to set ionizable groups to the appropriate state. Also in this dialog you must enter a name for the project. From this moment, the program will store all the information relative to this series of compounds under this name, so you can retrieve all your work at a latter time. Once you are satisfied with your choices press OK. The dialog closes and all the compounds are shown in the main window: 147 7.ANNEXES Notice that the program status line changes to show the number of molecules imported. Now you are ready to run the encoding algorithm. If you want to use default values, icon in the select the command Descriptors>>Compute descriptors (or press the toolbar or press CTRL+C). A progress dialog will be shown and the status of every compound will change from “ready” to “complete”. If you wish to change the default values you can select the Descriptors Tab. On the left hand side there is a list of Computation templates, standard “recipes” to obtain GRIND. Pentacle contains two such templates; AMANDA classic and ALMOND classic. The first offers what we think is the best settings for most users and the second mimic the results obtained with program ALMOND. If you modify the settings to define your own “recipe”, it can be stored as a new template for latter use by pressing the Add template button. There are three aspects of GRIND which can be customised; the way the MIF are computed (Computations), how the fields are simplified by extracting some hot spots (Discretization) and how the relative positions of these few points are described using distances (Encoding). For every aspect you can select a methodology and adjust some parameters. The methods and the parameters are described in detail in section 3.3 together with some guidelines for making sensible choices. 148 7.ANNEXES Once the computation is finished, the GRIND are shown in the Results tab. The status line of the program changes to reflect the number of X variable computed and the number of blocks (correlograms). 2.2. Inspect the results This is the aspect of the Result tab: 149 7.ANNEXES On the left hand side you there are controls for selecting how to represent the GRIND, and which molecules and correlograms will be shown. On the right hand side the left-most window represents the GRIND in 2D and the right-most window represents the GRIND in 3D. All the elements of this window are linked; if you change the compound selected, both windows on the right show immediately the GRIND for this compound. By default, just after finishing computations, the window shows the GRIND as a profile for the first compound in the series, using all the correlograms. The 2D graphic contains a spectrum-like representation of the GRIND values, often called correlogram. When more than one correlogram is selected, the 2D window represents all of them side by side, separated by a dashed line and labelled on the bottom. The peaks shown in the correlograms represents the presence of a pair of nodes located at a certain distance. The position in the X axis represents a distance range, which grows from left to right and the position on the Y axis the product of the energy of interaction of the couple of nodes selected for representing this distance range (usually, the ones with the highest product). If you click on top of any point, the plot will show two labels, one indicating the number of variable and the name of the compound and other, on the left axis, indicating the actual value. At the same time, the 3D graphic on the right-most window will show the structure of the compounds and a line linking the couple of field nodes used for computing this value. By clicking on different points you can identify all the couples of nodes used to generate the variables for the different compounds in the series. To simplify the selection, you can use the right and left arrow keys to change the variable and the up and down keys to change the compound. Profile representations are useful to inspect a single compound, but to obtain an overall picture of the series the heatmaps representations are more useful. If you 150 7.ANNEXES select it (on top of the left-most section), the 2D window will show a matrix-like representation, where every row represent a single compound and every column a single variable. The values of the variables are colour-coded from red (low value) to blue (high value). In this graphic you can also click on top of the cells to select single compounds and variables or use the arrow keys, like in the profiles representation. This representation is very useful to identify special compounds because their colour bands look different from the rest of the series. Also, when the compounds have been ordered by activity from top to bottom, this representation allows to identify trends in the variables associated with the activity (for example, some blue bands present only for the active compounds on top but not present for the compounds at the bottom). 2.3. Build PCA and PLS models The GRIND you obtained can be used directly to obtain multivariate models. If you want to inspect your series and obtain a map of your compounds describing their similarities and differences you can use Principal Component Analysis (PCA). Alternatively, if you have additional information about your compounds like an experimental value describing a biological property you can import this value and use Partial Least Squares (PLS) regression analysis method to obtain a model between the GRIND and the biological property (a Quantitative Structure-Activity Relationship model or QSAR model). For building a PCA model simply press the blue flask icon (or select the command Models>>Build PCA or press CTRL+B). In few seconds the program will obtain 5PC and show the results in a table, showing the amount of X variance explained by the model. The same information can also be seen in graphic format selecting “show as” plot SSX and VarX. The controls on the right hand side allow to obtain more PC and to select a different scaling scheme. 151 7.ANNEXES For building a PLS you must start importing the Y variable, typically describing biological properties of the compounds. The best way to import this information is to prepare a simple text file containing in every line the name of the compound, a comma, and the property. Then read the file using the command Molecules>>Import activity list.... This command will present a dialog like the following where a preview of the imported values is shown. If you are satisfied with the values shown, press the Import button. Once the value of the Y are imported, the status line will reflect the number of Y values added and the values will be shown in the Molecule tab of the main window, where they can be reviewed and edited. Indeed, another method to introduce the activity values is to type them directly in this tab. Now, it is possible to build a PLS model using the newly imported Y values. Press the green flask icon (command Models>>Build PLS model or CTRL+L). Pentacle, will build a PLS model of 5 LV and will validate it using Leave-One-Out (LOO) crossvalidation. The results will be shown in tabular format, presenting for every model dimensionality the values of the SSX, SSXacc, SDEC, SDEP, R2, R2acc and Q2acc. A detailed description of the meaning of these statistic parameters is provided in section 3.5, but for most users the two more important values are the R2acc, an index 152 7.ANNEXES of the model fitting quality which indicates the amount of Y variation explained by the model (the nearer to 1.00 the better) and the Q2acc, an index of the model predictive ability obtained by the cross-validation test (again, the nearer to 1.00 the better). These indexes can also be inspected in graphic form changing the show as control, as plot R2 & Q2. The values of R2 and Q2 allow deciding (i) is the model obtained has enough quality and (ii) which is the best model dimensionality. As a rule of thumb, an acceptable QSAR model should have a R2 over 0.8 and a Q2 over 0.5. With respect to the model dimensionality, you can choose the one with higher Q2, but it is sensible to discard the last LV if the increase obtained in terms of R2 or Q2 is rather small (less than 0.02). If you are not satisfied with the quality of the model obtained Pentacle incorporates GOLPE-FFD variable selection technology, allowing to obtain models with improved predictive ability (see Section 3.5 for details). In this tab you can use the controls located on the right hand side to increase the number of LV to extract, change the scaling and the cross-validation method (to Leave-Two-Out or to Random Groups). All these controls are thoroughly described in section 3.5. 2.4. Interpret your models The Interpretation tab contains three linked graphics reflecting the results of the models (PCA and/or PLS) obtained in the Models tab. The aspect of the tab is the following. The graphics on the left are interactive and allow selecting variables (top) and compounds (bottom). The plot on the right hand side shows a 3D representation of the selected variables on top of the selected compounds. The three regions are separated by splitter bars that permit to assign more or less space to them, but their relative location is fixed (2D on the left, 3D on the right, variables on top and compounds on the bottom). In every region we can visualize different types of plots, for either the PCA or PLS model. In the variables plots region we can represent: PCA loading plots PLS loading plots PLS weight plots PLS coefficient plots In the compounds plots region we can represent: 153 7.ANNEXES PCA scores PLS plot (TU scores plot) PLS scores Var selected vs Y Experimental vs Calculated Predicted vs Calculated Notice that in some cases you can visualize the graphics as a scatter-plot or as barplots. The variables or the model dimensionality represented can be changed with the X-axis and Y-axis controls. The plots backgrounds are colour coded to make easier the interpretation: PCA graphics are plot on a blue background and the PLS graphics are plot on a green background. PCA model interpretation Start by examining the PCA scores for the 2 first PC. This graphic is like a map in which the distance between the points expresses the similarity between the compounds. A close examination can reveal the presence of diverse families of structures as well as anomalous compounds, etc... The X axis locates on the far right and on the far left of this plot the most dissimilar compounds. To know which structural features are behind these differences look to the PCA loadings plot, preferably as a bar plot: the objects on the right hand side (positive) of the scores plot take high values for the variables with positive loadings, while the objects on the left hand side (negative) of the scores plot take high values for the variables with negative loadings. Therefore, a simple method to understand the PC from a structural point of view is to select the most positive variables and click on the right-most compounds, to see represented on the 3D graphic the characteristics present in these compounds, and then make the same exercise for the more negative variables and the left-most compounds. 154 7.ANNEXES Typically, the first PC will locate on one side small compounds and on the other bulky compounds. In another series the first PC will separate polar and hydrophobic compounds. The same exercise can be repeated for the second and third PC. Usually the inspection of a few PC provides a lot of useful information. PLS model interpretation When a good PLS model is obtained, a most common question is to know which structures features are associated with an increase or a decrease of the biological properties. To answer this question start by selecting a PLS coefficient plot for a certain model dimensionality (e.g. If the best Q2 were obtained for LV2, select X axis: 2). In this graphic, the variables with the more positive values represent features found in the most active compounds or absent in the less active while the more negative represent features found in the less active compounds or absent in the more active. To know the exact meaning of each one start by selecting the VarX selected vs Var Y plot (region of compound plots). Then click on the variable you want to investigate; the VarX selected-VarY plot will show the correlation of this particular variable with the Y. By clicking on objects with either high or low values for this variable you can identify on the 3D region these structural characteristics, simply by comparing what it present-absent in active-inactive compounds. 155 7.ANNEXES This process can be carried out in a more automatic way using the interpretation icon, or Models>>Interpretation wizard.... This will wizard (press the crystal ball present a dialog in which the 10 more important variable are shown in a list. If you click on the variable names in the dialog, the variable is selected in the PLS coefficients plot and a VarX selected-VarY plot for the selected variable is also shown. The dialog includes an editable text field where you can include comments about the chemical interpretation. These will be saved and retrieved when you return to this project. In most cases, the main structural and physicochemical properties associated with the biological properties are easy to identify and requires investigating only the variables with the highest values. On the contrary, minor effects are much harder to understand. In most cases focussing on the main effects is the best strategy. 156 7.ANNEXES 2.5 Build a database for VS Pentacle can be used to carry out a similarity search on very large databases. This is useful if you build a database of accessible compounds (in-house collections, providers catalogues, etc.) on which you can search for bioisosters of one or some template compounds with interesting properties. The first step is to compute descriptors for all the compounds present in your database. This is often a time-consuming step, which can be carried out writing a command file and submitting the job to a server. The syntax of such command files is described in Appendix, but you can use some of the command file examples provided in the distribution. Alternatively you can use the command Tools>>Build script. This will open a dialog like this: 157 7.ANNEXES Select Database as script type and use the Add button on the left to insert files containing the structures you want to include in the database. 3D SDFiles or mol2 files are suitable formats. Then you need to define some options: Computation template Instead of defining one by one all the GRIND parameters is convenient to adjust them in the Descriptors tab and then save your options as a Computation template. Alternatively you can use one of the templates provided by the program (e.g. AMANDA or ALMOND) Number of CPUs If your server has more than one CPU or your CPU has multiple cores, Pentacle can run computation jobs in parallel, thus obtaining a linear speedup. Please do not select more CPUs than the real ones installed in your server, because in this case this setting would slow down the computation. PCA components or PCA explained variance The similarity search is carried out comparing the values of the PCA scores. In order to capture enough structural information a minimum of 3 PC must be used, but for large databases a much higher number (from 10 to 30) is advisable. Alternatively, the number of PC can be selected by defining the minimum percentage of the X variance to be explained by the PCA model. Values between 75% and 85% are recommended in typical applications. Database name Assign a short and descriptive name Execution after template creation If checked Pentacle will start the job immediately (this option is not available in the Windows version, due to its limited scripting capabilities). If not, a template file will be written. This is a good idea if you want to submit the job in a different server or do it at a latter time. In Windows you can also start the job from the stored template. The encoding of a large database takes time and some of the encoding steps require large amounts of memory. For example, encoding a million compounds in a server with eight cores might take 60 hours and will require at least 4 Gb RAM. 2.6. Query your VS database Once you have created a VS database using Pentacle, you can carry out similarity searches and obtain results in few seconds. The starting point of a similarity search is a set of templates. These are imported as described in section 2.1, but before pressing the OK button in the importing dialog, make sure to select a database using the Database control. Once you press OK button, Pentacle automatically will import the molecules and compute GRIND using the same parameters used to obtain the VS database selected. When the computation is finished, the Query tab is activated. 158 7.ANNEXES Inside this tab, you can set-up different query parameters, carry out the query and inspect the results in a table and a 2D plot representing the chemical space. The 3D structure of all the compounds (templates and results) can also be visualized. The VS quality dialog allows computing standard test for evaluating the quality of the results obtained. These tests require using ad hoc prepared database containing known active and decoy compounds. Start by setting up the query parameters like the method of search, the scaling and the number of PCA components. These options are described in the Query tab section, but the default options often produce acceptable results. Adjust the Results to the number of structures that you want to obtain. Then use the command VS>>Compute query (or press the icon in the toolbar) and wait a few seconds. The results will be shown in the table as a list of extracted compounds sorted by similarity. Alternatively you can select the Show as graphic control to visualize both the query templates and the results in a 2D graphic depicting the PCA scores space. In either visualization options, the molecules selected are shown in the 3D viewer. The results of the query can also be exported as a list of names or as a multiple structure file using the command VS>>Export query results. The format of the results is defined in the Export options - Format control. 159 7.ANNEXES 160 7.ANNEXES 3. Reference Manual 3.1. GUI overview The basic principles we used to design this GUI were: Organize the interface in separate task Assign each task to a separate main window tab Insert in the main window all the information needed for this task. Include there all the options and adjustable parameters Allow an easy access to the commands in the tools-bar The main GUI elements of Pentacle, from top to bottom are the menu bar, the tool bar, the main window organized in tabs, the log window and the status line. The commands of the menu bar and the tool bar, as well as the contents of the different tabs will be described in the following sections. The log window In Pentacle, most commands write a tracing message in the log window. This allows the User to review the progress of the work. In addition, every time the User selects a GRIND variable in the interpretation window, details about this variable (fields linked, distance in Å, etc.) are also shown in the log window. The log window is separated from the rest of the interface by a splitter bar. By moving this splitter the window can be hidden, thus assigning more space to the main window. 161 7.ANNEXES The contents of the log window are stored in a plain text file, called after the name of the project with the .log extensions. The status bar The left hand side of the status bar is used for presenting transitory messages. The two boxes located at the right are used to present the number of objects (compounds) loaded, the number of X variables and the number of Y variables. 3.2 File and Edit 3.2.1 File and Edit Commands New... Closes any project and restarts the program or CTRL+O) Open... (toolbar icon Loads a previous Pentacle project, restoring the status of the program exactly to the point where the project was closed. The command shows a dialog like this Where the user can select the project from a list, in which every project is identified by its name and date. The program list the projects located in a default directory, but this can be changed by pressing the top right button and selecting a different location. The location of this default directory can also be changed using Edit>>Preferences. or CTRL+T) Save snapshot... (toolbar icon Saves the current program status Load snapshot... (toolbar icon ) Loads a previously saved program status Manage snapshot Opens a dialog where the snapshots available for the current project can be deleted and renamed Exit Quits the program closing the current project 162 7.ANNEXES Preferences... Opens a dialog where the User can customize different aspects of the program. This dialog is carefully described in section 3.2.3. 3.2.2. Projects and snapshots Every time the User imports a series of compounds the program ask for a project name. All the information is stored under this name in the projects directory at real time. The user does not need to save explicitly the work, since the program updates automatically the information saved after every project change. icon or When the User opens a project (using the command File>>Open or the CTRL+O) the program retrieves the latest status before the User closed the program. Additionally, it is frequent that a user wants to save a particular result or model before proceeding with the work, so he can return to this particular status. In this case he icon or can save an snapshot with the command File>>Save Snapshot (or the CTRL+T). Then the program asks for a label which identifies the snapshot and stores a frozen image of the whole program status. Saved snapshots can be retrieved from a list using the command File>>Load Snapshot or the icon and then selecting the saved snapshot from a list. 3.2.3. The Preferences dialog Most of the program settings are associated to the open project. However, there are a number of settings which are persistent and independent of the current project. These can be defined in a preferences dialog accessible with the command Edit>>Preferences. The dialog is organized in four tabs: (a) Directories This tab is used to define the location of some important files and directories within your filesystem. System settings. The Grub File location describes to the location of grub.dat file which contains important settings for the computation of MIF. The project files can be stored in the program execution path (the location where the program is started) or in a fixed directory in which the User have full privileges for reading and writing files. Usually the first option is adequate for Linux users and the second more convenient for Windows users. Global directories. Paths to the directories where Templates, VS Databases and Models are stored for a wide community of users. Typically these are readonly directories where a company or a research group locates valuable databases and models. By default, these settings point to directories located within the program installation path. 163 7.ANNEXES Local directories. Paths to the directories where Templates, VS Databases and Models are stored for a local user. These must be directories for which the User has full privileges (reading and writing). By default, these are assigned to directories created in the User root directory (Linux) or in the User’s Documents and settings folder (Windows) (b) Results plot 164 Profile Marks. Defines the shape, size and colour of both the regular and selected marks (points) used in the 2D results plot 7.ANNEXES Profile lines. Defines the colour of the lines Heatmap. The results heatmaps use a scale between two extreme colours representing low and high energy values (by defaults red and blue, respectively). Here you can choose different colours. In addition, the colour assigned to the selected variables (columns) and molecules (row) can also be defined. c) 2D plots This dialog defines some visualization options of the 2D plots shown in the Interpretation tab. General. The user can define if the marks and bars used in the plots must include a border. In some bar plots representing many variables, this border might hide the colour of the bar, in particular when the plot is scaled to a small size. If you do not visualize correctly the colours in the plots try deselecting this option. Marks. Define the shape, size and colour of four types of marks: regular and non-selected (Marks), regular and selected (Marks selected), predicted objects non-selected (Mark predicted) and predicted objects selected (Marks predicted selected). Bars. Define the colour for the regular and selected bars in the bar-plots. (d) 3D viewer This dialogs defines diverse visualization options of the interactive 3D graphics used to represent molecules, nodes and distances. 165 7.ANNEXES General. Defines is representing or not “fog” and the background colour. When the fog control is checked, the objects located far away from the observed will be dimmed using the background colour. Rendering. Defines the style used to render the molecules (hide, wireframe, sticks, ball&sticks and CPK), if the hydrogen atoms must be rendered or not (hide, show) and the quality of the rendering (0-100%). Selecting as a rendering style sticks, ball&sticks or CPK, as well as selecting very high quality might slow down significantly the rendering in computers with old graphics cards. Size. Defines the size of the wireframe (line-width), sticks (radius) and balls (radius). All the measures are relative and expressed as percentages. Colour. The colour used to render the molecules. By default a property (the atom type) is used to render the molecules, but they can also be rendered using a uniform colour which can be chosen here. Atom labels. Defines how to label the atoms (no labels, atom type, atom name, atom number) and the colour of the labels. Descriptors. Here you can define the shape of the symbol used to represent the field nodes (Cross, cube and sphere) and their relative size. Selecting cross or cube might slow down significantly the rendering in computers with old graphics cards. In Windows, the colour of the symbols are more clear using the crosses. 166 7.ANNEXES 3.3. Molecules 3.3.1. Molecules commands in the toolbar or CTRL+I) Import series (icon Opens a dialog where the User can import compounds. The buttons on the right hand side allow selecting directly the mol2, kout or SDFiles files from a standard dialog (notice that you can select multiples files). The User can also select a file list: a simple text file which contains the names of the mol2 or SDFiles you want to import. If an SDFile is imported, the activity can be extracted from the SDFile specifying the activity field in the corresponding dialog line before importing the file. The names of the files selected will be shown on the left hand side window. In this window, every file imported will appear as a separate branch, from which they hang the names of all the molecules found inside. Please notice that you can select multiple files of multiple types in a single import instance. By default, the files are imported at the protonation state present in the file. If the User wishes he can define a pH and let the program setting all ionizable groups to an appropriate state. When the compounds belong to the same series and have not been pre-aligned, it is often useful to select the option that orients the compounds according to their moments of inertia. This produces a rough alignment of the compounds which simplifies the interpretation of the results. In addition, this pretreatment makes more efficient the spatial alignment provided by the CLACC algorithm, since the MIF obtained in pre-aligned compounds tend to be more similar (more free of gauge effects due to their diverse alignment within the 3D grid used for the MIF computation). Also in this dialog the User must assign a name to the project. From this moment, the program will store all the information relative to this series of compounds under this name, so it can be retrieved at a latter time. The assignation of a project name is compulsory. If no name is provided, the default name “New” will be assigned. If the project name already exists, the User will be prompted and if selecting yes, the project will be overwritten. Other selections are: 167 7.ANNEXES Database. When a virtual screening database is selected the operation mode of Pentacle changes to virtual screening mode. The compounds are imported and the GRIND descriptors are computed automatically, using exactly the same settings applied to obtain the database. Then, the new compounds are used as template structures which will be used to search the database for similar compounds. See the Query tab section of this manual for more information Model library. If a model is selected then Pentacle will work in prediction mode. The compounds are imported and the GRIND descriptors are computed automatically, using exactly the same settings applied to obtain the model. Then Pentacle will use this model to predict the activity of the molecules. See the Predict tab of this manual for further information. When the User is satisfied with the choices, he can press OK. The dialog closes and all the compounds are shown in the Molecules tab. Import activity list Once the compounds are already imported, the User can import a new variable representing experimental measures (like a binding affinity or DMPK measures) which will be associated to each compound. The command opens a standard file selecting dialog where the User can select any plain text file. Allowed formats of this file are: a column with all activity values, or two columns separated by a character (default blank), where the first column is the molecule name and the second the activity value. Once the file has been selected, a new dialog like the following is shown. In this dialog the User can preview the values and check if imported values are correct or not. This dialog allows selecting the separator between columns (if the file contains two columns), if it is necessary to use compound name matching or not and if it is necessary to compute the pK transform for the given values. When any of these options is changed, the Preview button is activated to reflect in the Preview window the effect of these changes. If the User agrees with the information shown he can press the Import button and activities will be imported and added to the table on the Molecules tab. 168 7.ANNEXES Please notice that the import button is selectable only when the number of imported lines is the same than the number of molecules. Import molecule names Once the compounds are already imported, the User can change their names. The command opens a standard file selecting dialog where the User can select any plain text file where the molecule names must be placed in the first column of file, one per line. If the number of names in the file is the same of the number of molecules imported, molecule names will be inserted without further confirmation. Import molecule classes Assign a class to each molecule. This command works like the Import activity list described above except for the fact that pK transform can not be applied. Import molecule weight Assigns a weight to every molecule for multi-objective Virtual Screening searches. This command works like the Import activity list command but for the fact that pK transform cannot be applied. This option is available only for Virtual Screening searches and not for QSAR applications. 3.3.2. Molecules tab The left hand side of the tab contains a table with a line for every imported molecules or a blank table if no compound has been imported so far. The lines contain the molecule name, the molecule status (ready, computed, error,), the charge of the molecules assigned by the GRID computation and (optionally) an activity value which could be used as the dependent variable in PLS regression analysis and a list of classes. In addition, every line starts with a checkbox which indicates if the molecule should be used or not for the next step of the analysis. Molecules can be sorted according to any of the columns, which is very convenient to sort the molecules by their activity values or to group them by class membership. Please notice that the molecule name, activity and class fields are editable. The compounds can be imported using the Molecules>>Import series command. It is also possible to drag-and-drop a file that contains the structure of the molecules, 169 7.ANNEXES which opens a dialog similar to the one presented by this command. This option is restricted to mol2, SDFiles and kout format files. Pressing the right mouse button shows a pop-up menu with the following commands: add molecules. Opens the Import series dialog to add additional molecules remove. Selected molecules will be removed from the list view text files. A dialog will show the contents of the file describing this molecule use >> all. Set all molecules in the list as used use >> clear all. Set all molecules in the list as not used use >> invert. Invert the use of the molecules. Molecules with used set before will be set as not used and viceversa. use >> selected. Set all selected molecules as used. use >> clear selected. Set all selected molecules as not used. The right half side of the window contains in a 3D viewer where the molecules selected in the table are shown. A splitter separates the 3D viewer and the molecule table, allowing to expand one part of the window over the other. The 3D viewer can also represent additional reference molecules using drag-anddrop on top of this window or using the option Add backstage in the pop-up menu. This is useful to load a common reference structure (here called backstage molecule), like for example the structure of the receptor or a template ligand structure. Please notice that unlike other molecules, backstage molecules will be represented until they were removed explicitly using the corresponding command in the pop-up menu. The aspect of this viewer is highly customizable using the Preferences dialog (Edit>>Preferences command). In addition, pressing the right mouse button shows a pop-up menu with the following commands: Toggle mode. Cycles the mouse mode between select mode and move molecule mode. When in select mode (the cursor is an arrow) you can click on individual atoms to show their names. When in move mode (the cursor is a cyclic double arrow) you can press and drag the mouse buttons to rotate (left button), translate (middle button) or resize (left+middle buttons or wheel) the molecule. Full view. Reorients the view to guarantee that all the elements of the graphic are visible Clean labels. Removes any label from the graphic. Add backstage. Opens a dialog for selecting and adding a backstage molecule. Clean backstage. Removes backstage molecules. Edit molstyle. Edits diverse rendering options for the current window only. Edit selection. Allows selecting one or more of the molecules included in the viewer, and editing diverse rendering options on the selected structures. 3.4. Descriptors 3.4.1. Descriptors commands Compute descriptors (icon on the toolbar or CTRL+C) Start the GRIND computation using the settings defined in the descriptors tab. 170 7.ANNEXES 3.4.2. Descriptors tab This tab is divided in two parts. The left hand side contains a list of predefined templates containing different pre-set method for the descriptors computation. The right hand side includes controls to define all the parameters involved in the GRIND computation, divided in three sequential steps: MIF computation, Discretization and Encoding. Inside the template list, global templates are represented with an Earth icon. They can not be removed, unless the User has permissions to write/remove in the global directory. If the User selects a template from this list all the GRIND parameters will be adjusted accordingly. By default Pentacle includes two templates; ALMOND classic and AMANDA classic, defining the settings to compute ALMOND-like GRIND descriptors and the new GRIND-2 descriptors, respectively. When any parameter from the right hand side is modified, the User can save the new setting as a new template using the Add new template button. When the User clicks in this button, a dialog querying for a template name will be shown and the new template will be made available under this name for now on. The right hand side is split in three columns that differentiate the three sequential steps involved in the computation of GRIND: MIF Computation, discretization and encoding. The columns are divided in two parts: one defining the method used and other defining the parameters of this method (standard and advanced). MIF computation. The present Pentacle version can computed MIF using GRID method only. This method only includes the following standard parameters: Grid step. Configures the grid step used to sample the box enclosing the molecules. Dynamic. Can be set to true or false, if the User wants to use dynamic GRID computation or not. When set to true, GRID used a more sophisticated analysis 171 7.ANNEXES to define the partial charges and the physicochemical properties of the ligand atoms. It is advisable to set it to true when analysing compounds including heterocyclic rings. Probes. List of GRID probes that will be used in the MIF computation. The current list contains DRY, O, N1 and the shape probe TIP. Consult the GRID manual for further information about these probes. MIF discretization Two methods of discretization can be used: ALMOND (Original discretization method included in program ALMOND and described in [1]) and AMANDA (the new and faster discretization method published in [2]). Each one has different parameters that will appear when the method is selected in the combo box. ALMOND presents only one standard parameter: number of nodes, which sets the number of representative nodes that ALMOND algorithm will extract from every MIF. In advanced options, there are included two additional parameters: Balance. Percentage of the importance given to the field values for selecting the nodes. Probe weights. Weight applied to each probe for filtering. AMANDA only includes advanced options: Scale factor. Factor used in the modulation of the number of nodes selected. Probe cutoffs: Cutoff value of for each probe. MIF nodes with an energy value under this cutoff will be discarded. MIF encoding Pentacle implements two alternative methodologies, MACC and CLACC: MACC is the standard methodology for encoding already included in GRIND software. CLACC is a new method to extract the most consistent variables inside a series of structurally related molecules. CLACC produces much better results than MACC and is able to produce a useful alignment of the compounds. It must be used only for series of structurally related compounds. MACC only has two parameters: Smoothing window. Indicates the step used to discretize the distances in a certain number of distance ranges or “bins”. Probe weights. Weights used in encoding for each probe. This weight produces an approximate normalization of the GRIND between 0 and 1. CLACC has the same parameters as MACC, but includes six basic and four advanced parameters more. Most of these parameters describe minor internal details of the algorithm which can be ignored by the user: 172 7.ANNEXES Basic: Use CLACC for alignment. Indicates if the CLACC method must be used for aligning the compounds. It is advisable to select this option unless the compounds were pre-aligned. Candidate Couples. Number of candidate node couples considered for selecting the best pair, representing a GRIND variable for a certain compound. Molecules used for clustering. Number of molecules used as core set in the clustering process. All the rest of the molecules are aligned on top of these. Alignment couples. Number of node couples used for the CLACC structural alignment. Alignment similarity. Cut off used for the alignment process. Remove non-consistent couples. Remove node couples from the encoding when their difference to the core selected is larger than the anchor distance cutoff parameter. Selecting this option restricts the model to strictly consistent variables, often increasing its predictive ability and interpretability. In series containing rather similar compounds, the use of this option is advisable. Advanced: Anchor distance cutoff. Distance cut off (in Å) for considering that two node couples belonging to two different compounds represent different information. DRY scaling factor. Weight assigned to the couples containing a DRY node, for the selection of the candidate couples. TIP scaling factor. Weight assigned to the couples containing a TIP node, for the selection of the candidate couples. Viewpoint smoothing window. Indicates the step used to discretize the space when viewpoints are created. 3.5. Results 3.5.1. Results commands Export Results This command presents a file selection dialog, where the User can define the name of a file where the results will be written and its format (GOLPE or CSV). In both cases, the data will be plain text, but the GOLPE format writes one value per line while the CVS format is more a tabular text. If you plain to import the format in Excel or other spreadsheet-oriented format probably the CVS format is more appropriate. 3.5.2. Results tab The left hand side of the window contains controls for selecting the method of 2D representation (profiles or heatmap) as well as the compounds and correlograms to be represented. With respect to the method of 2D representation: Profiles. Spectrum-like representation that depicts the values of the variables one after the other in the X axis, and their values in the Y axis. Suitable for visualizing the descriptors of a single compound or a few compounds. For large series the aspect is messy and the rendering could be very slow. 173 7.ANNEXES Heatmaps. Matrix-like representation in which every row represents a molecule and every column a variable. The values are colour coded: by default a red value represent low value and blue represent high values. Heatmaps are very useful to visualize all the series in a single plot. Peculiar compounds are easy recognizable by showing a different profile. If the compounds are ordered by activity or class, the heatmap is also useful to identify trends revealing some differences between compound on the top and in the bottom of the matrix which correspond to differences in activity of between classes. The Molecules window show a list of all the molecules processed. The molecules in this list can have three states: deselected, selected and highlighted. Only the molecules selected or highlighted are shown in the 2D plots and only the molecule highlighted is shown in the 3D plot. By default, when the profile method is used only one molecule is selected and when the heatmap method is used, all the molecules are selected (see figure above). The status of the compounds can be changed selecting them with the mouse, using the standard keyboard combinations (shift an click for multiple contiguous selections, CTRL and click for multiple selection). However, bear in mind that any number of molecules can be selected but only one can be highlighted. In addition, by pressing the right mouse button you can obtain a pop-up menu for selecting or deselecting all. The Correlogram window shows a list of correlograms. Every correlogram is a block of GRIND encoding the position of couples of nodes belonging to two types of MIF (either different or the same, for example DRY-DRY, N1-O, etc.). In this window you can select one or many correlograms. Depending on your selection, the 2D plot will show only one block or many blocks side by side. As in the previous window, by pressing the right mouse button you can obtain a pop-up menu for selecting or deselecting all. 174 7.ANNEXES On the right hand side of this main window you can see two regions separated by a splitter bar; the 2D representations on the left hand side and the 3D representations on the right hand side. By moving the splitter bar you can assign all the space to one of the representations or visualize both at the same time. 175 7.ANNEXES 2D representation This graphic reflects the selection of molecules and correlograms made by the User in the left hand side list of molecules and correlograms. If the profile method is selected, the plot will show a point for every compound and variable selected. The variable highlighted will link all these points by a continuous line. If more than one correlogram is selected, every correlogram will be shown side by side, labelled at the bottom and separated by a discontinuous line. (2D representations can be saved or printed pressing the CRTL+P keys when the graphic is selected) If the heatmap method is selected the plot will show a matrix-like representation where every row represents a compound and every column a variable. Like for the profiles, when more than one correlogram is selected, every correlogram is shown side by side, labelled at the bottom. By default, the heatmaps will adjust the height of the rows to fit the available space. When the series is large a scroller will be shown on the right hand side. Profiles and heatmaps are interactive. If the User clicks on any point, the corresponding molecule is highlighted and the name of the variable and its value are shown. There are also a number of useful keyboard shortcuts defined: The right and left arrow keys change the variable selected to the next or previous variable, respectively The up and down arrow keys change the molecule selected to the previous or next molecule, respectively. 176 7.ANNEXES 3D representation This viewer represents the highlighted molecule, surrounded by the nodes extracted from all the MIF belonging to the selected correlograms. For example, if the User has selected the correlograms DRY-DRY and DRY-N1 the graphic will depict the nodes extracted from the DRY (in yellow) and the N1 (in blue) MIF. If the User has selected a non-null variable the graphic represents a line linking the couple of nodes which generate this variable. 177 7.ANNEXES This window can also represent additional reference molecules by drag-and-drop the file on top of this window. This is useful to load a common structure (backstage molecule) which can be used to help in the interpretation. Please notice that unlike the structures of the other molecules, this will be represented until it is removed explicitly using the corresponding command in the pop-up menu. The aspect of this viewer and highly customizable using the Preferences (Edit>>Preferences command). In addition, by pressing the right mouse button shows a pop-up menu which was already described in the Molecule tab (section 3.3.2). 3.6. Models 3.6.1. Models commands Build PCA (or icon or CTRL+B) Builds a Principal Component Analysis (PCA) model, using the settings defined in the upper part of the Model tab; set of variables (Var set), scaling (Scaling) and number of principal components (PC). The results are shown in upper part of the Models tab and dumped to the log window. Depending on the dataset size and the performance of the workstation, the PCA building can take a few seconds or several minutes to complete. A progress dialog is shown. Build PLS (or icon or CTRL+L) Builds a Partial Least Squares (PLS) regression model and validates it by crossvalidation, using the settings defined in the lower part of the Model tab; set of variables (Var set), scaling (Scaling), number of latent variables (LV), cross-validation method (CV), number of random-groups (RG, only active if RG cross-validation method was selected), number of randomizations (Rand, only active if RG crossvalidation method was selected). The results are shown in the lower part of the Models tab and dumped to the log window. Depending on the dataset size, the cross-validation method chosen and the performance of workstation, the PLS building and validation can take a few seconds or several minutes to complete. Progress dialogs are shown. icon). FFD Variables selection (or Runs GOLPE-FFD variables selection using the setting defined in the lower part of the Models tab; number of latent variable (FFD-LV). Some details of the algorithm use the settings defined by the Advanced FFD dialog, accessible using the button located at the bottom of the Models tab: relation Combinations-variables (Comb/Var ratio) and percentage of dummy variables (%dummy variables). Please refer to the Model tab for further information. After applying FFD, the selected variables define a new set of variables, which is included in the Var set control in both the PCA and PLS sections of the Models tab. The sets of variables are called FFD1, FFD2, etc. adding the number of active variables obtained after every selection step. After a FFD selecting, the program builds automatically a new PLS model using this set of variables and presents the results on the Model tab. 178 7.ANNEXES Save Model for Prediction PLS models can be saved and stored in a library of models. These can be selected in the Molecules>>Import series dialog for projecting new series of compounds and predict their properties. When selected, a dialog ask for a suitable label and the model is then stored in the local Model Library directory. Interpretation Wizard (or icon) This command opens a specialised dialog for assisting the User on the chemical interpretation of QSAR models. The dialog analyses the current PLS model and 2 select a suggested model dimensionality (highest q ). Upon opening, the Interpretation tab loads the PLS coefficient plot with the selected dimensionality and the 10 most important variables were selected and listed in the dialog. The criteria for the incorporation of a certain variable in this list is a combination of the coefficient values, the presence of all the correlograms and the uniqueness of the information presented. The total number of variables shown can be changed in the dialog. The User can select individual variables by clicking on the list rows. When a variable is selected, it is highlighted in the PLS coefficient plot, and a new Var selected vs Var Y plot in opened in the lower region of the Interpretation tab. The column labelled as Comments is an editable text field where the User can take notes with the results of the chemical interpretation of each variable studied. These notes are stored with the project and can be retrieved when the project is reloaded. In addition, the User comments are dumped to the log window and file. Please notice that the results of the Models are related to three different tabs; the Models tab, the Interpretation tab and the Predictions tab. These are described in the following sections. 3.6.2. Models tab The window is divided in two sections; the upper section is used for PCA models and the lower part for PLS models. 179 7.ANNEXES PCA model The left part contains a section for presenting information about the model. Depending on the value selected for the show as control, the information can be shown as a table or as a plot of SSX & VarX. Table. When a PCA model is generated, this table is filled with information describing the model. Every line provides information for a single principal component (PC). The following information is listed: SSX: percentage of the X sum of squares explained by this PC SSXacc: accumulative percentage of the X sum of squares explained by the model VarX: percentage of the X variance explained by this PC VarXaac: accumulative percentage of the X variance explained by the model Plot SSX & VarX. The X axis represents the number of PC added to the model and the Y axis represent the SSXacc (diamonds marks) and VarXacc (triangles marks). Both values grow with the model dimensionality approaching the theoretical maximum value of 100.00. Both SSX and VarX represent the same information: how complete is the description of the X matrix provided by a PCA model of a certain dimensionality. By definition, SSX values are higher than VarX values (the latter are obtained from the former, dividing by the degrees of freedom). If you click in any mark of the plot, a label indicating the model dimensionality and the actual value of index is shown. 180 7.ANNEXES On the right hand side the GUI shows the number of objects (number of compounds) and the number of X variables, indicating in parenthesis how many of these variables are “active” (have a standard deviation > 10E-9). Below there are the following controls: Var set. The PCA can be run on the whole matrix or in a subset of variables. In the current version, the User can define subsets only by applying GOLPE-FFD variable selection. Every run will add an entry in this list but by default, the only option is “complete” (use all variables). Scaling. The PCA can be obtained using the GRIND directly (raw scaling) or applying a variable scaling that assigns the same importance to every variable (autoscaling). In the case of GRIND, the scale contains valuable information and therefore our advice is to apply always raw scaling. PC. Number of principal components to extract. The maximum number of PC which can be extracted is the number of objects minus one. This number guarantees that the PCA extracts the 100% of the information contained in the original X matrix. However, from a practical point of view, extracting two or three PC is enough for an exploratory analysis in most cases. When the values of the above controls were changed, any previous PCA model is deleted and the contents of the PCA model region are greyed out. Please press again button (or select the command Models>>Build PCA or press CTRL+B) to the generate a new model with the selected settings. PLS model The left part contains a section for presenting information about the model. Depending on the value selected for the show as control, the information can be shown as a table, as a plot of R2 & Q2 or a plot of SDEC & SDEP. Table. When a PLS model is generated, this table is filled with information describing the model. Every line provides information for a single latent variable (LV). The following information is listed: SSX: percentage of the X sum of squares explained by this LV SSXacc: accumulative percentage of the X sum of squares explained by the model SDEC: standard deviation error of the calculations. An index of model fitting on the training set. The lower the better. SDEP: standard deviation error of the predictions. An index of the model predictive ability obtained by cross-validation. The nearer to SDEC the better. 2 R2: contribution of the current LV to the coefficient of determination (r ) of the model. R2acc: coefficient of determination (r2) of the model. An index of model fitting on the training set. The nearer to 1.00 (theoretical maximum) the better. Q2acc: equivalent to r2 but obtained from cross-validation. An index of the model 2 predictive ability obtained by cross-validation. The nearer to r the better. Plot R2 & Q2. The X axis represents the number of LV added to the model and the Y axis represents the Q2 (diamonds marks) and R2 (triangles marks). The model fitting index R2 has a theoretical maximum value of 1.00 while the model predictive index Q2 must be lower than the corresponding R2 by definition. This plot might be helpful to decide the optimum model dimensionality, characterized by a maximum R2 and 181 7.ANNEXES Q2, even if the addition to the model of a LV contributing with only a small increase to these indexes (less than 0.02) must be considered with care. Plot SDEC & SDEP. This plot represents essentially the same information than the Plot R2 & Q2. In this case, the diamonds represent SDEP (model predictive ability index) and the triangles represent SDEC (model fitting index). SDEC values have a theoretical minimum value of 0 while SDEP could never be lower than corresponding SDEC. If you click in any mark of these plots, a label indicating the model dimensionality, and the actual value of indexes is shown. On the right hand side the tab shows the number of objects (number of compounds), and the number of X variables, indicating in parenthesis how many of these variables are “active” (have a standard deviation > 10E-9). Below there are the following controls: Var set: The PLS can be run on the whole matrix or in a subset of variables. In the current version, the User can define subsets only by applying GOLPE-FFD variable selection. Every run will add an entry in this list but by default, the only option is complete. Scaling: The PLS can be obtained using the GRIND directly (raw scaling) or applying a variable scaling that assign the same importance to every variable (autoscaling). In the case of GRIND, the scale contains valuable information and therefore our advice is to apply always raw scaling. LV: Number of principal components to extract. The maximum number of LV which can be extracted is the number of objects minus one. The model dimensionality of PLS models must be carefully chosen inspecting the fitting and predictive ability indexes (R2 and Q2). In principle you must select the number of LV for which the highest Q2 values are obtained, but if some of the LV produce modest increases (below 0.02) you should consider if this increases justifies a higher model complexity. The default setting of 5 LV should be enough in most cases. CV: Cross-validation method. The options are Leave-one-out (LOO), Leavetwo-out (LTO) and Random groups (RG). The former is probably the most standard method and has the advantage of being easily reproducible in different software while the last is a much more strict method, suitable when the training set has strong clustering. RG: (only selectable when the RG cross-validation method is selected). Number of groups to use for the cross-validation. A lower number of groups produce a stricter cross-validation. Rand: (only selectable when the RG cross-validation method is selected). Number of times that the objects must be assigned randomly to the groups. The higher the number the more precise are the results of the cross-validation. Use with caution, because this setting could slow down significantly the crossvalidation. When the values of the above controls were changed, any previous PLS model is deleted and the content of the PLS model region are greyed out. Please press again button (or select the command Models>>Build PLS or press CTRL+L) to the generate a new model with the selected settings. 182 7.ANNEXES At the bottom of this region there are two additional controls that affect the GOLPEFFD variables selection. FFD-LV: Number of latent variables to use in the GOLPE-FFD variable selection procedure. Usually the variables selection procedure works better if this number is under the optimum model dimensionality. The default setting of 2 is suitable in most cases. Advanced FFD: This button opens a dialog where the User can select advanced settings of the GOLPE-FFD algorithm. In most applications these settings require no User adjustment. Comb/Var ratio. The FFD algorithm works building a number of reduced models in which some of the variables were not included. The total number of models (Comb) computed is based on this setting. A ratio of 2.0 means that the model will build a number of model larger than twice the number of variables (actually, a power of two higher than this number) %dummy var. In order to estimate if the effects on the SDEP computed for the real variables are significant or not, similar effects are also computed for dummy variables added to the design matrix. These effects reflect high-order confusion and are useful as a contrast to test if the effects can be considered significant or not. Group by correlogram. This option was not implemented in the current Pentacle version. 3.6.3. Interpretation tab The interpretation of the PCA and PLS models is carried out in a separate tab called “interpretation tab”. This tab becomes active only when a model has been built. Unlike older GRIND handling software (ALMOND), Pentacle provides and integrate model interpretation interface where the 2D graphics representing variables and compounds as well as the 3D molecular graphics are arranged in definite positions and linked logically. 183 7.ANNEXES The top-left plot represents variables, the bottom-left plot represents compounds. The right 3D graphics depicts a representation of the variables and compounds selected by the User in which the variables will be represented as lines linking the couple of nodes used to obtain the selected variables on the selected compounds. The compounds will be represented as 3D molecular structures, surrounded by relevant grid nodes (the nodes extracted from the MIF used to obtain the selected variables). In this environment, there is always one object and one variable selected. Before the User interaction, the first variable and the first object appear selected by default. The user can make multiple selections in both 2D plots, either clicking the marks with the CTRL key pressed or dragging a box around objects or variables. The three regions are separated by splitter bars that permit to assign more or less space to them, but their relative location is always the same (2D on the left, 3D on the right, variables on top and compounds on the bottom). In every space we can visualize different types of plots, for either the PCA or PLS model. In the space assigned to variable plots we can represent: PCA loading plots. Loadings of the PCA. Can be represented as a 2D scatterplot or as a barplot. PLS loading plots. Loadings of the PLS. Can be represented as a 2D scatterplot or as a barplot. PLS weight plots. Weights of the PLS. Can be represented as a 2D scatterplot or as a barplot. PLS coefficient plots. Coefficients of the PLS model. They summarize all the contribution of the original variables to a model of a given dimensionality. They are represented only as barplots. In the space assigned to objects you can represent: 184 PCA scores. Scores of the PCA analysis. They depict a map of the compounds, where distance means chemical similarity. The plot also shows an ellipse 7.ANNEXES depicting a 95% confidence region. Objects out of this ellipse can be considered to deviate significantly from the rest of the series. PLS plot (TU scores plot). The classical X-scores (T) vs Y-scores (U) plot for the first LV. This plot represents the inner relationship between X and Y and is an interesting plot for diagnostic (outliers, non-linearities, quality of the relationship, etc.) PLS scores. Scores of the PLS analysis. They depict a map of the compounds, where distance means chemical similarity. The plot also shows an ellipse depicting a 95% confidence region. Objects out of this ellipse can be considered to deviate significantly from the rest of the series. VarX selected-VarY. Active only for PLS models. Represents a scatterplot of the selected variable versus the Y variable. Provides an indication of the correlation between these two variables. Experimental vs Calculated. Scatterplot of the experimental versus calculated values, using a model of the dimensionality provided by the setting of the X axis. Predicted vs Calculated. Scatterplot of the experimental versus predicted values (obtained from cross-validation), using a model of the dimensionality provided by the setting of the X axis. In most of these plots the X axis and Y axis settings define the PC or LV represented. All these plots contain functionalities accessible by pressing the right-mouse button. This opens a pop-up menu with the following options: Toggle mode. Cycles between the selection model and zoom mode. In selection mode the User can select a single object/variable by clicking on it or many by keeping the CTRL key pressed. Also the User can drag a box around a set of marks to select all of them. In zoom mode, the User can click any point of the plot to obtain a focused view of this region. If the User drags a box, then the plot zooms out to show only the region enclosed. Find. This command opens a box dialog where the User can enter the name of an object/variable. If it is found, it will be selected and highlighted. Export data. The contents of the current plot will be written to a simple plain text file from which they can be exported to third party graphic software. Expand. The plot is expanded to fit the whole model interpretation window. Fit view. After zooming out, this option recovers the original view. Colour scheme. In variable plots, the available schemes are Plain and Correlogram. In object plot the schemes are Plain, Class and Y var: • Correlogram scheme. The variables are colour coded according to the correlogram they belong. • Class. The value of the Class is used to assign contrasting colours to the objects. • Y var. The value of the Y variable is used to assign to the objects colours in a spectrum ranging from blue to red. Apart from these options: PgUp and PgDw key change the current variable represented in the X axis Shift-PgUp and Shift-PgDw keys change the current variable represented in the Y axis Up and Down Arrow key change the selected object to the next and previous one Left and Right Arrow keys change the selected variable to the next and previous one 185 7.ANNEXES 3.6.4 Predictions tab This tab has three sections: a table with predicted values, a 2D plot of the predictions and 3D viewer. Predictions Located in the top left side. Shows the predicted values for the imported molecules using diverse number of model components. The last line of the table shows the SDEP value for each component. If no experimental activity value has been imported for this series the SDEP is calculated using activity values of zero. The SDEP values will be refreshed every time activities were modified on the Molecules tab. 2D plot Located at the bottom left. These are object (compound) plots, representing the model predictions. Two kinds of plots are available: PLS Scores Plot and Y experimental vs Y predicted, both already explained on the Interpretation tab section. Either plot contains all the compounds of the original training plus the new compounds projected on top, shown in a contrast colour (usually red, even if it can be changed in the Preference dialog). 3D Viewer In the right hand side of the tab is a 3D viewer, which shows the structures of the selected compounds. As in all previous tabs, the diverse components of the tab are linked, and the selections of the user in the table or in the graphics are shown in the other parts. For example, if the user clicks on any compound in the table, this point is highlighted in the Plot and the molecular structure of the compound is shown in the 3D viewer. 186 7.ANNEXES 3.7. Virtual Screening 3.7.1 VS commands Compute query (icon of the toolbar) Virtual screening query is computed using the settings defined at the Query tab. Info database This command opens a dialog where the User can see some most important information about the database that he is using: number of compounds, computation options, etc. Add molecules to database When the user is querying a database using a set of compounds as templates it is possible to add the template molecules to the database. This option is interesting for “contaminating” a large database with compounds having known properties, for testing and evaluation purposes. Export query results The results of the query can be exported either as a list of compound names or as a multi-mol file, using the options defined in Query tab. PCA interpretation This command is only accessible when Pentacle is in virtual screening mode (when a series of template compounds has been imported). The command opens a dialog where it is possible to show the name and the structure of compounds with extreme values for the different PC used in the current Database. The purpose of this analysis is to understand which physiochemical properties are represented by every PC, by comparing the structures of the compounds with the highest and the lowest values for this PC. This dialog can also be used to define a set of weights to each component, which can be applied for the query latter if the “Manual Weights” option is selected in the Scaling control of the Query tab. 3.7.2 Query tab The Query Tab is divided in three parts: left hand side contains the options to define queries and to export query data, the middle part shows the result of the query in two alternative formats: as a table of compounds sorted by similarity and as a simplified representation of the PCA scores space. The right hand side of the tab contains a 3D viewer. 187 7.ANNEXES Query options Following options are the options that the user can configure before making a query: Method. Method used to evaluate the distance between the members of the database and the set of templates. The options are: Minimum Distance, Centroid or Weighted distance. If the template series contains only one compound, then all options produce equivalent results. The Weighted distance method applies the weight values assigned to every template molecule for multi-objective Virtual Screening search. Please notice that the weights can be negative, thus allowing to optimize simultaneously the distance to “good templates” and “bad templates”. Scaling. Weight assigned to every PCA component for computing the similarity. The options are: No, Normalized (all are given the same weight), Ratio (the weight is balanced using the dispersion of the PC values for the template set) and Manual Weights (as assigned in the PCA interpretation command). Results. Number of molecules to extract. Components. Number of components which must be used to compute the similarity. Explained variance. Accumulative variance explained for each component. The button Vs Quality opens a dialog with tools for evaluating the quality of the Virtual Screening searches. Vs Quality Dialog All the tools here require preparing in advance a test database containing active and decoying compounds. The names of the active compounds can be loaded using the Import button and are listed in the text field shown on the left hand side. This list can also be cleared using the button Clear. The program computes different standard quality indexes: BEDROC, Enrichment factor, Recall and Precision, using the settings specified by the user (value of alpha for BEDROC and the percentage for the rest of the indexes). A ROC curve is also represented at the bottom of the dialog. 188 7.ANNEXES The User only can modify the format of the data to export in the export options section. The two possible formats are: mol2: the structure of the molecules found are written in a multi-mol2 file. Txt: only molecule names are written in a plain text file. Results In the middle of the tab, the user can select between two methods of visualizing the results changing the value of “show as” control: Table. This table starts with the list of the molecules used as template. Then, it contains the results of the similarity search sorted by their similarity score. When any line is clicked, the structure of the molecule is shown on the right hand window. Pressing the right mouse button, the User can search for specific molecule names. This search is also accessible using CTRL+F and F3 (once it was defined, to find more search hits). Graphic. Graphical representation of the PCA scores (chemical space) covered by the database. This representation contains a coarse mosaic, with a 189 7.ANNEXES greyscale reflecting the density of compounds included within each tile. Dark tiles indicate densely populate regions of the database, while clearer tiles mean more sparsely populated regions. When any point is clicked, the structure of the molecule is shown on the right hand window. The user can select the PCA components represented in the graphic changing the values of X axis and Y axis. Pressing the right mouse button a pop-up menu appears containing the following commands: Toggle Mode. Cycle the mouse mode between “select mode” and “zoom mode”. When in select mode, you can click on individual molecules to show their names. When in zoom mode you can press and drag the mouse to make zoom in or zoom out in the representation. Expand. Graphic is expanded to the maximum size of the window Fit View. Adjust the size of the representation, allowing to see the whole space. 3D Viewer The right hand side of this tab contains a standard 3D viewer. It will show the 3D structures of the molecules selected in the table or in the graphic representation. 3.8 Tools 3.8.1. Built script. Opens a dialog where the user can set up a job for encoding a Virtual Screening database or for creating a project in command mode. Script type The user can select between creating a Virtual Screening database or creating a project. Files The compounds to include in the database are selected by adding one or several files. Common options Computation template Define the conditions of the GRIND computation by selecting a pre-set computation template. Database name or Project name A descriptive name for the new database or the new project. Execution after template creation If checked Pentacle computation will start as a new independent process in background, if not, this command will only write a computation template which must be run afterwards using a command like pentacle -mvs mytemplate.vs 190 7.ANNEXES This option is not available in Windows. Database Options Number of CPUs Indicates the number of CPUs used for the computation PCA components Total number of PCA components to extract Explained variance Minimum percentage of X variance which should be explained by the PCA components extracted. 191 7.ANNEXES Project Options Export Data Golpe Format Export the results obtained in the GRIND calculation to a file with GOLPE dat format. Export Data CSV Format Export the results obtained in the GRIND calculation to a file with a CSV format. 3.8.2. Database management Opens a Database maintenance dialog. When called, this command starts asking the user for the Database on which he will want to make management operations. Then a dialog like this is shown: Info. Shows the same database information shown by the Info database command. List compounds. List the name of all compounds inside database. Clone. Creates a new Database identical to the current one but with a different name. Defragment When compounds are removed from a database, they are simply de-indexed. In order to perform the actual removal of the structures and to recover the space you must call this command. Merge. Allows merging the actual database with another that can be selected from a list. Remove. Removes one or many molecules from the Database. The molecules can be selected from a dialog where a list of the molecules present is shown. 192 7.ANNEXES 4. References 1. Pastor M, Cruciani C, McLay I, Pickket S, Clementi S. GRid-INdependent descriptors (GRIND): a novel class of alignment-independent three-dimensional molecular descriptors. J Med Chem. 2000 Aug 24;43(17):3233-43. 2. Durán A, Comesaña G, Pastor M. Development and validation of AMANDA, a new algorithm for selecting highly relevant regions in molecular interaction fields. J Chem Inf Mod. 2008. 48(9):1813-23. 3. Durán A, Zamora I, Pastor M. Suitability of GRIND-based principal properties for the description of molecular similarity and ligand-based virtual screening. J Chem Inf Mod. 2009. 49(9):2129–38. 193 7.ANNEXES 5. Appendix: Command mode Pentacle can be used in command mode to compute GRIND automatically. The results can be exported, they can be used to build a Virtual Screening database, to query one of such databases or to extract predictions form models previously created. This option allows integrating Pentacle in scripts with different purposes. The command mode uses a plain text file to define the files and parameters of the computations. This file follows the next simple rules: Each new line is a new command that Pentacle can interpret. Blank lines are ignored. Lines which start with '#' are interpreted as comments and they are not parsed by Pentacle. The commands that can be used inside the configuration file are the following: Name input_file input_list mif_computation mif_discretization mif_encoding name num_cpu ph_value 194 Description Imports the structures described in this file. The formats supported are: SDFiles, and mol2. File type must be explicitly exposed in the command. Add a list of files for being imported. Molecule formats allowed inside the list are SDFiles and mol2 Method used in MIF computation. At this development step only can be used GRID. It is a mandatory command Method to be used in MIF discretization step. Options are: AMANDA and ALMOND. It is a mandatory command Method used in MIF encoding step. Options allowed are MACC and CLACC, but in virtual screening MACC option is the only one allowed. It is a mandatory command Name used for the database. It is a mandatory command Number of CPUs that Pentacle will use for the computation. Defining more CPUs than the actual serve CPUs could slow down the computation. Only can be used on Virtual Screening Defines a pH value which will Example input_file mol2 qf2345.mol2 input_list list.lst mif_computation grid mif_discretization almond mif_encoding macc2 name drugbankDB num_cpu 3 ph_value 5 7.ANNEXES probe dynamic step probes_cutoff probes_scale filter_nodes filter_weight filter_balance macc2_window macc2_weight clacc_window clacc_weight clacc_candidate clacc_anch_cut clacc_align_coup clacc_viewpointwindow be used by Pentacle to adjust ionizable groups to an appropriate state. Allowed values are between 0 and 14 Adds a probe to GRID MIF computation. Allowed values are DRY, O , N1 and TIP Indicates if the GRID parametrization should be made using dynamic mode or not. Allowed values are yes or no Defines the distance in Å between two GRID points. Cutoff value for one probe when MIF discretization method is AMANDA Scale factor value for probes when MIF discretization method is AMANDA Number of nodes to extract when MIF discretization method is ALMOND Weight applied to one probe when MIF discretization method is ALMOND Balance applied when MIF discretization method is ALMOND Smoothing window used to obtain the encoding with MACC method Weight applied to one probe when encoding method is MACC Smoothing window used to obtain the encoding with CLACC method Weight applied to one probe when encoding method is CLACC Number of candidate node couples considered for selecting the best pair, representing a GRIND variable for a certain compound Cutoff value in Å to consider that two couples are different. Number of node couples used for the CLACC structural alignment. Indicates the step used to discretize the space when viewpoints are created. probe DRY dynamic yes step 0.5 probes_cutoff DRY 2.1 probes_scale 0.5 filter_nodes 100 filter_weight DRY 0.7 filter_balance 0.7 macc2_window 1.8 macc2_weigth O 1.5 clacc_window 0.8 clacc_weight DRY 0.1 clacc_candidate 30 clacc_anch_cut 2.5 clacc_align_coup 30 clacc_viewpointwindow 0.8 195 7.ANNEXES clacc_simi_cut clacc_use_remove clacc_use_alignment clacc_scale clacc_maxmol export_data pca_components pca_varexplain vs_num_results vs_database vs_method 196 Cut off used for the alignment process. Remove couples from the final result when their difference to the core selected is larger than the clacc_anch_cut. Allowed values are yes or no. Indicates if the molecules must be aligned or not (external alignment) by the method. Allowed values are yes or no. Weight assigned to the couples containing a the nodes of the give probe (DRY or TIP), for the selection of the candidate couples Number of molecules used as core set in the clustering process The results of the GRIND calculation are exported in this format. Allowed values are dat or csv Number of components used to create the virtual screening database or to extract compounds in a virtual screening search. Its value must be lower than the number of compounds minus one. Only can be used on Virtual Screening Minimum percentage of variance explained by the extracted PCA components. Only can be used on Virtual Screening Number of molecules to be extracted from the database in a query. A Value of -1 indicates extracting all the compounds. The second value indicates if the molecules are extracted in mol2 format of txt. Name of the database used for the query. The second value indicates if Pentacle must search this database name in the local or in the global database directory. Extracting method for the search. Parameters can be minim (minimum distance search) or centroid. clacc_simi_cut 2.5 clacc_use_remove yes clacc_use_alignment no clacc_scale DRY 0.4 clacc_maxmol 40 export_data csv pca_components 12 pca_varexplain 80 vs_num_results -1 txt vs_database db115PC local vs_method minim 7.ANNEXES vs_scaling model export pred Scaling method for the method. Allowed values are no, norm and ratio Model name where predictions must be done. The second value indicates if Pentacle must search this name in the local or in the local model directory. Indicates that predicted values must be exported. vs_scaling norm model model143 global export_pred Please notice that some of these commands are not required and it is possible to start a computation without defining them. Options related with MIF computation (GRID), including used probes, discretization (ALMOND and AMANDA) and encoding (MACC, CLACC) could be omitted and Pentacle will use default options. The simplest way to create a command file is to use one of the template files provided in the distribution and adapt it to your specific needs or to use the build script utility. Command line options pentacle -c template. Create a project for computing GRIND descriptors pentacle -vs template. Create a virtual screening database using only one processor pentacle -mvs template. Create a virtual screening database using the number of processor indicates by num_cpu. pentacle -qvs template. Runs a query on a Virtual Screening database. pentacle -pred template. Obtains a prediction from a model. pentacle -ddb file. Defragment the database indicated in the file with the whole path. pentacle -mdb file. Merge the databases indicated in the file with the whole path. 197