1
Statistical Process Control
3.
Histograms
Another way of presenting data is a histogram, or bar chart. Histograms
are special types of frequency distributions.
Histograms are the recommended method of displaying data because
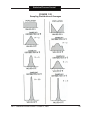
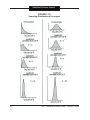
they aid in analyzing the distribution of data for centering, spread, and
shape. Histograms can be used to determine whether the process is
operating the way it is desired. Histograms can also be used to identify
the factors that cause the process to vary from what is wanted.
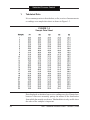
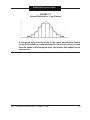
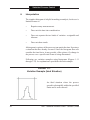
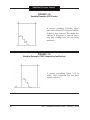
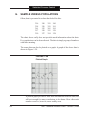
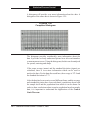
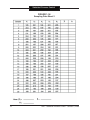
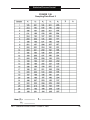
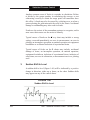
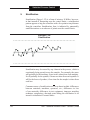
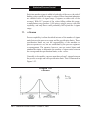
A histogram created from the data in Figure 1-3 is shown as Figure
1-5.
FIGURE 1-5
Histogram
The histogram in Figure 1-5 is constructed with the measured
dimensions (collected data) shown on a horizontal line, and the
frequency of the readings shown on a vertical line.
30
AIDT - Statistical Process Control - October 5, 2006