1
HelpAndManual_unregistered_evaluation_copy
VQMA
Video Quality Measurement Software
Version 2.4.3
User Manual
HelpAndManual_unregistered_evaluation_copy
VQMA
Video Quality Measurement Software
by VideoQ Inc
Software Video Analyzer to measure the quality of captured and
streamed video.
Ideal tool for video development labs, software developers and
high volume manufacturing instantly revealing your video capture
device performance.
HelpAndManual_unregistered_evaluation_copy
VQMA User Manual
© 2005-2009 by VideoQ Inc, all rights reserved
All rights reserved. No parts of this work may be reproduced in any form or by any means - graphic, electronic, or
mechanical, including photocopying, recording, taping, or information storage and retrieval systems - without the
written permission of the publisher.
Products that are referred to in this document may be either trademarks and/or registered trademarks of the
respective owners. The publisher and the author make no claim to these trademarks.
While every precaution has been taken in the preparation of this document, the publisher and the author assume no
responsibility for errors or omissions, or for damages resulting from the use of information contained in this document
or from the use of programs and source code that may accompany it. In no event shall the publisher and the author be
liable for any loss of profit or any other commercial damage caused or alleged to have been caused directly or
indirectly by this document.
Author: Victor Steinberg
Printed: May 2009 in Santa Clara, California, USA
Special thanks to:
All colleagues at VideoQ, Philips Semiconductors and nVIDIA, who contibuted
to this product development
Revision History
Revision Date
Description
1.1
2005, January 14
Beta
2.2
2005, October 06
Release
2.3
2006, March 31
Release
2.4.1
2008, August 28
Release
2.4.2
2009, April 26
Release
2.4.3
2009, May 12
Release
VQMA User Manual
Table of Contents
1 Introduction
..............................................................................................................
2
2 Supported
..............................................................................................................
File Formats
4
3 Software
..............................................................................................................
Installation and General Setup
5
3.1 Test Pattern
.......................................................................................................................
Files and DVDs as Video Source
6
3.2 Capturing
.......................................................................................................................
and Saving Video Data File
8
4 Running
..............................................................................................................
VQMA in Windows GUI mode
10
4.1 Menu -.......................................................................................................................
File
10
4.2 K-rating,
.......................................................................................................................
Y/C Gain and Y/C Delay page
12
4.3 Menu -.......................................................................................................................
OnLine
13
4.4 Menu -.......................................................................................................................
View
13
4.4.1 Viewing
.................................................................................................................................................
Test Result Pages
14
4.4.2 Test Summary
.................................................................................................................................................
page
15
4.4.3 Staircase
.................................................................................................................................................
Display page
16
4.4.4 Diff Phase
.................................................................................................................................................
and Diff Gain pages
17
4.4.5 Frequency
.................................................................................................................................................
Response page
18
4.4.6 UV Vector
.................................................................................................................................................
Graph page
19
4.4.7 Noise.................................................................................................................................................
Measurement page
20
4.5 Menu -.......................................................................................................................
Options
21
4.6 Menu -.......................................................................................................................
Help
21
4.6.1 About.................................................................................................................................................
VQMA program
21
4.6.2 Short.................................................................................................................................................
Guide
22
5 Running
..............................................................................................................
VQMA in DOS Mode
23
5.1 Command
.......................................................................................................................
Line Parameters
23
5.2 Test Results
.......................................................................................................................
Presentation
24
6 Customization
..............................................................................................................
and Editing of INI Files
27
7 Terms
..............................................................................................................
and Abbreviations
28
© 2005-2009 by VideoQ Inc, all rights reserved
VQMA User Manual
1
Introduction
2
Introduction
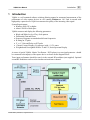
VQMA is a self-contained software solution allowing manual or automated measurement of the
performance of video capture devices in a PC running WindowsTM OS. Used in cascade with
high quality capture device VQMA can measure the quality of the incoming video signal.
System Requirements:
· Windows 2000, XP or higher
· About 1250 Kb of disk space
VQMA measures and display the following parameters:
·
·
·
·
·
·
·
Black and White levels of Grey Scale pattern
Differential Gain and Phase
Frequency Response on standard multi-burst frequencies
K-rating on 2T pulse
Y vs. C, Gain and Delay on 20T pulse
Chroma Vectors Display (Vectorscope) with +/-2.5% zones
Weighted and Unweighted SNR for Y and UV, Noise Spectrum Display
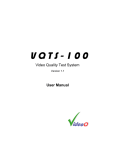
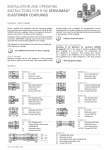
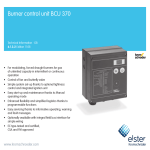
A source of special VQMA Matrix Test Pattern - DVD player(s) or test signal generator - should
be connected to the input(s) of the capture device as shown on the diagram below.
Tuner input performance should be tested via the external RF modulator (not supplied). Optional
second RF modulator can be used to simulate an interference channel.
© 2005-2009 by VideoQ Inc, all rights reserved
3
VQMA User Manual
Introduction
Captured test pattern video data should be stored on fast access media, e.g. HDD, in a file of
suitable format, e.g. *.AVI file containing at least 8 consecutive uncompressed video frames in
UYVY or YUV2 format with native 4:2:2 resolutions:
· 720 x 480 or 720 x 486 for NTSC
· 720 x 576 for PAL or SECAM
VQMA analyzes YUV video data stored in this file, e.g. in .AVI video clip, and produces detailed
test report.
Measured values are automatically checked against values stored in the .INI file, e.g. values from
the Microsoft MCE requirements. Editable .INI files allow customization of the test requirements
to match the performance of particular devices or board types/models.
The accuracy of measurements is typically better than 1/10 of the target tolerance range, e.g.
typical errors are about 0.5% for video levels and about +/- 0.1 dB for frequency response.
Analysis of decompressed video, e.g. after MPEG encode-decode, is also possible, if the output is
presented in 4:2:2 YUV format compatible with VQMA software.
Horizontal and vertical image position errors of few pixels do not affect VQMA results accuracy.
On the other hand, scaling and/or cropping of captured video data may produce very big errors,
therefore they should be switched off during VQMA test.
Partial test procedures result in several partial “pass/fail” flags corresponding to each particular
parameter, such as white level, or Y/C delay. These flags are combined together using logical
AND function, thus providing a global single bit “pass/fail” flag.
VQMA software can be launched and used in two modes:
· Windows GUI mode
· DOS box mode
Windows GUI mode
Starting VQMA.EXE without any command line parameters brings up standard Windows GUI.
This mode is intended for laboratory design, adjustments and verification procedures with
measurements results presented in graphical format suitable for printing, e.g. creating PDF
document. In Windows GUI mode it is possible to produce printed reports with more details,
containing all results, including diagrams and screenshots. Short-form *.TXT or *.CSV
machine-readable report files are also available and can be saved as required.
DOS box mode
DOS box mode (under Windows) requires command line parameters and usually involve running
batch file in the background (unattended) mode.This provides log file with all important test
results presented in machine readable format for inclusion in higher level automated QA systems.
In DOS window mode, test results are always presented as a set of comma separated values
within a report file of *.TXT or *.CSV format.
© 2005-2009 by VideoQ Inc, all rights reserved
VQMA User Manual
2
Supported File Formats
4
Supported File Formats
VQMA.EXE can open any one file of the following types:
*.AVI
AVI video clip
this is default extension for dialog box, recommended mode
*.YUV Single frame of raw YUV data
suitable for quick video parameters check, also saving HDD space
*.NTS Multiple frames of raw YUV (NTSC) data without any header or wrapper
used mainly in the design lab environment, instead of .AVI
*.PAL
Multiple frames of raw YUV (PAL/SECAM) data without any header or wrapper
used mainly in the design lab environment, instead of .AVI
File name extensions directly control VQMA operation. All other file types and extensions are
not supported.
To provide for full and accurate measurement any input video file should contain a number of
captured TV frames with uncompressed YUV data of VQMA test pattern. Total duration of
.AVI, .NTS or .PAL video file should be equal or greater than 8 TV frames. VQMA analyzes
only first 32 frames; larger sizes of input files are acceptable, but it does not improve the VQMA
measurement accuracy.
All video quality parameters can also be measured by fast analysis of single-frame .YUV files, but
with significantly lower accuracy.
In any case, video file should contain video data of VQMA test pattern arranged as 4:2:2 UYVY
... ("UYVY") or YUYV... ("YUY2" also known as "YUV2") multiplex of 720 pixels (1440
samples), of 480 or 486 TV lines (NTSC) or 576 TV lines (PAL). Data should conform to 8 bit
D1 (601) quantization scale: Black_Y = 16d, White_Y = 235d, Grey_UV = 128d .
Currently, there are only two FOURCC codes supported: UYVY and YUY2.
There is also a special file name reserved for .YUV files which contain only noise on flat grey
background. If the file is saved as "noise*.yuv" (any name starting with "noise", e.g.
"NOISE32.YUV"), then VQMA performs noise measurement by processing multiple lines of a
single video frame instead of analysis of multiple video frames. All other test procedure are in this
case not applicable, so the corresponding menu items are disabled and shown in grey.
It is possible to use other test patterns, e.g. full field 75% color bars or modulated ramp, but with
limited functionality. Some pages of VQMA display still can be used, e.g. Staircase Display Page
(it will show any waveform found in TV lines of Band 4 of VQMA matrix pattern). VQMA does
not support measurement of video quality parameters on any other test pattern, except the original
VQMA matrix test pattern.
© 2005-2009 by VideoQ Inc, all rights reserved
5
3
VQMA User Manual
Software Installation and General Setup
Software Installation and General Setup
1. Install VQMA software as follows:
Create a folder on the PC hard drive, for example "c:\VQMA", and copy there the following
files:
1. VQMA.EXE
Main executable
Note that in some versions the executable file name can be shortened to VQM.EXE
2. VQNTSC.INI
Optional customized configuration file for NTSC standard
3. VQPAL.INI
Optional customized configuration file for PAL/SECAM standard
If these two .INI files are not found in the program folder, then they are created automatically by
VQMA.EXE with the default tolerance values. This happens when the video data file of the
corresponding standard is opened first time, e.g. VQPAL.INI will be created only if necessary when PAL standard .AVI file has to be processed.
VQMA is a copy protected program using uniquely encrypted USB dongle, matched with the
copy of your executable as installed. This dongle must be inserted into USB port of the PC
where VQMA is installed whenever the VQMA.EXE is running. In case of loss or damage of
this USB dongle, VideoQ reserve the right to revoke the license.
Please note that when the dongle is not connected, the protected application will stop running.
If you purchased multiple copies of VQMA please be sure to use the dongle with the same
registration number as the copy number on the distribution CD. Installation on networked
computer system (LAN or WAN) is not possible with this version.
2. Connect VQMA test pattern source to the appropriate input of capture device
3. Run the appropriate capture software to create .AVI (recommended) or .YUV file with
video data
4. Run VQMA program to measure the performance of the device under test
Repeat steps 3 and 4 as required.
Removing VQMA software is quite simple. VQMA does not make records in Windows system
registry, except the location of the last opened video data file. Therefore, to remove VQMA from
the system it is enough to delete the executable file VQMA.EXE.
© 2005-2009 by VideoQ Inc, all rights reserved
VQMA User Manual
Software Installation and General Setup
6
3.1 Test Pattern Files and DVDs as Video Source
There are two .MP4 video files supplied – one for NTSC and one for PAL/SECAM, providing
the reference matrix test pattern video source on the CVBS, S-Video (Y/C) and/or YPbPr (YUV)
outputs of a professional or semi-professional video play-out card (if such card is installed on a
PC).
Note that typically Video Out signals provided by video players via PC graphic adapter or
graphic card on CVBS output are not suitable for VQMA analysis.
There are also two DVD disks supplied – one for NTSC and one for PAL/SECAM, providing the
reference matrix test pattern video source on the CVBS, S-Video (Y/C) and/or YPbPr (YUV)
outputs of any good quality DVD player
If necessary, CVBS signal from video play-out card or DVD player can be converted into RF
signal via optional external modulator (not supplied).
Note that video levels are measured as supplied by the actual source. Some DVD players may output
non-calibrated video, with up to 25% errors of sync pulse level. This may affect the test results. Higher
degree of accuracy can be achieved by using the professional hardware-based well-calibrated test signal
generator loaded with VQMA test matrix pattern.
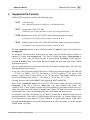
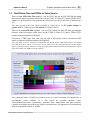
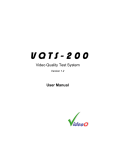
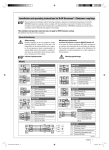
First (topmost) band of VQMA test pattern serves for visual assessment of monochrome or
non-saturated colors rendition. It is also useful for revealing timebase errors,
scalers/deinterlacers/codecs performance, patterned noise, interferences and other artefacts.
Currently, this band is not used for any objective measurements. The appearance of this band may
differ in customized versions of VQMA.
© 2005-2009 by VideoQ Inc, all rights reserved
7
VQMA User Manual
Software Installation and General Setup
The upper band layout of actual test patterns encoded as .MP4 files or recorded on DVD as .VOB
(MPEG2) files may slightly differ. It does not affect the program performance and the accuracy of
the results.
Five lower bands of the matrix serve for simultaneous (parallel) analysis of all parameters
describing the performance of signal transmission chain or the signal capture device under test:
Note that some parts of VQMA matrix pattern contain illegal colors, e.g. modulated ramp
contains zero Y value pixels with non-zero UV values - so called "colored black". For this reason
any conversion of VQMA test video data into RGB or BMP format, or any other processing
forcing color legalization, is not acceptable. After legalization, even if the test pattern look the
same, it cannot be used for measurements.
Important: because SECAM color subcarrier is frequency modulated, the differential phase and
differential gain distortions do not affect the demodulated YUV data on modulated ramp, i.e. on
Band 6 of matrix test pattern. Thus, in case of demodulated SECAM signal these two parameters
are irrelevant and should be ignored.
SECAM decoders typically use low-pass or notch filters in demodulated luminance channel,
which implies special (not so strict) target values for VQMA automatic analysis of frequency
response and K-rating, i.e. measurements of Bands 3 and 5.
Customized versions of NTSC and PAL/SECAM DVDs supplied with the program may contain
the VQMA Test Matrix as above plus some other test patterns; these are just useful extras, not
related to VQMA measurement process.
© 2005-2009 by VideoQ Inc, all rights reserved
VQMA User Manual
Software Installation and General Setup
8
3.2 Capturing and Saving Video Data File
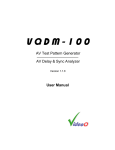
1. Supply CVBS, S-Video, YPbPr or RF signal of the VQMA matrix test pattern to the
appropriate input of capture device under test.
2. Run any capture software driver or Direct Show graph, available on the system, e.g. "AMCAP":
2.1. The specified capture time should be equal or greater than 8 TV frames,
recommended capture duration is slightly more than 32 frames, e.g. 2 seconds
Note that capturing video clip of longer duration is acceptable,
but it does not improve the accuracy of VQMA results
2.2. Select file format as uncompressed .AVI with FOURCC code = UYVY or YUV2
2.3. Select native (full) resolution: 720 x 480 or 720 x 486 for NTSC, 720 x 576 for PAL or
SECAM
All this actions should be done by user prior to the measurement and analysis stage, described in
the following sections.
The process of capturing new AVI file should be finished and file closed before the "open"
("input") function of the VQMA program is performed. It is possible to give the AVI file any
name of user choice and store it in any folder on any local hard drive.
It is not recommended to use network drives because of the high bandwidth required for normal
operation of the software.
VQMA remembers the location of the folder with last opened file, so "File Open" dialog defaults
to this location.
Manual or automatic update of captured video data and corresponding update of test results are
possible at the rate of about 2-3 seconds – this is typical capture-plus-analysis time interval for
medium speed PC.
The update of captured *.AVI data file, renaming, appending and/or overwriting of the relevant
files, as well as systematic logging of the test results in DOS mode should be organized by the
user, e.g. in form of script or batch file.
VQMA tool is also capable to process other video file formats and test patterns, as described in
the "Supported File Formats" section, but some analysis functions will be not available or
disabled.
For example, VQMA noise measurement algorithm requires access to multiple frames of matrix
test pattern, but it can also be done by processing single frame of uniform grey field.
Quite often, for calibration and debugging purposes, user needs just a valid display of Y
waveform plus UV vector graph. In such case, it is enough to provide .YUV file containing single
frame of VQMA matrix or any other .YUV file containing standard 75% color bars pattern, e.g.
SMPTE bars or EBU bars on red.
© 2005-2009 by VideoQ Inc, all rights reserved
9
VQMA User Manual
Software Installation and General Setup
© 2005-2009 by VideoQ Inc, all rights reserved
VQMA User Manual
4
Running VQMA in Windows GUI mode
10
Running VQMA in Windows GUI mode
Click on the VQMA executable icon, or launch VQMA.EXE with no parameters specified in the
command line, to open GUI with standard Windows menus and dialog boxes.
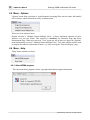
4.1 Menu - File
This menu should be used first - after launch of VQMA.EXE:
User can perform standard Windows functions, - Open File, Print, Print Preview and Exit.
Sub-menu "Open File" invokes standard "File/Open" Windows dialog box. User can browse
folders to find and open pre-captured video file. Default file type is .avi. Sub-dialog "Files of
type:" allows opening files of other types: single frame .yuv files or multi-frame .nts /.pal.
In "Print Preview" sub-menu each of eight on-screen pages of VQMA test results can be
previewed and printed separately.
VQMA.EXE automatically set printer page orientation to "Landscape". Manually switching
printer into "Portrait" mode may result in unreadable print-out.
It is advisable to use PDF writer, e.g. "PDF Factory" to create electronic reports of VQMA test
results; paper copies can also be printed if necessary. Default name for VQMA PDF Report file is
suggested by printer and typically include drive letter, folder name and .AVI file name.
Menu "File" also includes two VQMA specific functions:
· "Default Format"
this allows to toggle between two alternative formats of .YUV/.NTS/.PAL files to be
opened,
but does not affect the processing of .AVI files, which is controlled by FOURCC code
read from AVI file header
· "Save Report"
this allows user to browse folders and save short text report in .TXT or .CSV format.
User can select any folder and file name for this report. Format of saved report is similar to DOS
mode output, described in the correspondent section of this manual, but in Windows mode there
© 2005-2009 by VideoQ Inc, all rights reserved
11
VQMA User Manual
Running VQMA in Windows GUI mode
is one extra line showing full name of input file.
© 2005-2009 by VideoQ Inc, all rights reserved
VQMA User Manual
Running VQMA in Windows GUI mode
12
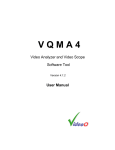
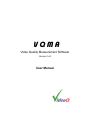
4.2 K-rating, Y/C Gain and Y/C Delay page
This page displays averaged waveforms of Y , U and V signals selected from the 5th band of
VQMA matrix test pattern.
It also shows the measurements results for three parameters related to this 5th band:
1. K-rating, in %, measured on 2T pulse (white needle pulse)
2. C vs. Y Gain, in dB, measured on 20T composite pulse
3. C vs. Y Delay, in ns, measured on 20T composite pulse
Vertical scale is D1 8 bit, Reference Black = 16, Reference White =235.
Horizontal co-ordinate: Y pixel count from 0 to 719.
Black needle pulse is present on the display, but its distortions are not included in the K-rating
calculation. However, this particular test signal component is useful for estimation of quadrature
and other non-linear distortions. If its shape correlates well with the shape of its counterpart of
opposite polarity (white needle pulse), then the distortions are rather linear. In case of strong
non-linearity, caused, for example, by protective black or white level limiter, the overshoots of
two needle pulses will look quite different.
Display of U (blue) and V (red) components of demodulated 20T composite pulse allows to
distinguish between linear and non-linear causes of Y/C delay errors. From the plot above it could
be seen that there are both types of distortions present. Both U and V are delayed wrt Y, but V
delay is much higher, probably because of the chroma bandwidth asymmetry. The most probable
reason - bad design, lack of tuning or malfunction of the tuner. Less probable reason - wrong
settings of the composite decoder controls.
© 2005-2009 by VideoQ Inc, all rights reserved
13
VQMA User Manual
Running VQMA in Windows GUI mode
4.3 Menu - OnLine
This menu item is reserved for future use - to control video capture devices installed and
recognized by Windows.
Current version does not support "Live Capture" mode, so this menu is shown in grey.
Menu contains three commands:
· "Start Live Mode" (Start Capture)
· "Stop Live Mode" (Stop Capture)
· "Auto"
Default is "Auto", in this mode the on-line capture process is repeated indefinitely; video data
refreshment rate is controlled by VQMA program. This allows video data capture process to restart immediately after the end of current cycle of measurements.
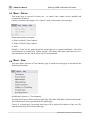
4.4 Menu - View
This menu allows selection of Test Summary page or partial test result pages as described in the
following sub-sections.
Default page selection is "Test Summary".
Test Date and Time are shown at the top and Video File Name (full path) is shown at the bottom.
This information is always presented on all VQMA pages.
Choice of selected page is persistent, same page will be shown after analysis of any new file,
until the selection by user of some other page.
© 2005-2009 by VideoQ Inc, all rights reserved
VQMA User Manual
Running VQMA in Windows GUI mode
14
4.4.1 Viewing Test Result Pages
VQMA produces several result presentation pages which are displayed one at a time, each page
containing detailed report about the particular type of video distortions:
· Test Summary table
shows all results, plus partial and global "Pass/Fail" flags
· Staircase display
shows waveform, Black and White levels
· Differential Gain
also contains DG profile display
· Differential Phase
also contains DP profile display
· Frequency Response
also contains multi-burst waveforms display
· K-rating, Y/C Gain and Delay
also contains 2T/20T pulse waveforms display
· UV Vectorscope Display
· Noise Measurement
shows weighted and unweighted SNR for Y and UV channels , Noise Spectrum Display, Noise
Pattern Display
User can select any page from "View" menu. At the first run of VQMA.EXE the "Summary"
page is selected; it also can be selected by user at any time later.
At any time moment only one of these pages is displayed. If the user selects another video file,
VQMA stays on the previously opened page, allowing fast performance comparison of different
devices or even complete systems, e.g. made by different manufacturers. This feature is also
useful for adjustment or comparison of different configurations or modes, e.g. comparing the
tuner performance with CVBS input, or CVBS input performance vs. YPbPr input.
For example, user may open file "Device_1.AVI", select "Noise Measurement" page, review it,
then open another video file, e.g. "Device_2.AVI". In this case VQMA stays on "Noise
Measurement" page, thus allowing quick (nearly instantaneous) visual comparison of interference
levels and noise performances of two capture devices.
Even after print-out of noise spectra and noise patterns VQMA will stay on "Noise Measurement"
page until the selection by user of some other page, e.g. "Frequency Response".
Test results vary depending on type of averaging filter selected in the "Options" menu. Switching
the averaging filters allows to estimate the influence of noise on the actual results. Current status
of averaging is shown in the upper right corner of every page.
© 2005-2009 by VideoQ Inc, all rights reserved
15
VQMA User Manual
Running VQMA in Windows GUI mode
4.4.2 Test Summary page
The table shows the results of all partial tests, whilst the most important "global" result is
displayed in the upper left corner. This is shown as one word, which can be either "Passed" in
green or "Failed" in red; it is produced by logical AND function of partial test result flags of the
table.
Leftmost column contains the partial test name (name of the measured parameter).
Next two columns shows measured value of the particular parameter and unit of measurement.
The "Target" column shows actual test tolerance values read from .INI file.
The rightmost column of the table shows partial test results. These are displayed as green ticks, if
partial test passed, or red crosses, if partial test failed.
Left picture represents reference (undistorted) test pattern.
Picture on the right shows first TV frame, extracted from the captured video clip under test.
© 2005-2009 by VideoQ Inc, all rights reserved
VQMA User Manual
Running VQMA in Windows GUI mode
16
4.4.3 Staircase Display page
This page displays Black Level and White Level measured on averaged VQMA matrix pattern.
They are presented above the plot in % of nominal range and also as D1 8 bit levels (in brackets).
Actual staircase signal waveform, averaged by the filter selected in "Options" menu, is shown on
the diagram superimposed over Reference Black and White levels - designated by green dotted
lines.
Vertical scale is D1 8 bit, Reference Black = 16, Reference White =235.
Horizontal co-ordinate: Y pixel count from 0 to 719.
Note that VQMA measures black and white levels not on porches of staircase signal (4th band grey scale), but on larger black and white bars available within 5th band of the test pattern (pulse
and bar). This makes measurement more accurate, but actual vertical position of black or white
porch of staircase waveform display may occasionally look slightly different from measured
levels.
© 2005-2009 by VideoQ Inc, all rights reserved
17
VQMA User Manual
Running VQMA in Windows GUI mode
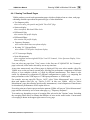
4.4.4 Diff Phase and Diff Gain pages
These two pages display measured Differential Phase in degrees and Differential Gain in %.
These are calculated as peak values within the whole CVBS range - from black to white.
There are also two conventional displays of DP and DG profiles - black is on the left and white is
on the right. The profile displays are very useful, because they allow to estimate actual causes of
the differential distortions. For example, from the plots below it is clear that there is no problem
with DP, whilst relatively high (out of specs) values of DG correlate with high signal levels close to 100%. Such shape of the profile shows that the DG distortion can be possibly reduced by
minor re-distribution of video gains thru the video processing chain.
© 2005-2009 by VideoQ Inc, all rights reserved
VQMA User Manual
Running VQMA in Windows GUI mode
18
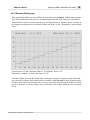
4.4.5 Frequency Response page
This page shows the measured averaged peak-to-peak amplitudes of six frequency bursts and
displays averaged luminance waveform of multi-burst band of VQMA matrix pattern (3rd band).
Type of averaging filter can be selected via "Options" menu.
The burst amplitudes are expressed in dB wrt nominal (undistorted) value.
Third band of VQMA test pattern includes special reference bars with levels exactly matching the
nominal burst amplitude. The measurement algorithm check these bars first, and automatically
compensate for any non-standard Black Level and White Level conditions. In other words,
VQMA frequency response measurement is always accurate and correct, independent of any
clamping, setup or gain errors in Y channel.
The list of burst frequencies tested by VQMA is rather short, - 6 frequencies represent only few
points on the frequency response plot.
However, in typical conditions frequency response shape is quite smooth. Thus, VQMA values,
measured on few frequency bursts, adequately represent typical frequency response plot in total.
On the other hand, long-distant RF echoes may produce strong ripples on frequency response,
seriously damaging the validity of the multi-burst test. In such case, only genuine slow sweep
signal test can reveal the true shape of frequency response.
Vertical scale is D1 8 bit, Reference Black = 16, Reference White =235.
Horizontal co-ordinate: Y pixel count from 0 to 719.
© 2005-2009 by VideoQ Inc, all rights reserved
19
VQMA User Manual
Running VQMA in Windows GUI mode
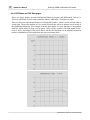
4.4.6 UV Vector Graph page
This page displays averaged waveforms of U and V signals selected from the color bars band of
VQMA matrix test pattern.Type of averaging filter can be selected via "Options" menu.
U(CR) and V(CB) levels are in D1 8 bit scale.
Seven target zones (red squares) on color bars vector display are sized to represent 5% (+/-2.5%)
of nominal UV range.
Central points of these squares represents reference 75% Color Bars. UV values for both systems
NTSC and PAL are the same.
This page also allows visual estimation of C channel dynamic quadrature distortions. Nondistorted chrominance transitions are mapped as straight lines, but distorted transitions appear
bended. The curvature of lines on the display is usually affected by tuner performance.
© 2005-2009 by VideoQ Inc, all rights reserved
VQMA User Manual
Running VQMA in Windows GUI mode
20
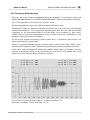
4.4.7 Noise Measurement page
RMS noise level of Y channel in D1 8 bit levels is shown on the very top of the page.
The RMS value is derived directly from incoming video data, so it correlates with unfiltered SNR.
Y channel SNR is calculated in five variants: unfiltered, band-limited A & B (for CVBS &
tuner inputs), band-limited and weighted A & B.
These SNR values may be slightly affected by video calibration errors, because SNR is
traditionally calculated wrt nominal signal range, i.e. assuming video gain = 0 dB.
UV SNR is derived from 1.5 MHz band-limited unweighted sum of scaled U noise and V noise.
Y channel filters switch automatically depending on TV standard:
NTSC: SMPTE Unified Weighting,
4.2 MHz and 6.0 MHz Band-limiting
PAL:
5.0 MHz and 6.0 MHz Band-limiting
EBU Weighting,
Y Noise Spectral Density plots in dB/MHz for unlimited and weighted noise spectra allows to
see the effect of tuner frequency response and also to distinguish random noise from the
contributions by regular textures, e.g. from those caused by RF interference or digital clock
pick-up.
The picture at the bottom right corner of the page shows boosted (x8 gain) noise pattern on grey
background. This also helps to differentiate true random noise from other unwanted (but more or
less periodic) signals.
© 2005-2009 by VideoQ Inc, all rights reserved
21
VQMA User Manual
Running VQMA in Windows GUI mode
4.5 Menu - Options
"Options" menu allows selection of spatial/temporal averaging filters used to reduce the harmful
effect of noise, which affects the accuracy of measurement.
This menu is for advanced users.
Default selection is "Multiple Frames Multiple Lines", it allows maximum reduction of noise
influence over the test results. This selection is mandatory for Summary Page and Noise
Measurement Page. When user selects in "View" menu any one of these two pages the "Options"
menu automatically reverts to "Multiple Frames Multiple Lines". Two other options could be used
to compare the behavior and amount of noise, e.g. when viewing the "Staircase Display" page.
4.6 Menu - Help
"Help" menu contains two items:
4.6.1 About VQMA program
This sub-menu shows program version, copyright and technical support information
© 2005-2009 by VideoQ Inc, all rights reserved
VQMA User Manual
Running VQMA in Windows GUI mode
22
4.6.2 Short Guide
This sub-menu produces pop-up box with short description of modes of operation and supported
video file formats:
© 2005-2009 by VideoQ Inc, all rights reserved
23
5
VQMA User Manual
Running VQMA in Windows GUI mode
Running VQMA in DOS Mode
VQMA.EXE can be used in DOS window under Windows XP in unattended (robotic) mode.
Note that in previous versions the executable file name was shortened to VQM.EXE:
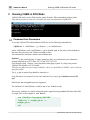
5.1 Command Line Parameters
To run the VQMA.EXE within Windows DOS box use the following command line:
VQMA.exe -i <InFileName> [ -y <Format> ] -o <OutFileName>
where <InFileName> and <OutFileName> can be absolute path, or file name, which defaults to
the same directory where the VQMA executable resides.
All command line characters must be entered lower case.
Optional -y flag and following <Format> parameter allow to switch between two alternative
multiplexing formats of YUV data: UYVY and YUV2 (YUYV).
Four characters long <Format> string should be either uyvy or yuv2. If -y flag is not present
VQMA.EXE defaults to YUV2 format.
This does not affect the processing of .avi files, which is controlled by FOURCC code read from
input file header.
The -i, -y and -o option flags should be entered as is.
Long file names are accepted, but the total command line string length should not exceed 256
byte.
Multi-frame .nts and .pal formats are supported.
The extension of <OutFileName> could be .txt or .csv, defaults to .txt.
If necessary, multiple or variable commands can be organized using standard Windows batch files
or scripts. Here is the example of such .bat file:
rem VideoQ Inc. Copyright [c] 2005-2008
VQMA.exe -i example_pal.avi -o
example_pal.csv
exit
© 2005-2009 by VideoQ Inc, all rights reserved
VQMA User Manual
Running VQMA in DOS Mode
24
5.2 Test Results Presentation
The results can be found in the <OutFile> . They are presented in three sections:
1. VideoQ copyright info (commented out by semicolons)
2. Test results in form of comma separated ASCII data
3. Copy of the .INI content (commented out by semicolons)
this section allows to log, if necessary, the actual target values used for the test
The most important is Section 2.
First line of section 2 shows VQMA version, followed by actual test date and time.
Next 14 lines contain the results of partial tests, starting with the parameter code in form of two,
three or four ASCII characters:
BL
Black Level in % of nominal video range, e.g. 2.8
WL
White Level in % of nominal video range, e.g. 99.3
SNR
Unweighted Luminance Channel Signal To Noise Ratio in dB, e.g. 52.23
KR
K-rating in %, e.g. 0.94
CYD Chrominance To Luminance Delay in nanoseconds, e.g. 2
positive values show that chrominance is delayed wrt luminance
CYG Chrominance To Luminance Gain in dB, e.g. 0.11
positive values show that chrominance gain is higher than luminance gain
DG
Differential Gain in %, e.g. 1.21
DP
Differential Phase in degrees, e.g. 0.8
FR1, FR2, FR3, FR36, FR42, and FR58 are the frequency response reading in dB for the burst
of corresponding MHz value
For NTSC version the burst frequencies are 1.0, 2.0, 3.0, 3.58, 4.2 and 5.8 MHz.
PAL version uses slightly different set of frequencies:
FR1, FR2, FR3, FR4, FR48, and FR58, i.e. 1.0, 2.0, 3.0, 4.0, 4.8 and 5.8 MHz
© 2005-2009 by VideoQ Inc, all rights reserved
25
VQMA User Manual
Running VQMA in DOS Mode
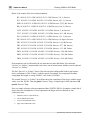
Below is the sample of the test result presentation:
BL, 10/19/05 2:13:14 PM, 10/19/05 2:13:14 PM, Success, 2.8, %, Success
WL, 10/19/05 2:13:14 PM, 10/19/05 2:13:14 PM, Success, 99.3, %, Success
SNR, 10/19/05 2:13:14 PM, 10/19/05 2:13:14 PM, Success, 52.23, dB, Success
KR, 10/19/05 2:13:14 PM, 10/19/05 2:13:14 PM, Success, 0.94, %, Success
CYD, 10/19/05 2:13:14 PM, 10/19/05 2:13:14 PM, Success, 2, ns, Success
CYG, 10/19/05 2:13:14 PM, 10/19/05 2:13:14 PM, Success, 0.11, dB, Success
DG, 10/19/05 2:13:14 PM, 10/19/05 2:13:14 PM, Success, 1.21, %, Success
DP, 10/19/05 2:13:14 PM, 10/19/05 2:13:14 PM, Success, 0.8, degree, Success
FR1, 10/19/05 2:13:14 PM, 10/19/05 2:13:14 PM, Success, 0.12, dB, Success
FR2, 10/19/05 2:13:14 PM, 10/19/05 2:13:14 PM, Success, -0.77, dB, Success
FR3, 10/19/05 2:13:14 PM, 10/19/05 2:13:14 PM, Success, -1.35, dB, Failure
FR36, 10/19/05 2:13:14 PM, 10/19/05 2:13:14 PM, Success, -1.88, dB, Failure
FR42, 10/19/05 2:13:14 PM, 10/19/05 2:13:14 PM, Success, -3.05, dB, Failure
FR58, 10/19/05 2:13:14 PM, 10/19/05 2:13:14 PM, Success, -4.38, dB, Failure
Each parameter code is followed by the test time interval (start and finish), first codeword
“Success” or “Failure”, measurement result value, unit of measurement, and the second codeword
“Success” or “Failure”.
The first “Success” or “Failure” shows if the test took place (independent of the actual capture
device performance). This “Failure” could be caused, for example, by wrong input file name,
wrong input file length, or wrong FOURCC code in the AVI header.
The second “Success” or “Failure” in each line shows the compliance of the device with the target
values set in the .INI file. Thus the global “Success” flag is a simple logical AND function of all
partial “Success” flags.
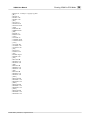
Next is a sample of target values presentation within VQNTSC.INI file. It contains a simple list of
target values for all parameters. For each parameter the target values are defined by four
consecutive lines:
1.
Parameter Code [in square brackets]
2.
Unit Of Measurement Name
3.
Lower Limit (Minimum Value)
4.
Upper Limit (Maximum Value)
© 2005-2009 by VideoQ Inc, all rights reserved
VQMA User Manual
;VQNTSC.ini - VideoQ inc. Copyright [c] 2005
; [BL]
; BLUNIT=%
; BLMIN=-5.00
; BLMAX=5.00
; [WL]
; WLUNIT=%
; WLMIN=95.00
; WLMAX=105.00
; [SNR]
; SNRUNIT=dB
; SNRMIN=40.00
; [KR]
; KRUNIT=%
; KRMAX=3.00
; [CYD]
; CYDUNIT=ns
; CYDMIN=-40.00
; CYDMAX=40.00
; [CYG]
; CYGUNIT=dB
; CYGMIN=-1.00
; CYGMAX=1.00
; [DG]
; DGUNIT=%
; DGMAX=5.00
; [DP]
; DPUNIT=degree
; DPMAX=5.00
; [FR1]
; FR1UNIT=dB
; FR1MIN=-1.00
; FR1MAX=1.00
; [FR2]
; FR2UNIT=dB
; FR2MIN=-1.00
; FR2MAX=1.00
; [FR3]
; FR3UNIT=dB
; FR3MIN=-1.00
; FR3MAX=1.00
; [FR36]
; FR36UNIT=dB
; FR36MIN=-1.00
; FR36MAX=1.00
; [FR42]
; FR42UNIT=dB
; FR42MIN=-1.00
; FR42MAX=1.00
; [FR58]
; FR58UNIT=dB
; FR58MIN=-1.00
; FR58MAX=1.00
© 2005-2009 by VideoQ Inc, all rights reserved
Running VQMA in DOS Mode
26
27
6
VQMA User Manual
Customization and Editing of INI Files
Customization and Editing of INI Files
VQMA.EXE checks the captured (input) video data, e.g. read from *.AVI file, against the
tolerance values contained within one of the following files:
VQNTSC.INI
or
VQPAL.INI
VQMA automatically detects NTSC or PAL video file and selects the appropriate .INI file.
The .INI files must be present in the program folder, they are editable, so the users can input their
customized tolerance values for any parameter.
If these .INI files are not found in the program folder, then they are created automatically by
VQMA.EXE with the default tolerance values.
VQNTSC.INI and VQPAL.INI file names are reserved and cannot be modified.
The content of the .INI files can be edited using any text editor (like Notepad) to apply the
tolerance values more appropriate for the particular device under test. It should be done with
caution because the list of parameters and units of measurement codes should not be modified.
Only actual numerical values, e.g. frequency response drop for some particular frequency can be
amended. For example, the MIN tolerance for 3 MHz burst can be changed from -1 dB (default)
to -3 dB.
It is recommended to store customized .INI files under the names which are different from the
reserved ones, e.g. MY_PAL.INI. To use these customized .INI file simply rename a copy of the
selected file MY_PAL.INI to VQPAL.INI, overwriting the default file.
It is also advisable to keep a backup copies of the original files, thus allowing to revert to the
default values if necessary.
The process of replacement of the .INI files can be automated by usage of conventional batch files
or scripts.
© 2005-2009 by VideoQ Inc, all rights reserved
VQMA User Manual
7
Customization and Editing of INI Files
Terms and Abbreviations
Term
Explanation
AVI
Audio Video Interleaved (File Format)
C
Chrominance (Chroma) Video Signal
CSV
Comma Separated Values (File Format)
CVBS
Color, Video, Blanking and Sync (Composite Video Signal)
DG, DP
Differential Gain, Differential Phase (CVBS specific distortions)
DVD
Digital Video Disk (Disk Format)
EBU
European Broadcasting Union
NTSC
National Television Systems Committee (also a TV Standard name)
PAL
Phase Alternate Lines (TV Standard)
RMS
Root Mean Square (Value - noise strength estimate)
SNR
Signal To Noise Ratio
SMPTE
Society of Motion Pictures and Television Engineers
TXT
Text (File Format, for VQMA software purposes - same as CSV)
UV
Color Difference Video Signals: U (CB) & V (CR)
Y
Luminance Video Signal
YUV
Digital Component 4:2:2 Multiplex (also a File Format)
© 2005-2009 by VideoQ Inc, all rights reserved
28
HelpAndManual_unregistered_evaluation_copy
VideoQ Inc