1
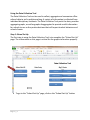
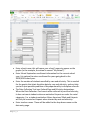
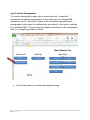
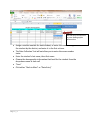
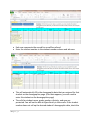
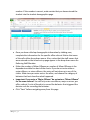
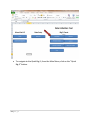
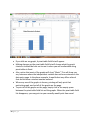
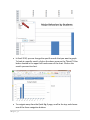
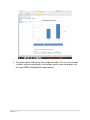
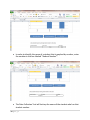
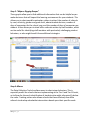
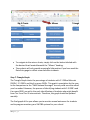
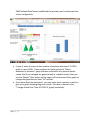
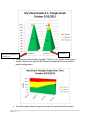
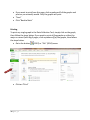
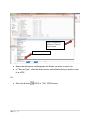
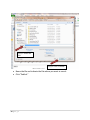
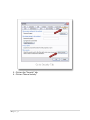
Using the MOSWPBS Data Collection Tool Contents Getting Started ........................................................................................................................................................ 3 Using the Data Collection Tool............................................................................................................................ 5 Step 1: School Set Up ........................................................................................................................................ 5 Step 2: Student Demographics....................................................................................................................... 8 Step 3: Data Entry ........................................................................................................................................... 10 Step 4: Big-5 Charts ........................................................................................................................................ 13 Step 5: “Majors: Digging Deeper” .............................................................................................................. 21 Step 6: Minors .................................................................................................................................................. 21 Step 7: Triangle Graph ................................................................................................................................... 22 Printing .................................................................................................................................................................... 26 Creating a PDF in Office 2007 and 2010 .............................................................................................. 27 Troubleshooting Guide....................................................................................................................................... 31 You are not prompted to enable content or the buttons do not work .......................................... 31 To Change The Security Level ................................................................................................................. 31 School name does not appear on graphs page ...................................................................................... 36 You click in a cell, and receive an error message, or another blank cell is “selected.” .............. 37 Data on Graph appears to be different from what was entered on “Data Entry” page. ........... 37 Error Message: “Converter Failed to Save File” ..................................................................................... 37 Other ................................................................................................................................................................... 37 2|Page Getting Started Rationale: The Data Collection Tool was designed to summarize office discipline referral (ODR) data in a variety of ways. Quick Big-5 graphs answer the questions “who, what when where and why?” of problem behavior so that schools can design interventions that address problem areas. It also collects and summarizes additional data that can be used to help schools to identify other potential areas for improvement. For example, the data collection system graphs by grade level, making it possible to determine if an intervention should target a particular grade level. Main Menu: The Main Menu allows for easy navigation of the Data Collection Tool. To enable macros, click here. The first time the Data Collection Tool is opened, macros must be enabled. Usually this option is in a bar just below the Excel toolbar ribbon. It will typically read “Security Warning! Macros have been disabled. Enable Content.” 3|Page In Office 2007 or 2010, click on the box marked “Enable Content.” Once this has been done, the buttons can be used to navigate around the Data Collection Tool. If you are using Office 1997-2003, you may or may not receive a message stating that “Macros may contain viruses. It is usually safe to disable macros, but if the macros are legitimate, you might lose some functionality.” If this message pops up, you will want to click “Enable Macros” Important: If you still have trouble using the navigation buttons, see the “troubleshooting guide” at the end of this document to change the security settings in excel. 4|Page Using the Data Collection Tool The Data Collection Tool can be used to collect, aggregate and summarize office referral data to aid in problem solving. A variety of information is collected from individual disciplinary incidents. The Data Collection Tool pools the data, provides aggregate graphs, as well as graphs disaggregated to provide useful information for schools to use as they make decisions that will impact student behaviors and school climate. Step 1: School Set Up The first step in using the Data Collection Tool is to complete the “School Set-Up” page. The information on this page is critical for the graphs to function properly. To go to the “School Set-Up” page, click on the “School Set-Up” button 5|Page Enter school name; this will cause your school’s name to appear on the graphs (in the example, the school is named “My School”). Enter School September enrollment information for the current school year. It is optional to enter enrollment for years going back to the 2009/2010 school year. Enter the number of students enrolled by race and ethnicity. This is needed for the graphs that chart discipline data by race and ethnicity, and can help you to to spot possible problems of disproportionality in discipline referrals. The Data Collection Tool uses Federal Race and Ethnicity designations. When the Data Collection Tool counts office referrals by race and ethnicity, it does not count students who are marked as Hispanic as under the racial categories, (i.e. a student marked as African American/ Black and Hispanic will only be counted as Hispanic when charted by race and ethnicity. Enter teacher names. These will be added to the drop down menu on the data entry page. 6|Page Enter the number of days that school is in session for students for each month. This information is used to chart the number of office referrals per day/ per month. “Save” Click the “Back to Main Menu” button 7|Page Step 2: Student Demographics The student demographics page acts as a data base that “remembers” information on student demographics so that when you are entering ODR information on the “Data Entry” page you do not have to repeatedly enter demographics information for students who are already in the system, and who have multiple ODR’s. This also helps to establish consistency in the demographic data (i.e. misspelling a student’s name) This will take you to the student demographics page. 8|Page Use the drop down boxes to enter demographic information Assign a student number for each student, or enter the number assigned to the student by the district, and enter it in the first column. The Data Collection Tool will not allow you to enter the same number twice. Enter the student’s last name, then first name. Choose the demographic information that best fits the student from the drop down menu in each cell “Save” Click either “Back to Main” or “Data Entry” 9|Page Step 3: Data Entry The data entry page is where individual ODR’s are entered into the system. This becomes the data base which then generates the various graphs. Click on the “Data Entry” button 10 | P a g e Each row represents the record for one office referral. Enter the student number in the student number column and tab over. This will automatically fill in the demographic data that you entered for that student on the demographics page. (If no data appears, you will need to enter this student on the demographics page) The cells for student name, grade, gender, ethnicity, and race are protected. You will not be able to type directly in these cells. If the student number does not call up the desired student’s demographic data, check the 11 | P a g e number. If the number is correct, make certain that you have entered the student into the student demographics page. Once you have called up demographic information by tabbing over, complete the information for the specific office referral. Notice that some of the cells utilize drop down menus. Also, notice that the staff names that were entered on the school set up page appear in the drop down menu for Referring Staff Member. Either the number of Major Offenses or number of Minor Offenses is the dependent variable for most of the charts. If you do not enter either a major offense, or minor offense, the entry will not show up in any of the charts. Make sure you enter one or the other, and choose the category of behavior that best describes what happened. Important: If you enter a “Major Offense” do not enter a “Minor Offense” for the same referral. You will only enter one offense, major or minor, per office referral. A rule of thumb is to record the behavior that triggered the decision rule for recording the behavior. Click “Save” before navigating away from this page. 12 | P a g e To navigate away from this page, choose one of the navigations buttons in the upper left hand corner. Step 4: Big-5 Charts The Big-5 Charts answer the questions “how often (per day per month), what (problem behavior), where (location), when (time) and who (majors by student)” of problem behavior. This allows you to develop schoolwide interventions that target the situation in your school. This section of the menu page allows you to navigate to a “Quick Big-5” page, which has all 5 of the Big-5 graphs for quick reference. You can also navigate to individual Big-5 graphs, as well as a graph that charts the absolute number of referrals for each given month (per month totals). 13 | P a g e To navigate to the Quick Big-5, from the Main Menu, click on the “Quick Big-5” button. 14 | P a g e 15 | P a g e If you click on any graph, A pivot table field list will appear. Making changes on the pivot table field list will change what the graph charts so it would be best not to use it unless you are comfortable using pivot tables in Excel. Also, notice that most of the graphs will chart “Blank.” This will show you any instances where the independent variable has not been entered on the data entry page. In the above example, it would chart any office referral that did not have a student number entered. When any one of the graphs is chosen, printing will only print that particular graph, and not all of the graphs on the page. To print all of the graphs on the page, simply click in the empty space between the pivot table field list and the graphs. When the pivot table field list disappears, you may print as you normally would print from excel. 16 | P a g e In Excel 2010, you can change the specific month that you want to graph. To look at a specific month, click on the down arrow on the “Month” filter button located in the upper left hand corner of the chart. Click on the month you want to chart. To navigate away from the Quick Big-5 page, scroll to the top, and choose one of the three navigation buttons. 17 | P a g e To navigate to individual Big-5 charts, simply select the button of the chart that you want to see. We will look at the “Majors by Student” chart to show a special feature of the graphs that chart with individual students as the independent variable. 18 | P a g e This graph charts students by their student number. This is in part to make a neater, easier to read graph. It also allows you to share the graphs, and still meet FERPA confidentiality requirements. 19 | P a g e In order to identify the name of a student that is graphed by number, enter the number in the box labeled “Student Number”. The Data Collection Tool will look up the name of the student who has that student number. 20 | P a g e Step 5: “Majors: Digging Deeper” These graphs allow you to find additional information that can be helpful as you make decisions that will impact the learning environment for your students. This allows you to chart possible motivation, others involved, the number of referrals by race, ethnicity, gender and grade level, administrative decision, number of days of suspension for the school year, and the number of days of suspension per student. It also allows you to chart office referrals written by staff member, which can be useful for identifying staff members with particularly challenging student behaviors, or who might benefit from additional strategies. Step 6: Minors The Data Collection Tool also allows users to chart minor behaviors. This is especially useful for schools that are implementing at the Tier II and Tier III levels, as it allows for the early identification of students who might otherwise fly below the radar. Tracking minors also allows schools that have relatively few office referrals to develop schoolwide interventions based upon their specific needs. 21 | P a g e To navigate to the minors charts, simply click on the button labeled with the desired chart located beneath the “Minors” heading. These charts will only provide meaningful information if you have used the Data Entry page to collect minor behavior incidents. Step 7: Triangle Graph The Triangle Graph charts the percentage of students with 0-1 Office Referrals (ODR’s), 2-5 ODR’s and the 6 or more ODR’s. This graph is cumulative for the year, so the comparison to the “SWIS National Averages” are only valid once the school year has ended. However, the process of identifying students with 2-5 ODR’s and 6 or more ODR’s can aid in the early identification of students who might benefit from Tier II and Tier III interventions. Therefore, this graph should be updated monthly. The final graph of the year allows you to monitor annual outcomes for students and to progress monitory your SW-PBS systems for your school. 22 | P a g e From the Main Menu, click on the “Triangle Graphs” button. Using the drop down menu on Step 1, choose the option closest to your school configuration. This sets the National Comparison triangle to the 23 | P a g e SWIS National Data Norms established the previous year for that particular school configuration. In step 2, enter the year to date number of students who have 2-5 ODR’s and 6 or more ODR’s. These numbers can be found on the “Major Behaviors by Students” graph that was included for this purpose (make certain that if you changed the graph to look at a specific month, that you use the “Month” filter button on the upper left hand corner of the graph to change the graph back to show “All” months. If you have data from past year’s, you may enter these numbers as well, to give you a graph showing long term trends. This data is charted in the “Triangle Graph Over Time 2012/2013” graph (see below). 24 | P a g e National Comparison Grades k-6 My School The generator will produce 2 graphs. The first is a triangle showing your school’s data to the right of the National Comparison for your school’s grade configuration. The other graph depicts long term trends for up to the last four years. 25 | P a g e If you want to print from this page, click anywhere off of the graphs and print as you normally would. Only the graphs will print. “Save” Click “Back to Main” Printing To print any single graph in the Data Collection Tool, simply click on the graph, then follow the steps below. If you want to print all five graphs on either the major or minor Quick Big-5 pages, click anywhere off of the graphs, then follow the steps below. Go to the button Click on “Print” 26 | P a g e (2007) or “File” (2010) menu. Click on the “Print” button Creating a PDF in Office 2007 and 2010 If you want to create a PDF of a single graph anywhere in the Data Collection Tool, simply click on that graph, then perform the following steps. If you want to create a PDF of all 5 graphs on either of the Quick Big-5 pages (major or minor), click off the graphs, then go through the following steps. To create a PDF, you may do one of two things: Go to the button Click on “Save As” 27 | P a g e (2007) or “File” (2010) menu. Step 1: Click down arrow on “Save as Type” menu Step 2: Click PDF Name the document and designate the folder you want to save it to In “Save as Type”, click the down arrow, and indicate that you want to save it as a PDF. Or… Go to the button 28 | P a g e (2007) or “File” (2010) menu. Click on “Save and Send” Click “Create PDF” You will be asked a second time to click “Create PDF” 29 | P a g e Step 1: Name the file Step 2: Click “Publish” Name the file and indicate the file where you want to save it. Click “Publish.” 30 | P a g e Troubleshooting Guide This guide is intended to address common problems associated with the different versions of Excel used throughout the state. You are not prompted to enable content or the buttons do not work If the first time that you open the Data Collection Tool you do not receive a message prompting you to “enable content” or “enable macros,” and the navigation buttons do not work, your security settings may be set to high. To Change The Security Level How you change your security settings from “High” (macros are disabled) to “Medium” (Macros are disabled but you are prompted to enable them) depends on what version of office you have. Office 2003: 1. Click on “Tools” from your menu bar 2. Click on “Options 31 | P a g e 3. Click on the “Security” tab 4. Click on “Macro Security” 32 | P a g e 5. Click on the button next to “Medium” 6. Click “OK” 33 | P a g e By selecting Medium, you will receive a warning every time you try to open a file with macros. For the Data Collection Tool, you will need to enable the Macros. For other programs, enable macros only if you trust the source. 34 | P a g e For Office 2007 and 2010: You can change macro security settings in the Trust Center, unless a system administrator in your organization has changed the default settings to prevent you from changing the settings. Step 1: Click “Developer” Tab Step 2: Click here to enable change security level On the Developer tab, click “Macro Security.” o If the Developer tab is not displayed, click the Microsoft Office Button , click Excel Options, and then in the “Popular” category, under “Top options for working with Excel,” click “Show Developer tab in the Ribbon.” 35 | P a g e Step 3: Click “disable all macros with notification.” In the Macro Settings category, under Macro Settings, click “Disable all macros with notification.” The Microsoft office button was replaced by the “File” tab in office 2010 The information on changing security settings in Office 2007 and 2010 came from http://office.microsoft.com/en-us/excel-help/change-macro-security-settings-inexcel-HP010096919.aspx. School name does not appear on graphs page From the “Main Menu,” click the “School Set-Up” button. Enter the school name in the designated space. 36 | P a g e You click in a cell, and receive an error message, or another blank cell is “selected.” Several pages of The data collection Tool have been protected to prevent users from inadvertently deleting a formula that generates the graph. For example, you will not be able to enter demographics information directly onto the “Data Entry” page. You will only be allowed to enter this information on the “Student Demographics” page (however, you will only need to do this one time per pupil). Data on Graph appears to be different from what was entered on “Data Entry” page. Check to make sure that you have selected “All” on the “Month” filter (see Step 4 above). Error Message: “Converter Failed to Save File” Finally, there is one other possibility for those of you who are having trouble converting this file to earlier versions of Excel. Apparently, there was a problem with one of the Microsoft converter service packs. The converter at the following link is supposed to solve the problem. This has worked. Some districts will only allow individuals with administrator rights to load files or do updates. The link is: http://www.microsoft.com/download/en/details.aspx?displaylang=en&id=1285. Other If you encounter a problem that is not addressed in this User’s Manual, you may contact your SW-PBS consultant, or call Gordon Way at 816-235-5656 37 | P a g e