1
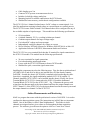
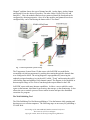
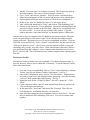
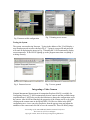
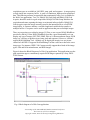
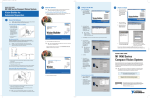
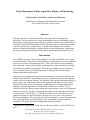
Virtual Experiment in Data Acquisition, Display, and Monitoring Ray Bachnak, Carl Steidley, and Korinne Resendez Department of Computing and Mathematical Sciences Texas A&M University-Corpus Christi Abstract This paper describes a virtual experiment in data acquisition, monitoring, and processing. The experiment was recently implemented as part of establishing a virtual laboratory that allows engineering technology students to perform experiments online. A front panel in LabVIEW displays the results and permits remote monitoring and control of devices and storage of acquired data. A digital camera that provides real-time pictures of monitored equipment is included in the system configuration. Details about the system design and development along with its programming and testing are given. Introduction Texas A&M University-Corpus Christi (A&M-CC) recently established a new Control Systems Laboratory1 that provides interdisciplinary educational and research capabilities across several science and engineering areas. These areas include sensor technology, data acquisition, control system design, system modeling, signal and image processing, neural networks, and data visualization. The laboratory supports several courses and gives Computer Science (CS) and Engineering Technology (ET) students unique training opportunities and benefits. Advances in networking technologies and development of measurement hardware and software have turned PCs into platforms capable of continuous remote monitoring and control of devices using the Internet. This capability makes proper and timely analysis of data possible. One of the projects that use the equipment and software in the Control Systems Laboratory involves developing a virtual laboratory environment that allows students to perform experiments from anywhere the Internet is available. This is especially useful for offering courses online and giving students access to the equipment outside of class time. A software program that facilitates the developments of this type of environment is LabVIEW [1-6]. LabVIEW provides an easy and efficient way to publish experiments to the Web and give the user access to a server with password protection capabilities. This paper describes the development of a virtual experiment that uses a data acquisition system, including a video camera that provides monitoring capabilities. The paper also presents demonstrations and test results. 1 This project is funded in part by the Air Force Research Office, award # F49620-01-10557 “Proceedings of the 2003 ASEE Gulf-Southwest Annual Conference The University of Texas at Arlington Copyright 2003, American Society for Engineering Education” Data Acquisition System The data acquisition system consists of a data acquisition board (PCI-MIO-16E-4), terminal blocks (SCXI 1303 and SCXI 1325), signal conditioning hardware (SCXI 1102), and a digital to analog conversion module (SCXI 1124. The PCI-MIO-16E-4 has the following specifications: • • • NI-DAQ driver with Measurement & Automation Explorer for easy configuration for Win 2000/NT/Me/9x and Mac OS Two 12-bit analog outputs; 8 digital I/O lines; two 24-bit counters Up to 16 analog inputs; 12-bit resolution; up to 500 kS/s sampling rate The SCXI 1102C is ideal for higher bandwidth analog signals. Each channel can be configured for a gain of 1 or 100 allowing any combination of thermocouples to be used. This module has the following specifications: • • • • • 10 kHz low-pass filter on every channel 32 channels, up to 333 kHz scanning rates For low-bandwidth mV, volt, and current inputs (1102B, 1102C) Over voltage protection to +/-42V Programmable instrumentation amplifier on every channel The SCXI 1303 connects to the SCXI 1102C and is designed for high accuracy thermocouple measurements. This module has the following specifications: • • • • • Isothermal construction that minimizes errors caused by thermal gradients Mounts to front of SCXI module Open-thermocouple detection circuitry Offers high-precision thermocouple temperature measurement applications Interfaces with the SCXI-1100/1102/1102B/1102C The SCXI 1000 houses all of the component and power modules. Its architecture includes the SCXI bus, which routes analog and digital signals while acting as a communication conduit between modules. The chassis has the following specifications: • • • • • Low noise environment for signal conditioning Rugged, compact chassis Forced air cooling Combination chassis for SCXI and PXI/Compact PCI modules House all SCXI modules Assembling the system requires the use of the SCXI 1349 shielded cable assembly and the SCXI 1357 high voltage backplane. The cable assembly connects to the front-end signal conditioning SXCI. The high voltage backplane has the following specifications: “Proceedings of the 2003 ASEE Gulf-Southwest Annual Conference The University of Texas at Arlington Copyright 2003, American Society for Engineering Education” • • • • • Cable lengths up to 2 m Connects SCXI systems to measurement devices Includes 4-slot high-voltage analog bus Mounting bracket for reliable connection to the SCXI chassis Shielded for better accuracy; multi-chassis configurations available The SCXI 1124 is a 6 channel isolated source for DC voltage or current signals. It is ideal for applications requiring isolated voltage or current outputs to a control process. The SCXI 1124 comes with 6 isolated 12-bit channels that can be configured for any of the available unipolar or bipolar ranges. This module has the following specifications: • • • • • • • 12-bit resolution 6 isolated channels, 250 Vrms working isolation per channel Combine output channels for larger voltage ranges For isolated DC voltage and current output Independently configure channels for voltage or current Driver Software: NI-DAQ Software for Windows 2000/NT/Me/9x or Mac OS Application Software: LabVIEW, Measurement Studio and Lookout The SCXI 1325 is a screw terminal block that has 26 terminal for signal connections to the SCXI 1124 module. This module has the following specifications: • • • • 26-screw terminals for signal connections For isolated analog output applications For use with the SCXI-1124; Mounts to front of SCXI module Shielded for quick, convenient signal connections Installing the components involves the following steps. First, the data acquisition board (PCI-MIO-16E-4) and all of its drivers are inserted into a PC that already contains LabVIEW. Second, the chassis (SCXI 1000) is attached to the board using the cable. Once this is completed, the signal-conditioning module (SCXI 1124) and the 32Channel Amplifier (SCXI 1102C) can be inserted into the chassis. Finally, the Screw Terminal Block (SCXI 1325) is connected to the SCXI 1124 and the Isothermal Terminal Block (SCXI 1303) to the SCXI 1102C. Fig. 1 illustrates the process with wiring from the thermocouple to the input channel and from the output channel to an LED. Channel 11 of the SCXI 1303 was the input channel used in the actual system and the output channel was channel 2 of the SCXI 1325. Online Measurements and Monitoring MAX is a program that comes with the professional version of LabVIEW. It is used to configure the data acquisition system. The instruction tree in MAX has two important folders. One of the folders is called “Data Neighborhood”. This folder is where channels are assigned and are given values to use throughout the data acquisition process. The software gives the user the option to click on “Create New-Virtual “Proceedings of the 2003 ASEE Gulf-Southwest Annual Conference The University of Texas at Arlington Copyright 2003, American Society for Engineering Education” Channel” and then choose the type of channel needed. Analog Input, Analog Output and Digital I/O are the choices it provides. The other folder is called “Devices and Interfaces”. Here, the modules that have been connected should be listed and can be configured by choosing properties. Once all of the modules and channels have been configured they can be tested using the button called “Test Panel.” Fig. 1 Data acquisition system set-up The Temperature System Demo VI that comes with LabVIEW was modified to accomplish real time measurements by reading data coming through the channels that were configured in MAX. The wiring diagram is reprogrammed by removing the randomly assigned numbers given in the subVI called, “Temp” and inserting the subVI called analog input and adding a DAQ channel control. The diagram is also modified so that an output voltage of five volts is sent through the output channel to the LED. LabVIEW comes with many Internet capabilities. It allows a user to publish a static report on the Internet, share data for processing, data storage, or data monitoring. It also allows the user to control a process from a remote location and provides distributed execution of a program. The Web Publishing Tool The Web-Publishing Tool facilitates publishing a VI on the Internet while granting and denying access to certain computers. The following steps are necessary for publishing a VI to the Web. “Proceedings of the 2003 ASEE Gulf-Southwest Annual Conference The University of Texas at Arlington Copyright 2003, American Society for Engineering Education” 1. Run the VI to make sure it is working as required. The VI must stay open on the main computer. The server will not recognize a closed VI. 2. Go to “Tools” and click on “Options”. This will lead to a pull down menu where both configuration of the web server and browser access can take place. 3. Go through the pull down menu and click on “Web Server Configuration.” 4. In this screen, click on “Enable Web Server” to start up the server. 5. After clicking OK head back to “Tools” and click on “Web Publishing Tool.” 6. On this screen, choose the VI to be published. Choose the embedded label, and type any text that is needed on the Web page. Once this is accomplished click on “Save to Disk”. A screen will pop up with a URL address. Copy this address and paste it into either Netscape’s or Internet Explorer’s address bar. Once the above steps are completed, the VI should be seen on the web site. The main server can grant anyone to take control of the VI but it also has the ability to regain control at any time. Denying access to a VI can be accomplished as follows. Go to the LabVIEW screen and click on “Tools – Options” as noted before, but this time click on “Web Server Browser Access”. Here you are given the options to allow viewing and controlling, only viewing, or to deny access. In the small window above these choices, type the Internet Provider’s address’s of any computers that should not have access to this VI, and click OK. This will forbid any user at those computers from opening up the Web site. The Internet Toolkit The Internet Toolkit is another easy way to publish a VI with password protection. It does not, however, allow a user to control the VI remotely. To use the Internet Toolkit, follow these instructions: 1. Go to the VI you want published, click on “Tools” and scroll down to “Internet Toolkit” and click on “Internet Toolkit Configuration.” See Fig. 2. 2. Once in the Configuration menu, click on “User File Editor”. Add the names you wish to grant access and assign them their passwords. Save this file under “users.txt” in the internet/http/conf directory. See Fig. 3. 3. Repeat the steps for the “Group File Editor”, but call it “groups.txt”. Click “Done”. 4. Create a directory called “special” in the internet/home directory and save the VI as a web page in this directory. 5. In this menu click “New Panel” and choose the VI needed. Then click on “Edit Directories” and find the directory it is located in. 6. Once all of the settings have been completed, click on “Start Server”. Be sure that you disable the Web Publishing Tool server. Two servers cannot work together. “Proceedings of the 2003 ASEE Gulf-Southwest Annual Conference The University of Texas at Arlington Copyright 2003, American Society for Engineering Education” Fig. 2 Internet toolkit configuration Fig. 3 Granting access screen Testing the System The system was tested using Netscape. Typing in the address of the VI will display a user id and password screen as shown in Fig. 4. Typing in a proper ID and password will result in displaying the image in Fig. 5. Running the VI will continuously display room temperature. If the LED is lighting up as the program states then everything is working correctly. Fig. 4 Password screen Fig. 5 Access granted Integrating a Video Camera National Instruments Measurement & Automation Explorer (MAX) is available for Configuring Cameras [7]. MAX automatically detects cameras and the available image acquisition board. MAX also provides the functions to change the configuration or test the camera. After MAX has launched, the properties of the camera can be set by rightclicking on the camera name in the IMAQ IEEE-1394 Devices folder in the MAX configuration tree. A user can select Properties from the pop-up menu and adjust the attributes of the camera and click OK to save the camera file. Three NI-IMAQ image “Proceedings of the 2003 ASEE Gulf-Southwest Annual Conference The University of Texas at Arlington Copyright 2003, American Society for Engineering Education” acquisition types are available in LabVIEW: snap, grab, and sequence. A snap acquires a single image into a memory buffer. A grab is a continuous, high-speed acquisition of data. This function performs an acquisition that continuously loops, so it is suitable for the Web-Cam applications. Two Vis, IMAQ1394 Grab Setup and IMAQ1394 Grab Acquire, should be used for a grab acquisition. IMAQ1394 Grab Setup initializes the acquisition and starts capturing the image to an internal software buffer. IMAQ1394 Grab Acquire copies the image currently stored in the internal buffer to a LabVIEW image buffer. A sequence initiates a variable-length and variable-delay transfer to multiple buffers. A sequence can be used in applications that process multiple images. There are two main ways to display images [8]. First, a user can use IMAQ WindDraw provided by IMAQ Vision. IMAQ WindDraw provides a good functionality so it can display any type of images (JPG, PNG, BMP, 8-bit or 16-bit monochrome image, RGB image, etc.) and any acquisition types (snap, grab and sequence). However, it doesn’t support Web Publishing Tool. Another way to display the images is to use picture control in LabVIEW. It supports Web Publishing Tool but a user has to know the exact image type. For instance, IEEE 1394 Cameras usually support three kinds of the image types: 8-bit and16-bit monochrome, and RGB images. Figure 6 shows the Block Diagram of a Web-Cam application. This application uses the grab acquisition type to continuously acquire RGB images captured by a Sony DFWVl500 camera. Fig. 6 Block diagram of a Web-Cam application “Proceedings of the 2003 ASEE Gulf-Southwest Annual Conference The University of Texas at Arlington Copyright 2003, American Society for Engineering Education” Conclusion This paper presented a closed-loop data acquisition system for online data acquisition, display, and monitoring. Using either the Internet Toolkit or the Web Publishing Tool, a programmer can easily grant or deny access of the virtual experiments to computers on the network. The implementation of a digital video camera that offers real time images on the published front panel was also described. References 1. 2. 3. 4. 5. 6. 7. 8. B. Diong, “Providing an updated dynamic systems and controls lab experience,” 1999 ASEE Annual Conference Proceedings, Session 2532, 9 pages. N. Swain, J. Anderson, M. Swain, and R. Korrapati, “State-space analysis of linear, time-invariant control systems using virtual instruments,” 2001 ASEE Annual Conference Proceedings, Session 1547, 7 pages. L. Sokoloff, “LabVIEW implementation of ON/OFF controller,” 1999 ASEE Annual Conference Proceedings, Session 3659, 10 pages. N. Kim, “Process control laboratory experiments using LabVIEW,” 2001 ASEE Annual Conference Proceedings, Session 3220, 15 pages. Egarievwe, S., Okobiah, O., Ajiboye, O., Fowler, L., Thorne, S., and Collins, W. "Internet Application of LabVIEW in Computer Based Learning." European Journal of Open and Distance Learning. 2000. Travis, J. Internet Applications in LabVIEW, Prentice Hall, 2000. National Instrument: Getting Started with NI-IMAQ for IEEE-1394 Cameras Available at http://www.ni.com/pdf/manuals/322885a.pdf. National Instrument: NI-IMAQ for IEEE-1394 Cameras User Manual Available at http://www.ni.com/pdf/manuals/370362a.pdf RAFIC BACHNAK Rafic (Ray) Bachnak is an Associate Professor of Engineering Technology at Texas A&M University-Corpus Christi. He received his B.S., M.S., and Ph.D. degrees in Electrical and Computer Engineering from Ohio University in 1983, 1984, and 1989, respectively. Dr. Bachnak was previously on the faculty of Franklin University and Northwestern State University. CARL STEIDLEY Carl Steidley is Professor of Computer Science and Chair of the Department of Computing and Mathematical Sciences at Texas A&M-Corpus Christi. His interests are in the applications of artificial intelligence, real-time computing, and robotics. He taught computer science at Southeastern La. Univ., Central Washington Univ., and Oregon Institute of Technology. He has research at NASA Ames Research Center, Oak Ridge Natl. Labs, and Electro Scientific Industries in Portland. KORINNE RESENDEZ Korinne Resendez received her B.S. degree in Control Systems Engineering Technology from Texas A&M University-Corpus Christi in May 2002. Ms. Resendez is currently pursuing a Master in Computer Science at A&M-CC. “Proceedings of the 2003 ASEE Gulf-Southwest Annual Conference The University of Texas at Arlington Copyright 2003, American Society for Engineering Education”