1
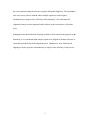
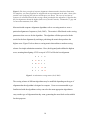
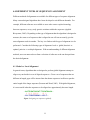
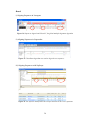
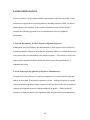
SUMMARY
Nucleotide sequence alignment is a useful comparison technique that detects existing
mutations in the DNA sequences. While some mutations are silent mutations that pose
no harm to an individual, others that occur in the coding regions of the DNA could very
well predispose humans to diseases. In Dr. Robert Hegele’s Blackburn Cardiovascular
Genetics Laboratory at Robarts Research Institute (RRI), nucleotide sequence alignment
is carried out to detect single nucleotide polymorphisms (SNPs) and insertion or deletion
mutations in the coding regions of patients’ DNA, in hope to discover the genetic basis of
the diseases.
The purpose of this report is to compare and analyze three different sequence alignment
softwares – SeqScape, Lasergene, and Sequencher – that are available to the laboratory
for mutation detection. Scientists working in the laboratory are currently looking for a
sequence alignment program that facilitates the mutation detection process. The software
that is most suitable for the purposes of RRI is determined based on parameters such as
the algorithm used for mutation detection, the amount of sequences that the software can
handle, time efficiency, cost and ease of use. In particular, the same set of sequences
with known mutations is imported to all three softwares to test for their efficacy to
accurately pinpoint the location of the mutation.
Based on the alignment results generated from the three softwares, SeqScape software
has demonstrated to be the most effective alignment program to detect mutations that
exist in the nucleotide sequences. SeqScape software is integrated with the SmithWaterman local alignment algorithm that is able to match the sample gene sequences at
1
the correct position along the reference sequence during the alignment. The algorithm is
also a successive pairwise method where multiple sequences can be aligned
simultaneously to improve time efficiency in the laboratory. New and improved
alignment features are also integrated in the software at the convenience of first-time
users.
Although results showed that the SeqScape software is best suited for the purposes of the
laboratory, it is recommended that sample sequences be aligned in all three softwares to
ensure the reproducibility of the alignment result. Furthermore, users should avoid
aligning too many sequences simultaneously to improve time efficiency of the process.
2
1.0 INTRODUCTION
Dr. Robert Hegele is the Director of the Blackburn Cardiovascular Genetics Laboratory
at Robarts Research Institute (RRI). His research interest is focused on the genetic basis
of cardiovascular diseases such as diabetes, atherosclerosis, and dyslipidemia. He and his
team of dedicated scientists work together in the lab to study gene mutations in the
human genome that could very well predispose humans to such diseases.
As a part of the research, tremendous effort is put forth to the finding of single nucleotide
polymorphisms (SNPs). SNPs are single base mutations that occur when a single
nucleotide in the DNA sequence is substituted with one of the three other nucleotides
(Karp, 2005). While some SNPs are silent mutations that will not cause any harm to an
individual, others could induce detrimental effects and be associated with pathology
(Karp, 2005).
The study of SNPs is a promising field of research as it helps identify genes that are
potentially linked to certain diseases. For a variation to be considered as a SNP that
predispose humans to disease, the mutation must occur in at least 1% of the population
(Dale and von Schantz, 2002). In Dr. Hegle’s lab, population studies and related
experiments are conducted to discover SNPs. First, blood samples are collected from
patients who are affected by cardiovascular disease. The DNA from the samples will be
extracted, purified and amplified. After isolating the gene of interest from the processed
samples with the design of specific primers, the genes will be sequenced for further
analysis. The set of sequences obtained will be compared and examined for the presence
of SNPs or other changes such as insertions or deletions.
3
With many sequences to compare and analyze, it would be more efficient if the
sequences could be examined simultaneously with the help of an alignment program. An
alignment program which performs sequence alignments quickly and accurately to pick
out sequence variations can facilitate the SNP identification process, as well as minimize
possible human errors. The purpose of this report is to assess and discuss the advantages
and disadvantages of three sequence alignment softwares over the currently in-use
software Sequence Navigator available in RRI. The three softwares are ABI Prism®
SeqScape® Software Version 2.0, Lasergene® Version 7.0, and Sequencher® Version 4.7.
This report will thoroughly describe the features and functions of each sequence
alignment software. The softwares will be assessed individually for their accuracy and
efficiency in performing sequence alignments. In particular, the alignment algorithm and
the speed of performance will be looked at in detail. Other assessment parameters such
as the ease of use as well as the cost of the softwares will also be considered in the
evaluation. At the end of the report, a recommendation will be made as to the software
that is most supportive to the ongoing SNP detection project in RRI.
4
2.0 INTRODUCTON TO SEQUENCE ALIGNMENT
Sequence alignment is the most direct method to measure sequence similarity between
two or more nucleotide or amino acid sequences. It is the process of comparing
individual nucleotides or residues at the position corresponding to how the sequences are
superimposed (Lesk, 2002). Given a set of sequences with different lengths and context,
there are numerous ways that the sequences can be aligned; the goal is to seek the one
that exhibits the best alignment. While gaps can be inserted within the sequences to
achieve more matching pairs in the alignment, the order of the nucleotides or residues
must be conserved as the original sequence (Lesk, 2002). How is it determined that a
particular arrangement of the sequences be the best alignment? The topic will be
addressed in Section 3.3 of the report.
2.1 Purpose of Performing Sequence Alignment
Sequence alignment is a useful comparison technique with many applications in
evolutionary and molecular studies. In both protein and nucleotide sequence alignments,
the goal is to identify regions of similarity between aligned sequences, known as the
consensus sequence (Pearson and Wood, 2002). With protein alignments, the degree of
resemblance noted from a set of amino acid sequences demonstrates the homology or the
relative closeness of the aligned species (Applied Biosystems, 2002). A phylogenetic
tree deduced from the aligned sequences can also track down the common ancestor of the
species. Furthermore, the identification of conserved or unchanged regions of the protein
sequence in one species leads to the prediction of the structure and the function of the
particular protein in another (Applied Biosystems, 2002).
5
Alternatively, aligning nucleotide or DNA sequences identifies any variant or mutation
that might be present in the sequences (Altschul, 1997). Some well known mutations
within the nucleotide sequence are substitution mutations such as single base changes, or
frameshift mutations such as an insertion, deletion or duplication of several nucleotides.
For the purposes in Dr. Hegele’s laboratory, DNA sequence alignment is mostly
performed to detect the presence of SNPs or any major frameshift mutations in patients’
DNA. The comparative study is conducted to verify the hypothesis about the genetic
basis of certain cardiovascular diseases. Hence, topics covered in the remaining parts of
the report will mainly focus on methods and applications of nucleotide sequence
alignment.
6
3.0 HOW ARE NUCLEOTIDE SEQUENCES ALIGNED?
In general, two components are involved in a nucleotide sequence alignment: the
reference and the query. The reference sequence is a known sequence with the order of
nucleotides predetermined from a valid source that is suitable to be compared against.
Query sequences, on the other hand, could be DNA fragments or bacterial genomes with
an unknown sequence yet to be decoded (Dale and von Schantz, 2002). The nucleotide
sequence of the query can be verified with the reference for any existing mutations. Once
the components for alignment have been gathered, similarity searches within the
sequences can proceed with a program containing the appropriate alignment algorithm
that performs the desired method of alignment.
3.1 Obtaining the Reference Sequence
Several electronic databases containing a collection of known nucleotide sequences are
available to the general public as reference. For example, reference sequences can be
retrieved online from NCBI’s GenBank at http://www.ncbi.nlm.nih.gov, or from
Ensembl at http://www.ensembl.org. Many of these sequences are submitted by reliable
sources such as scientific publications and genome projects which accounts for the
validity of the entries (Lesk, 2002). Useful annotations such as restriction enzyme
cleavage sites and the coding and non-coding regions of the nucleotide sequence are also
provided for investigators’ own interest. Details regarding the retrieval of the desired
reference sequence are outlined in Appendix A.
7
3.2 Obtaining the Query Sequence
In Dr. Hegele’s lab, 99% of the DNA sequences to be analyzed are obtained from
patient’s blood samples. Specific genes that are thought to be related to a particular
cardiovascular disease are isolated from the DNA. The exons or the coding regions of
the genes are studied one by one to check for the presence of SNPs or other existing
mutations. Briefly, the DNA that is extracted from the carefully treated blood samples is
subjected to PCR amplification. Two custom designed primers have been added prior to
the PCR reaction so that only the gene of interest is multiplied. The end products of the
PCR reaction will go through a thorough purification process to rid excess nucleotides or
enzymes that remained in solution (Wang, 2006). The clean DNA templates containing
the gene of interest along with the appropriate primer will be sent for automated
sequencing with Applied Biosystem’s 3730 DNA Analyzer (Applied Biosystems, Foster
City, CA). Once DNA sequencing is completed, the raw data will be basecalled to
decode the sequence. Refer to Appendix B for the protocols on DNA extraction, DNA
amplification and DNA purification during sample preparation.
3.3 Measuring Sequence Similarity
Once the reference and the query sequences are acquired, sequence alignment can be
done with the use of an alignment software. Given all possible ways of aligning the
sequences, how is the best alignment determined? Most alignment softwares are
integrated with an algorithm that searches for the optimal alignment. Briefly, the
algorithm assigns to each possible way of arrangement a score, which is defined as the
standard measure of sequence similarity within a set of aligned sequences (Lesk, 2002).
Depending on the algorithm that is used to perform the calculations, the best alignment
8
either reflects the maximum score or the minimum score from a set of aligned sequences
(Altschul, 1997). In the case where the maximum score is sought, a match in the aligned
sequence is granted a point, while a mismatch, a gap initiation, a gap extension, or any
deviation within the sequences will result in a penalty that contributes negatively to the
final score (Lesk, 2002). The summation of score bits finalizes the overall score of the
set of aligned sequences.
The scoring function that the algorithm refers to for score computation takes into account
various evolutionary factors. In the case of mutation detection, some substitutions occur
at a higher frequency than others. For example, in nucleotide sequence alignments, the
likelihood of a transition mutation is greater than that of a transversion mutation; that is,
substitution mutation of a purine to purine, or a pyridine to a pyridine are more
commonly observed than replacing a purine with a pyridine, or vice versa (Lesk, 2002).
Therefore, scores should be weighted accordingly to account for the frequency of certain
mutations; that is, a transition mutation should get a higher score than a transversion
mutation. The following example illustrates the principle of scoring behind a simple
sequence alignment:
Consider 2 short oligonucleotides
Reference: AATCTA
Query: AAGAT
The 2 sequences can be aligned in several ways:
AATCTA
| |
|
AATCTA
|
AATCTA
AATCTA
| |
| |
AATCTA
| |
|
AAGAT--
A--AGAT
AA--GAT
AAG--AT
AAGA--T
0
-15
-8
-8
-8
Score
Match: +3 Gap: -2 Mismatch: 0
9
AATCTA
--A AGAT
-15
Transition: -3 Transversion: -4
Figure 1: The basic principle of sequence alignment is demonstrated in the above illustration.
For simplicity, two short fragments are aligned with one superimposed on the other. Some of the
possible ways of aligning the reference and the query are shown. The score of each pair of
sequences is calculated based on the scoring scheme provided for this alignment. It appears that
the first alignment achieved the highest final score of 0 with 3 matches, 2 mismatches, 1 gap, and
2 transversion mutations (Lesk, 2002).
Most nucleotide sequence alignment algorithms refer to a scoring matrix to score a
particular alignment of sequences (Lesk, 2002). The matrix is filled based on the scoring
parameters that were set for the algorithm. The algorithm will then proceed with the
search for the best alignment by tracking a path along the matrix that produces the
highest score. Figure 2 below shows a scoring matrix that outlines a random scoring
scheme for simple substitution mutations. Here, the diagonal path exhibits the highest
score, meaning that aligning ATCG on top of ATCG will be the best alignment.
A
T
C
G
A
20
10
5
5
T
10
20
5
5
C
5
5
20
10
G
5
5
10
20
Figure 2. A substitution scoring matrix (Lesk, 2002).
The scoring scheme of different algorithms may be modified depending on the type of
alignment that the algorithm is designed to compute. Users are recommended to get
familiarized with the algorithms so they can select the most appropriate algorithm to
carry out the type of alignment that they want, generating the most ideal results suitable
for their purposes.
10
4.0 DIFFERENT TYPES OF SEQEUENCE ALIGNMENT
Different methods of alignments are available for different types of sequence alignment.
Many custom designed algorithms have been developed to suit different demands. For
example, different softwares are available to users who want to explore homology
between sequences, or say, study genetic variations within the sequences (Applied
Biosystems, 2002). Depending on the type of alignment that the algorithm is designed to
measure, the same set of sequences that is aligned in one will not necessarily give the
same alignment result in another. The key is to find out which type of alignment is to be
performed. Consider the following types of alignment: local vs. global, heuristic vs.
optimal, pairwise vs. multiple alignment. With an understanding of different alignment
methods, users can narrow down from a selection of softwares to the one that performs
the desired alignment.
4.1 Global vs. Local Alignment
In general terms, algorithms that are designed to perform global alignment attempt to
align every nucleotide in a set of aligned sequences. Given a set of sequences that are
different in length, gaps will be inserted into the shorter sequences in effort to span the
entire length of the longer sequence (Pearson and Wood, 2003). With global alignment,
it is most useful when the sequences to be aligned are approximately the same length.
…AATTCGATGGCAT TTGCATGAGA…
| || | || | ||
|| |
…CA--TCGGTGGCAC----GC--T…
Figure 3. Aligning two sequences globally
11
The method is effective for identifying frameshift mutations such as insertion or deletion
in one allele; gaps will be inserted into the positions where the insertion or the deletion
has occurred in the mutated allele (Pearson and Wood, 2003). One of the first algorithms
that was used to measure global optimal alignments is called Dynamic Programming.
While this method is guaranteed to find the global optimum, there are some
disadvantages to the technique (Lesk, 2002). First and foremost, the method inserts
excessive gaps into the sequences due to the nature of the algorithm. The region of
interest to be aligned will be stretched over the entire length of the longer sequences,
resulting in some biologically insignificant alignments that are not suitable for
comparison (Lesk, 2002). For the purpose of aligning sequences that only share a
specific region of similarity, local alignment would be the method of choice. The
algorithm uses a modified version of Dynamic Programming to search for the most
similar region between two or more sequences that might be dissimilar in context or
length (Lesk, 2002).
…AATTCGGTGGCATTTGCATGAGA…
| | || | || |
……..GCGGTGGCACGC…
Figure 4. Aligning two sequences with the local alignment method.
Local alignment produces a more biologically meaningful comparison that is useful for
investigating structural and functional aspects of the protein, or the similarity between
two or more nucleotide sequences (Altschul, 1997). Nevertheless, with sufficient
similarity displayed in the reference and the query, either the local or global alignment
method is able to accurately generate the most desirable alignment.
12
4.2 Pairwise vs. Multiple Alignment
The procedure of aligning two sequences is termed pairwise alignment. The method only
looks at two sequences at a time. On the other hand, multiple alignment is the process of
aligning more than two sequences simultaneously as the term implies (Dale and von
Schantz, 2002). Older algorithms perform pairwise alignment, using simple statistical
methods to compute sequence similarity. More sophisticated algorithms have been
developed to perform multiple alignment. For example, the progressive pairwise method
is a type of multiple alignment that first performs pairwise alignment and then
progressively compare the sets of aligned pairs to carry out multiple alignment (Altschul,
1997).
4.3 Optimal vs. Heuristic Alignment
Some famous alignment programs that utilize heuristic algorithms are BLAST and
FASTA. The theory behind heuristic methods is that the algorithm uses matching words
to perform sequence alignments (NCBI, 2006). The pairwise method first identifies a
short consensus common to the two sequences to be aligned. Based on the locally
identified consensus known as the word, the algorithm will continue to search for
matching pairs in both directions outwards from the word until a mismatch is
encountered, where the extension of the consensus will cease (NCBI, 2006). The longest
consensus common to both sequences will be displayed. This method of alignment is
good at identifying specific regions of similarity quickly in two unrelated sequences; it
will not miss the strong regions of similarity that might appear at different positions in
the aligned sequences (Pearson and Wood, 2003). However, heuristic alignment is an
approximation method which does not guarantee the search of the optimal alignment,
13
because the nature of the algorithm does not allow the introduction of gaps (Altschul,
1997). A better approach to generate biologically meaningful alignments is to align the
sequences optimally. Optimal alignment is a method to align sequences systemically
with the use of scoring matrices and gaps (Skiena, 2002). Both local and global
alignment algorithms use the optimal approach that allows the introduction of gaps to
align sequences (Skiena, 2002). Comparatively, the optimal approach is able to generate
a more desirable alignment between related sequences with a higher confidence than the
heuristic approach.
4.4 Choosing the Methods of Alignment
As mentioned previously, one of the tasks carried out in Dr. Hegele’s laboratory is to
identify SNPs and other genetic mutations such as insertions or deletions in patients’
DNA. Related exons of the gene of interest in the DNA sequences are examined
individually. Since the exons of interest are isolated and amplified in PCR using the
same pair of primers, the lengths of the query sequences are more or less the same in size
(Dale and von Schantz, 2002). With a reference sequence that displays similar length as
the query sequences, it is most preferred to align the sequences globally. However, with
an alignment software that is not able to truncate the reference to show a similar length as
the query sequences, local alignment would be the method of choice. The method will
match the query sequences to the most similar region in the reference without inserting
unnecessary gaps into the sequences.
Furthermore, it would be more time efficient if the software we use is able to perform
multiple alignment. Considering the large number of sample sequences to be analyzed,
the most convenient method is to compare more than two sequences simultaneously.
14
With multiple alignment, SNPs that are present in the samples can be picked out all at
once. The convenience that multiple sequence alignment provides is invaluable to the
busy laboratory setting.
Lastly, since the sequences that we analyze show sufficient similarity with one another,
the best approach is to use optimal alignment that is most effective when comparing
related sequences. The heuristic approach should not be used since the method cannot
identify major insertion or deletion mutations.
4.5 The Currently In-use Software in RRI
In the laboratory, the alignment software that is currently in use for sequence alignment
analysis is the Sequence Navigator software v1.1 from Applied Biosystems. The
software has limited alignment features, and is only capable of doing pairwise analysis.
The software is discontinued in the market because more updated versions of the
software have been developed for enhanced usage (Applied Biosystems Technical
Support).
It would be beneficial to the laboratory to gain assess to a sequence alignment software
that can perform multiple alignments to save time. More importantly, having a software
that performs the desired type of alignment ensures accuracy of mutation detection. The
convenience and quality alignments that such a software offers are invaluable to the busy,
research-intensive laboratory.
15
5.0 THE THREE ALIGNMENT SOFTWARES AVAILABLE IN RRI
Fortunately, we have licenses to three additional alignment softwares integrated with new
and improved alignment functions and features suitable for complicated sequence
alignments. The three softwares that are available for use are Applied Biosystems’s
SeqScape® Version 2.0, DNAStar’s Lasergene® Version 7.0, and Gene Code’s
SequencherTM Version 4.7. This section of the report will briefly describe the softwares’
features related to nucleotide sequence alignment.
5.1 ABI SeqScape® Version 2.0
Applied Biosystems’ SeqScape software is a sequence analysis program that processes
electropherogram traces or the raw data generated by an automated sequencing system.
Although the software is mainly used for sequence editing, users have the option to align
their sequences once they have been base called. The software uses the famous SmithWaterman local alignment algorithm to align the base called sequences with a userdefined reference (Applied Biosystems, 2002). Although the algorithm is technically a
pairwise method, the software is designed in such a way that it is capable of displaying
more than two sequences simultaneously in the same window, all of which have been
analyzed and aligned with the reference sequence. This technique is known as the
progressive pairwise alignment method (Applied Biosystems Technical Support, 2006).
The software is ideal for investigators who are conducting in-depth studies of various
gene segments along the same reference sequence.
16
5.1.1 Aligning Sequences with SeqScape
Users are recommended to follow the software’s set up procedures before performing
sequence analysis (Applied Biosystems, 2002). Briefly, the protocol is outlined as
follows:
1. Create Analysis Defaults
Figure 5. The analysis protocol editor.
a) In the Basecalling tab, users select from the drop-down menus the automated
sequencer as well as the Dye set they use for sequencing. Users can also tell
the software when to stop the basecalling, whether it is at a PCR stop or at a
position where a specific number of ambiguities (N) has been displayed.
b) In the Mixed Bases Tab, the Mixed Base Identification option can be used in
case of encountering a heterozygous allele. The option takes into effect if the
second peak height is of a certain percentage (user-defined) of the main peak
height (Figure 5).
c) The parameters listed in the Clear Range tab enable users to define the quality
of their sequences. For example, the software can be instructed to display the
sequence in between a certain range where all other ambiguous bases outside
of the range are trimmed.
d) In the Filter tab, users can reject sequences that are of poor quality by
defining the parameters of a good quality sequence.
17
2. Define Analysis Settings
Figure 6. Analysis settings.
a) The software’s alignment algorithm uses the numeric values entered in the
Gap and Extension Penalties fields in the Project and Specimen tabs
respectively to score an alignment with gaps (Figure 6).
3. Define Display Settings
Figure 7. Options in Display Settings.
a) Users can customize the appearance of the screen layout by choosing the
colours and text styles according to their preference. The software also allows
users to choose which icons or features are to be shown and which ones to be
removed (Figure 7). For example, it can show or hide electropherogram(s),
the reference sequence, the corresponding amino acid sequence, the
consensus, and variants, etc.
18
4. Create Reference Data Group
Figure 8. Reference Data Group settings.
a) Users can either import a reference sequence from NCBI’s Entrez database, or
copy-and-paste a sequence from another source.
b) Users can define as many regions of interest (ROIs) as they desire in separate
layers so that the sequences, when imported, will only align with that
particular segment of the reference.
5. Create Project Template
6. Import Sequence Samples
7. Perform Sequence Analysis
Reference Sequence
Query Sequences
Figure 9. The Layout view.
a) The software is able to display the sequences’ relative positioning along the
reference using the Smith-Waterman local alignment algorithm. The
sequences, represented as arrows, are positioned at their alignment sites
against the reference. Furthermore, the direction of the arrowheads is
19
indicative of the orientation of the sequences.
b) One of the components of the alignment report is the Mutation Report. In the
report, any variations observed that is different from the reference are listed in
the table. It identifies the mutation (ie. Base change, Insertion, or Deletion),
its position in the sequence, the type of mutation and its effect on the sequence
(ie. Missense, Nonsense, or Silent).
5.2 Lasergene® Version 7.0
Lasergene is a sequence analysis software with five applications: SeqBuilder, GeneQuest,
PrimerSelect, Protean, and MegAlign. The software features synchronous updating
which allows users to work on the same file in any or all of the applications at the same
time (DNASTAR, 2006). The applications that concern sequence alignment are
SeqBuilder and MegAlign, which will be introduced as follows. Refer to the user guide GETTING STARTED with DNASTAR Lasergene 7: Software Suite for Sequence Analysis
for more information.
5.2.1 SeqBuilder
SeqBuilder is a powerful program that allows users to design their own DNA sequence
by entering individual nucleotides (A, T, C, or G) into the program, or by just simply
pasting any sequences that they have copied from another source. Users can also edit the
copied sequence with the program to make modifications as they need. The program is
also capable of identifying any open reading frames and enzyme restriction sites for
cloning purposes. Other useful features include translating, back-translating, and
selecting the reverse complement of the newly designed DNA.
20
5.3.2 MegAlign
MegAlign performs sequence comparison with either nucleotide or protein sequences,
and is able to do both pairwise and multiple alignments. Based on the aligned sequences,
the program can generate phylogenic trees, alignment reports and tables to summarize the
match results and variants identified within sequences. Four algorithms are available to
perform pairwise sequence alignments. The users can choose to display a dot plot from
each for a visual representation of the alignment. Furthermore, four additional algorithms
are designed for multiple sequence alignments. The Jotun Hein algorithm is designed for
multiple protein sequence alignments, while Clustal V and two Clustal W are suitable for
multiple nucleotide sequence analyses (Gindullis et al., 1999). The Clustal algorithms
are the most commonly used statistical measures that exploit the progressive pairwise
method to carry out multiple alignments. Clustal V is a global multiple alignment
method, while Clustal W is a local multiple alignment method.
5.3.3 Aligning Sequences with Lasergene
Aligning nucleotide sequences in Lasergene is rather simple. For reference and query
sequence comparisons, users can either import their reference from NCBI’s Entrez
database, or use a pre-existing reference file in MegAlign. Users can also take advantage
of the synchronous updating feature in Lasergene to transfer their reference sequence
designed in SeqBuilder. The following example shows the procedure of aligning a few
LPL1 exon 5 sequences with the appropriate reference obtained in NCBI database;
additional features relating to the alignment are also described.
1
LPL is the gene that encodes the protein Lipoprotein Lipase. The deficiency of the protein leads to the accumulation
of triglyceride which leads to high blood pressure and potentially the development of atherosclerosis. The gene
sequence is extracted in patients’ DNA for mutation detection analysis (NCBI, 2006).
21
1. Edit the Reference Sequence in SeqBuilder
Figure 10. Editing the sequence in SeqBuilder.
a) The reference sequence can be edited in SeqBuilder so that only the region of
interest, or the segment that is relevant for alignment is displayed. At the top
right corner, the sequence’s length is displayed. The ruler beneath the
sequence is included to indicate the base position.
2. Import the Reference Sequence to MegAlign
Figure 11. LPL Exon 5 is imported in MegAlign.
a) The reference is sent to MegAlign as shown in the working panel above. The
sequence is displayed in two separate panels. Users can scroll along the scroll
bar to view a particular section of the sequence that they want to examine.
The coloured bar at the top of the window is the consensus meter, which
shows the consensus strength. The colour scheme shown at the left of the
consensus meter is indicative of the relative strength of the consensus (Red
indicates the strongest consensus, black indicates the weakest consensus).
Two rows below the consensus meter is the position ruler. It helps identify
the position of the bases in the sequence.
22
3. Import Sequence Samples into the Project
Figure 12. Imported sequences are listed below the reference sequence.
a) Imported sequences are listed below the reference sequence. Note that the
consensus meter is now displaying different colours due to the variations
shown in the sequences. Because the software does not recognize a particular
sequence as the reference sequence, the consensus sequence is reflective of all
sequences listed in the panel.
4. Trim Sequence Samples
Figure 13. Setting the 5’ and the 3’ ends of the sequences.
a) The “N” represents an ambiguity in the sequence. They are usually present at
the beginning of the sequences as they are the priming regions. Clean
sequences can be obtained by specifying the start and end positions for
trimming. There is also the option to select the complementary strand of the
sequence if it appears in the opposite orientation. The coloured bases
represent variants that are different from the consensus.
23
5. Select an Alignment Method
Figure 14. Three multiple alignment algorithms are available for selection.
a) Sequences can be aligned by selecting the appropriate algorithm under the
Align command. Clustal V and Clustal W algorithms are the methods suitable
for aligning multiple sequences simultaneously.
Example:
Consensus Strength Meter
Variants are indicated with another colour
Gaps are indicated with a dash
Figure 15. The sequences are aligned with Clustal V.
b) In this example, Clustal V is chosen to perform the alignment. It is a global
multiple alignment method where sequences are spanned in attempt to align
nucleotides starting from the first nucleotide in the longest sequence until the
end is reached.
24
6. Examine the Alignment Report
Figure 16. A SNP is identified in sample 18.
a) The alignment report summarizes any mutations detected within the aligned
set of sequences. In this case, a SNP is identified in sample 18LPLOTV#41A_B0.seq.
Users can also choose another algorithm for alignment depending on the nature and
characteristic of their nucleotide sequences.
5.3 SequencherTM Version 4.7
Sequencher 4.7 is a sequence analysis software that specializes in contig assemblies. It
aligns overlapping regions of short sequence fragments, which at the end, will put
together a complete nucleotide sequence (Figure 17). Users can take advantage of the
algorithms used for contig assembly to perform sequence alignment. The algorithms,
Dirty Data, Clean Data, and Large Gap, are modified versions of the Smith-Waterman
local sequence alignment algorithm (Tippmann, 2003). In particular, the Dirty Data
algorithm can align sequences that are untrimmed at the 5’ or the 3’ end. Aligning
sequences containing ambiguities (N) that are possibly caused by a substitution or a
frameshift mutation with Dirty Data will not affect the alignment result. Clean Data
25
algorithm is designed to align sequences that are trimmed as the name suggests. The
sequences that are to be aligned with this particular algorithm should not contain any
ambiguities. It is recommended to exclude the use of poor quality data with this
algorithm. Finally, the Large Gap algorithm is designed to align large DNA such as
genomic or cDNA. It is able to accept gaps that are larger than two bases long in the
overlapping regions between DNA fragments during contig assembly (Ginsburg, 2006).
Figure 17. A map of overlapping contigs.
5.2.1 Aligning Sequences in Sequencher
Sequencher software is compatible with sample files that are in .ab1 format. Just like
SeqScape, the software is able to accept and analyze traces of raw data for alignment
purposes. The following provides an overview of aligning nucleotide sequences in
Sequencher. More information can be found the Gene Codes Sequencher 4.7 website at
www.genecodes.com
26
1. Import the Reference Sequence
Figure 18. A reference sequence is pasted to the sequence editing panel.
a) A reference sequence can be copied and pasted to Create New DNA window.
This sequence should be set as the reference sequence under the Sequence
command. Sequences in this panel can be trimmed by simply deleting all the
bases that are not desirable.
2. Import Sequence Samples
Figure 19. Samples are imported for analysis.
a) All the samples to be aligned are listed in the panel along with the reference
sequence.
3. Choose Assembly Parameters
Figure 20. Three algorithms are available for alignment.
27
a) Since the samples imported into the software are traces of raw data that have
not been processed, the Dirty Data algorithm is chosen to perform the
sequence alignment.
4. Align Sequences to Reference
Figure 21. Sample sequences are aligned along the reference sequence.
a) In the overview, all sequences are shown at their aligned position relative to
the reference sequence. Each sequence is labelled with the corresponding
sample name. Green arrows indicate the sequence is being read in the forward
direction, while red arrows indicate that the sequences are in the reverse
direction.
5. Analyze the Aligned Sequences
Figure 22. The samples are aligned with respect to the reference sequence.
a) All the sequences are aligned against the reference sequence. The reference
sequence is distinguished by a row selector. The different shades of blue
represent the degree of ambiguity of the base at the particular position. The
consensus sequence is easily identified at the bottom of the panel. The +
28
symbol represents an ambiguity and the ● symbol represents a base change at
the corresponding position.
Figure 23. The double peak represents a heterozygous allele in the sample.
a) The Show Electropherogram option allows traces of raw data to be displayed.
The electropherogram can be used for the visual inspection of the
heterozygous allele if a base change is encountered. One can also tell the
orientation of the sequence by observing the arrow shown at the top left
corner. In this case, the arrowhead points forward, meaning that this
particular sequence in the forward direction.
6. View the Alignment Report
Figure 24. A variant is noted in sample 18 in the report.
a) The alignment report summarizes the finding of all variants in the samples.
29
6.0 ASSESSMENT OF THE THREE ALIGNMENT SOFTWARES
Aligning DNA sequences with a software that produces quick and accurate alignment
results will improve work and time efficiency in the laboratory. In order to decide which
software is able to carry out sequence alignments most effectively, the same set of
sequences will be aligned respectively in all three softwares (SeqScape, Sequencher, and
Lasergene). The alignment results generated by the softwares will be used for
comparison. The parameters of the assessment include the software’s accuracy in
determining the location of existing mutations, the amount of sequences that the software
can handle vs. time efficiency, the ease of use and cost.
6.1 Accuracy of Sequence Alignment
6.1.1 SNP Detection
In this experiment, 10 LPL exon 5 sequences are chosen to align with the corresponding
reference sequence to test the software’s ability to detect the presence of SNPs at the
accurate position. One of the sample sequences, 18-LPLOTV#41A, is known to carry a
C/T SNP at position 15013 relative to the LPL gene reference, or at position 163 relative
to the LPL exon 5 reference (Wang, 2006).
Results
i) Aligning the Sequences in Lasergene
Figure 25. A SNP, represented as an N, is detected in sample 18 at position 163.
30
ii) Aligning the Sequences in Sequencher
Figure 26. The double peak shown in the electropherogram confirms that the SNP
detected in sample 18 is a C/T SNP.
i) Aligning Sequences in SeqScape
Position 15013
Figure 27. The mutation report in SeqScape identifies that the mutation found in sample18
is a substitution mutation of a C to a T.
31
Analysis
All three softwares were able to correctly identify the position of the SNP in sample
18. The variation was either highlighted in a different colour (Lasergene and
Sequencher) or marked with a dot (SeqScape) for easy recognition. The ruler feature
in the software conveniently allows users to identify the position of the variation
along the reference or the consensus sequence. In both SeqScape and Sequencher,
the electropherograms that complemented the sequences provide a visual
representation of the SNP. Both the electropherogram showed a blue red double peak
at the SNP position, confirming C and T base substitution. In addition, the mutation
report included in SeqScape verifies that the SNP is a substitution of the C allele.
Other details about the mutation such as the type of mutation were also addressed in
the report. Although MegAlign was also able to identify the presence of the SNP at
the correct location, it cannot distinguish the substitution. Users will not be able to
tell what the base change was because the SNP was base called as N, which
represents an ambiguity in the sequence.
6.1.2 Heterozygous Insertion/Deletion Detection
Frameshift mutations occur when a mutation in gene sequence acquires an insertion or a
deletion of nucleotides that interferes with the normal reading frame of the sequence.
The mutation is heterozygous if the variation occurs only in one of the two alleles of the
DNA (Wang, 2006). The mutation is characterized by overlapping peaks that usually
start off in the mid-section of the electropherogram.
In the second part of the assessment, eight APOCII genes are chosen to test the
software’s ability to identify the bases that have been inserted or deleted within the set of
32
sequences. One of the sequences, 93-APOCIIOTV22A2, is known to carry a TCT
insertion between position 3029 and 3030, just after the G/C SNP (Wang, 2006).
Reference: ..AGCCCG-----TCCTCCCTCAGA..
Query:
..AGCCCCTCTTCCTCCCT..
Figure 28. Three nucleotides TCT were inserted in sample 93.
Result
i) Aligning the Sequences in Lasergene
Figure 29. Sample sequences are aligned with Clustal W. The G/C SNP was identified;
however, the insertion was not detected because the mutated heterozygous allele was not
base called. The program only base calls for the higher peak.
ii) Aligning the Sequences in Sequencher
Figure 30. The G/C SNP was identified with Sequencher. The heterozygous allele was
not base called however.
33
iii) Aligning Sequences in SeqScape
3 bases are inserted between position 3029 and 3030
Figure 31. The software picked up both the SNP as well as the insertion mutation.
Analysis
As shown in Figures 29-31, all the softwares were able to pick up the G/C SNP.
However, only SeqScape was able to identify the TCT insertion in the sample. In
both MegAlign and Sequencher, the insertion was not detected because the program
was not able to base call the heterozygous allele. It was set by default that the higher
peak is to be base called in the case of encountering an overlapping peak on the trace
data. Due to the nature of the reference and query sequences, the pair of sequences
gave a false impression to align with the reference sequence perfectly even with an
existing insertion. On the other hand, SeqScape was able to base call the
34
heterozygous allele and identify the insertion of the three bases. In the mutation
report, it explicitly stated that an insertion of TCT occurred in position 2029-2030,
causing an in-frame mutation.
6.1.3 Homozygous Insertion/Deletion Detection
Homozygous insertion or deletion occurs when the same bases are inserted or deleted
from both the alleles of the DNA at the same location. The mutation is not noticeable on
the electropherogram unless the sequence is aligned with its corresponding reference
sequence (Wang, 2006). The test sequence that will be used for the assessment for
homozygous mutation is a self-created sequence with three deletions based on the LPL
Exon 5 reference sequence, as shown in Figure 32.
Figure 32. Three regions in the reference are deleted to create the new query sequence.
This sequence will be imported into the softwares to examine the efficacy of the
software to detect the three major deletions. The expected result should contain 3
gapped regions at the position where the deletion was made to occur, as shown in
Figure 33.
Figure 33. The expected alignment result.
35
Result
i) Aligning Sequences in Lasergene
Figure 34. Sequences aligned with Clustal V, the global multiple alignment algorithm.
ii) Aligning Sequences in Sequencher
Figure 35. Clean Data algorithm was used to align the two sequences.
iii) Aligning Sequences with SeqScape
Figure 36. The software identified the three major deletions at the correct positions.
36
Analysis
Both the softwares Lasergene and SeqScape were able to pick up all three major
deletions in the sequences. Clustal V was chosen to perform the alignment because
the reference and query sequences have similar length. Since the algorithm applies
the global alignment method, it made the detection of the three deletions possible.
Similarly, the Smith-Waterman local alignment algorithm in SeqScape matches the
test sequence to the region of the reference where highest similarity is observed.
Gaps were inserted accordingly to the corresponding positions where the deletion was
created. Furthermore, the software’s mutation report indicated exactly where the
deletion occurred, identifying the deleted bases accurately. Sequencher, however,
was only able to identify the one base deletion. A possible explanation of the
occurrence might have to do with the nature of the algorithm that was used to align
the sequences. Since the custom-designed algorithm Clean Data employs a different
scoring parameter intended for assembling contigs, it was not expecting gaps bigger
than two bases as expected in result shown in Figure 33.
6.1.4 Summary
The assessment shows that all softwares – Lasergene, Sequencher, and SeqScape – were
able to pinpoint the position of the SNP accurately. The show electropherogram feature
in both Sequencher and SeqScape allows one to unravel the identity of the SNP.
SeqScape is also integrated with special base calling features with improved abilities to
interpret traces. The software demonstrated its ability to recognize and identify the
presence of SNPs, and insertion and deletion of bases in one or both alleles at the correct
position. Since the software is intended to process the trace data generated by the
37
automated DNA sequencer we use in the laboratory, users can take advantage of the
features that are compatible to the file type for quality alignment.
Lasergene’s MegAlign is also integrated with the appropriate algorithms to carry out the
detection. The software is effective in identifying homozygous insertion or deletion in
both alleles, where the sequence is of good quality with confident base calls. However,
the alignment is not effective with poor quality data. Although users have the option to
select either Clustal V or Clustal W to align their sequences depending on the condition
of the sequences, the software has a different base calling setting that neglects the
presence of the heterozygous allele. Sometimes basecalling could not be made as the
software reports any ambiguity in the sequence as an N.
Lastly, it was shown that Sequencher is not able to recognize any of the frameshift
mutations. The algorithms designed for the software are intended for contig assembly
that can only accommodate minor gaps. Furthermore, the default base calling settings in
the software do not consider the heterozygous allele. The software is not suitable for
frameshift mutation detection.
6.2 Time Effectiveness
All three softwares are capable of performing either multiple sequence alignment or
progressive pairwise alignment, where numerous pairwise alignments are simultaneously
carried out (Altschul, 1997). In the following assessment, sequences in multiples of ten
(up to 60 sequences) will be entered into the softwares to examine time efficiency of each
alignment software.
38
Result
i) Lasergene
Table 1. Aligning sequences in MegAlign
Number of Sequences
10
20
30
40
50
60
Time (s)
10
22
38
68
100
147
ii) Sequencher
Table 2. Aligning sequences in Sequencher
Number of Sequences
10
20
30
40
50
60
Time (s)
<1
<1
<1
<1
1
1
iii) SeqScape
Table 3. Aligning sequences in SeqScape
Number of Sequences
10
20
30
40
50
60
Time (s)
21
41
60
80
99
121
Tables 1, 2 and 3 show the time the softwares take to process the alignment as the
number of sequences increase. With the exception of Sequencher, it is observed that
the processing time is proportional to the number of sequences being analyzed with
the other two softwares.
39
Figure 37. The amount of sequences the softwares can handle with time.
Time (s)
Number of Sequences vs. Time
160
140
120
100
80
60
40
20
0
10
20
30
40
50
60
Number of Sequences
SeqScape
Sequencher
MegAlign
Analysis
In general, with the exception of aligning sequences in Sequencher, the time it
requires to complete the alignment process is proportional to the number of sequences
imported into the software. In SeqScape, a linear relationship is observed as the
number of sequences increase with time; while in Lasergene, a power curve is
observed between the number of sequences and time (Figure. 37). The more
sophisticated algorithms such as Clustal V and Clustal W require much longer time to
complete the alignment process (Altschul, 1997). Aligning sequences in Sequencher
is most time efficient as the alignment process only takes an average of one second to
complete (Table 2). Although the matching process slows down with the increasing
number of sequences, all three softwares were able to generate the alignment result
under 30 seconds when aligning 10 sequences at a time.
40
6.3 Ease of Use
6.3.1 SeqScape
The set-up procedures of the software are quite complicated for first time users. Once the
user-specified settings are instructed to the software, later procedures are relatively
simple. Although the trimming option is available, the software is still able to work with
poor quality sequences and make corresponding matches to the reference. Ambiguities in
the sequence will not affect the alignment result. In addition, the software can
automatically convert the sequences to the correct orientation relative to the reference.
Users do not have to worry about translating the sequences into their reverse complement
if the sequences were amplified in the opposite orientation.
In terms of the software’s design, the layout of the software can be customized according
to personal preference. Some users might find the colours distracting as the reference
sequence is not distinguished from the sample sequences. With the addition of coloured
electropherograms, users might experience difficulties distinguishing one sample from
the next. To improve the view, users can choose to display one electropherogram at a
time.
6.3.2 Lasergene
Lasergene’s simple software design allows for easy and quick identification of mutations.
The procedure of aligning sequences with the software is simple and straight forward.
The software works best with good quality sequences. The untrimmed 5’ and 3’ ends as
well as the ambiguities within the sequences will affect the alignment result, since the
software does not recognize a particular sequence as the reference. Raw data have to be
41
trimmed individually to obtain clean sequences. Furthermore, the software cannot
automatically translate the sequences to the correct orientation if the samples were
sequenced in the opposite orientation as the reference. It is very time-consuming to
convert the sequences back to the right orientation because users have to repetitively
select the Select complementary option one by one for all sequences that exhibit the
opposite orientation.
6.3.3 Sequencher
Sequencher is a user-friendly, well-designed sequence analysis tool. Users simply import
their reference and working sequences into the program. The sequences will be aligned
automatically by clicking the Assemble To Reference button. There is the option to set
the nucleotides to specific colours according to users’ preference. Located at the bottom
of the working panel, the consensus sequence is easily distinguishable. Symbols are used
to mark any variation that is different than the consensus. The reference to which all the
sample sequences are aligned against is also marked so it can be easily identified.
All aligned sequences are displayed in a contig map where users can observe the relative
positioning of all sample sequences that are aligned to the reference. Each sequence
fragment is labelled with its sample name for identification purposes. In addition, the
orientation of each fragment is represented by the direction of the arrow. The software
automatically converts the sequences into the correct orientation relative to the reference.
However, in order to produce ideal results, individual sequences have to be trimmed
which requires a lot of base deleting work. With many sequences to align at once, the
editing becomes repetitive.
42
6.4 Cost Analysis
Table 4. Quotes for the alignment softwares.
Initial License Cost
Service Plan Renewal
SeqScape
Lasergene
Sequencher
$8820 (CND)
-
$4496 (USD)
$3450 (USD)
$325 (USD)
$780 (USD)
Table 4 outlines the initial license cost of the three sequence alignment softwares. The
initial license cost of SeqScape Software is $8820 CND, which is about double the cost
of Lasergene and Sequencher. Lasergene from DNASTAR costs $4579 USD with a
$780 dollar annual service plan renewal, while Sequencher from Gene Codes cost $3450
USD with an annual cost of $325 USD. SeqScape is the most expensive alignment
software; however, considering the multiple tasks that it can perform, the software is a
worthwhile purchase.
6.5 Summary
The following tables summarize the features and functions of the three alignment
softwares.
Table 5. The alignment algorithms of the three softwares.
Local Alignment
SeqScape
Lasergene
Sequencher
√
√
√
Global Alignment
√
Multiple Alignment
√
√
√
Optimal Alignment
√
√
√
Table 5 outlines the types of alignment that each of the softwares can perform.
Lasergene can carry out all four types of alignment – local, global, multiple and optimal.
SeqScape and Sequencher can only perform three types of the four.
43
Table 6. The mutation detection efficacy of the softwares.
SeqScape
Lasergene
Sequencher
SNP
5
3
5
Homozygous Mutation
5
4
3
Heterozygous Mutation
5
3
2
Overall
15
10
10
The above evaluation ranks the software’s ability to detect mutations in a scale of 5, with
5 representing the highest score. SeqScape scored the highest as it is capable of
recognizing all three types of mutation. Lasergene and Sequencher both achieved
equivalent scores. Lasergene is not the ideal software to detect the identity of the SNP as
well as mutation in one allele. Sequencher is not the ideal tool to identify frameshift
mutations in general.
Table 7. The ease of use of the softwares.
SeqScape
Lasergene
Sequencher
Appearance
3
4
5
Setup Procedures
4
3
4
Alignment features
5
2
3
12
9
12
- Select Reverse Complement
- Work with Poor Quality Data
- Trimming Options
Overall
The above evaluation looks at the ease of use of the softwares in a scale of 5, with 5
representing the highest score. Both SeqScape and Sequencher scored the highest overall
score for its well-designed layout as well as the ease of use.
44
7.0 CONCLUSION
The SeqScape sequence analysis software from Applied Biosystems is thought to be the
most effective sequence comparison tool that best suits the purposes of Dr. Hegele’s
research. As shown in Tables 5-7, the software obtained the highest overall score
regarding the assessment of its alignment features, accuracy in mutation detection, and
ease of use.
SeqScape is shown to produce the most accurate alignment results. The Smith-Waterman
local alignment algorithm that the software uses can accurately position the exon
sequences of interest to the corresponding region of the reference, allowing biologically
meaningful comparison between sequences. SeqScape software’s design for processing
high quality sequences, as well as its ability to produce accurate alignment enhances the
SNP and insertion and deletion detection process.
Furthermore, the software is capable of aligning more than two sequences
simultaneously. The successive pairwise alignment method allows the software to
perform multiple exon alignments all at once. The method greatly improves time
efficiency which is invaluable to the busy lab setting.
Lastly, SeqScape’s comprehensive user manual, its fine layout, and immediate response
to queries from the company’s technical support team generally accounts for the userfriendliness of the software. Customer services and technical support are freely available
for novice users who want to get familiarized with the software.
45
8.0 RECOMMENDATION
It is the researchers’ goal to obtain reliable experimental results before drawing a valid
conclusion to support their research hypotheses, including scientists at RRI. In order to
further improve the reliability of the sequence alignment results with Dr. Hegele’s
research, the following approaches are recommended for effective alignment
performance.
1. Perform Alignment in All Three Sequence Alignment Softwares
Although the SeqScape Software has demonstrated to align sequences most effectively,
sequences should be aligned in more than one alignment software to confirm the presence
of any newly discovered mutations in the sample sequences. The position as well as the
identity of the mutation should be double-checked to ensure the reproducibility of
alignment the results.
2. Avoid Analyzing Large Quantity of Sequences Simultaneously
To improve the time efficiency of sequence alignment, it is recommended to align and
analyze no more than 20 nucleotide sequences at a time. Although SeqScape is capable
of analyzing and comparing as many sequences as the user desires, the time it requires to
complete the alignment increases with the number of sequences. With less than 20
sequences to align per analysis, the alignment results are generated almost immediately.
46
9.0 REFERENCES
Altschul, Stephen F. (1997) Sequence comparison and alignment. In: Bishop, M.J. and
C.J. Rawlings (Ed.) DNA and Protein Sequence Analysis: A Practical Approach
(pp. 137-168). New York: Oxford University Press, Inc.
Applied Biosystems, 2002. ABI Prism SeqScape Software Version 2.0 User Guide.
Applied Biosystems Technical Support. 15 December 2006.
Dale, Jeremy W. and Malcolm von Schantz. From Genes to Genomes: Concepts and
Applications of DNA Technology. West Sussex: John Wiley & Sons, Ltd., 2002.
DNASTAR Inc., 2006. GETTING STARTED with DNASTAR Lasergene 7: Software
Suite for Sequence Analysis
Engelking, Jeff. DNASTAR, Inc. Technical Sales Consultant. 18 December 2006.
Gindullis, Frank, Nancy J. Peffer, and Iris Meier (1999). MAF1, a Novel Plant Protein
Interacting with Matrix Attachment Region Binding Protein MFP1, Is Located at
the Nuclear Envelope. The Plant Cell, 11, 1755-1767.
Ginsburg, Michelle (PhD). European Technical Manager, Gene Codes Corporation. 18
December 2006.
Lesk, Arthur M. Introduction to Bioformatics. New York: Oxford University Press, Inc.,
2002.
Madden, Tom (2003). The BLAST Sequence Analysis Tool. In: The NCBI Handbook.
Retrieved December 27, 2006, from
http://www.ncbi.nlm.nih.gov/books/bv.fcgi?rid=handbook.chapter.ch16
Pearson, W.R. and T.C. Wood (2003). Statistical Significance in Biological Sequence
Comparison. In: Balding, D.J., M. bishop and C. Cannings (Ed.) Handbook of
Statistical Genetics, 2nd Edition (pp. 39-65). West Sussex: John Wiley & Sons, Ltd.
QIAGEN (2002-2006). QIAquick® Spin Handbook.
Skiena, Steve (2002). Motifs and Multiple Sequence Alignment. Retrieved December 27,
2006, from http://www.cs.sunysb.edu/~skiena/549/lectures/msa/msa.html
Tippmann, Helge-Friedrich (2003). Comparing programs for sequence analysis.
Briefings in Bioinformatics, software review DRAFT. Denmark: Plant Research
Department, Risø National Laboratory.
Wang, Jian. Research Assistant, Blackburn Cardiovascular Genetics Laboratory.
Department of Vascular Biology. Robarts Research Institute. Interview, December
2006.
47
APPENDIX A: HOW TO OBTAIN A REFERENCE SEQUENCE?
I. Obtaining a Reference Sequence from NCBI
i. In an internet browser, type in the web address: http://www.ncbi.nlm.nih.gov
ii. Under the Search field, select Gene
iii. Type in the name of the gene that is to be used as reference in the alignment (ie.
LPL – Lipoprotein Lipase)
iv. Select the corresponding species that the reference is extracted from (ie. Homo
sapiens)
v. Click on Go to reference sequence details to view the sequence
48
vi. Select and copy the portion of the reference sequence that is to be compared
against
II. Obtaining a Reference Sequence from Ensembl
i. In an internet browser, type in the web address: http://www.ensembl.org
ii. Enter the name of the gene that is to be the reference (ie. LPL)
iii. Select Exon Info
iv. Select and copy the exon that is to be compared against (ie. Exon 5)
49
APPENDIX B: SAMPLE PREPARATION
I. DNA Extraction
In Dr. Hegele’s lab, scientists use the PUREGENE® Kit to carry out DNA extraction.
Below is a brief overview of the extraction process. Refer to PUREGENE® DNA
Purification Kit: DNA Purification Protocol For 10 ml Fresh Whole Blood at the website
http://www.isisco.ie/isis/Main/Lifesciences%20Gentra.htm for the complete protocol.
1. Obtain blood samples.
2. Add the appropriate amount of RBC (Red Blood Cell) Lysis Solution to the
whole blood sample to remove red blood cells.
3. Mix the solution. Incubate the solution at room temperature for 5 minutes.
4. Centrifuge the solution for 5 minutes. Remove the supernatant and keep the white
cell pellet and 200-400 µl residual liquid.
5. Mix the solution well. Resuspend the pellet in the residual liquid with Cell Lysis
Solution to lyse the white blood cells in the sample. Incubate the cell lysate at
37o.
6. Add the appropriate amount of Protein Precipitate Solution to the cell lysate.
7. Mix the Protein Precipitate Solution uniformly with the cell lysate to obtain a
homogeneous solution.
8. Centrifuge the solution for 5 minutes.
9. To the supernatant containing the DNA, add the appropriate amount of
isopropanol to precipitate the DNA.
10. Centrifuge the mixture for 3 minutes. DNA will be in form of a white pellet.
11. Remove the supernatant. Add 70% ethanol to wash the pellet containing the
DNA.
12. Dry the DNA pellet.
13. DNA Hydration Solution is added to preserve and hydrate the pellet. Store the
DNA at 4o.
II. Isolate the Gene of Interest
In order to obtain the desired region in the DNA for sequence comparison, a pair of
primers has to be designed to flank the gene of interest. During primer design, one has to
ensure the same annealing temperature and GC content for both primers. Primers are
usually designed so that they anneal to the template 50 base pairs away from the gene to
be amplified. The gene of interest can then be amplified with the appropriate primers
using the PCR (Polymerase Chain Reaction) machine (Wang, 2006).
50
III. DNA Purification
The laboratory currently uses Qiagen’s QIAquick® PCR Purification Kit to purify the
amplified gene of interest produced from the previous PCR reaction. The procedures are
described as follows. Refer to the QIAquick Spin Handbook for the complete protocol on
DNA purification.
1. Add the QIAquick’s Buffer PBI to the PCR product in the ratio of 5:1.
2. Check to make sure that the colour of the mixture is yellow to ensure the correct
pH range.
3. Place a QIAquick spin column in the collection tube provided.
4. Add the PCR product to the spin column to bind DNA. Centrifuge for 30-60s.
5. Discard the waste that passed through the spin column. Place the column back
into the same tube.
6. Wash the DNA by adding a small amount of Buffer PE to the column and
centrifuge for another 30-60s.
7. Discard the flow-through and place the column back to the tube.
8. Elute the DNA by adding the correct amount of Buffer EB or water to the
QIAquick membrane to ensure the right concentration. Centrifuge for 1 minute.
9. The purified DNA can be collected after the DNA has passed through the
membrane.
51