1
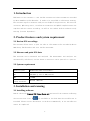
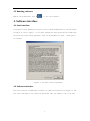
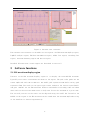
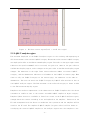
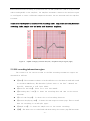
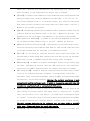
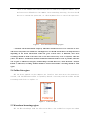
ECGViewer User’s Manual Version:1.2 Table of Contents 1. Introduction ......................................................................................................... 2 2. Product features and system requirement ........................................................ 2 3. 2.1 2.2 2.3 Review ECG recordings................................................................................................ 2 Measure and print ECG data ........................................................................................ 2 System requirement..................................................................................................... 2 Installation and running ............................................................................. 2 3.1 Installing software ............................................................................................................ 2 3.2 Running software ......................................................................................................... 3 4. Software interface................................................................................................ 3 5 4.1 Start interface ................................................................................................................... 3 4.2 Software interface ............................................................................................................ 3 Software functions ....................................................................................... 4 5.1 ECG waveform display region ......................................................................................... 4 5.2 P-QRS-T analysis region ................................................................................................... 5 5.3 ECG recording information region .................................................................................. 6 5.4 Folder list region .............................................................................................................. 8 5.5 Waveform browsing region ............................................................................................. 8 5.6 Waveform browsing toolbox region ............................................................................... 9 6 Tips.............................................................................................................. 11 I 1. Introduction ECGViewer is the software to view the ECG waveform and other information recorded by Micro Ambulatory ECG Recorder. It needs to be installed on a PC before running. The software supports automatic analysis for P-QRS-T categorization, R-R interval variation, QRS energy ratio, correlation coefficient of P-QRS-T complex between the template and the current recording, as well as the cardiac health condition early warning (version dependent). 2. Product features and system requirement 2.1 Review ECG recordings The software allows users to open the file of .ECG format files recorded by Micro Ambulatory ECG Recorder and view the ECG waveforms. 2.2 Measure and print ECG data ECG waveform can be measured and analyzed. The measurement and analysis are automatically calculated, and are shown on screen or can be printed to a printer. 2.3 System requirement Operation system Windows XP/windows Vista/windows 7 CPU x86 CPU(e.g. Intel or AMD platform) RAM ≥128MB Display resolution Minimum 1280×720 3. Installation and running 3.1 Installing software Double click file Dimetek ECG Viewer Setup.msi and install the software following the instructions. Icon 【 】is available on the desk when the installation is finished. Please contact distributor of the device immediately if the installation cannot be completed. 2 3.2 Running software Double click ECGViewer icon 【 】 to run the software. 4. Software interface 4.1 Start interface A software License Agreement box pops up every time when ECGViewer is started (shown in Figure 1). Click “Agree” to continue, meaning the user agrees all the conditions listed in the user license agreement. This can be disabled if “Don’t show again” is checked. Figure 1. Software License Agreement 4.2 Software interface The user interface of ECGViewer software is shown as illustrated in Figure 2. The file path and name of the currently shown ECG file are shown on the title bar. 3 Figure 2. Software user interface The software user interface is divided into six regions: the ECG waveform display region, P-QRS-T analysis region, ECG data information region, folder list region, recording list region, waveform browsing region and button region. Detailed illustrations of each region are described in section 5. 5 Software functions 5.1 ECG waveform display region Function of the ECG waveform display region is to display the recorded ECG waveform. Typically four traces of waveform are shown in the region. The pink color grids are for easier amplitude and time estimation. One small grid represents 1mm while one big grid represents 5mm. The scale in the upper right corner indicates the current speed (mm/s) and gain (mm/mV)for the ECG waveform. Relative and absolute recording times are shown above each of the four waveform traces to help user locate the waveform of a given time. The vertical position of the traces can be adjusted using the scroll bar located in the middle of the region so the ECG waveform can be viewed when the waveform amplitude is big or the baseline is shifted significantly. 4 Figure 3. ECG data review region(left) + scroll bar(right) 5.2 P-QRS-T analysis region The waveform displayed in the P-QRS-T analysis region is the stacking and magnifying of all the waveforms of the current P-QRS-T category. Waveforms of the current P-QRS-T category are displayed in blue in the ECG waveform display region. The scale on the upper right corner indicates the speed is 100mm/s and it is fixed; the gain is 4 times of the gain value in the ECG data display region, and it changes as the gain value in the ECG data display region changes. The numerator on the right lower corner indicates number of current P-QRS-T category, and the denominator indicates total number of the P-QRS-T in current page. When there is only one P-QRS-T category in the current page, the numerator is the same as denominator. The user can switch the P-QRS-T category by P-QRS-T selection bar on left of the P-QRS-T analysis region. The ECG waveform of the selected category is shown in blue in the ECG waveform display region. Templates are used for comparisons of the characteristic P-QRS-T complex that the doctor considers as stable or safe to the current recorded P-QRS-T complex of major category. Template Update button is available at lower left corner of the P-QRS-T analysis region, through which the current recording is set and updated as the template. Insertion of the TF card accompanied with the device is needed for this operation and the template will be saved in the TF card. The template P-QRS-T complex (in green color) will be shown as overlaying the current P-QRS-T complex in the analysis region once the template is set. -5- When an ECG waveform recording is opened that has the same parameters (same setting of leads and recording mode) as the template, the template waveform is shown in the analysis region as overlapped so users could make comparison between the new waveform and the template waveform. Please note: the template is related to the recording leads、sample rate and mode; different recording leads、sample rate and modes need different templates. Figure 4. P-QRS-T category selection bar (left) + P-QRS-T analysis region (right) 5.3 ECG recording information region The contents of the various fields in the ECG recording information region are described as follows: 【Name】: The username is shown in the editable box if it has been entered and stored in the Micro Ambulatory ECG Recorder (please refer to the User’s Manual for details). Otherwise it will leave blank. 【Press F1 for help】: Press F1 to view this manual. 【Recording date/ time】: It shows the recording date and time of the current waveform. 【Total time length】: It shows the total recording duration. 【Current displaying time】: It shows the time range of current page. This is useful when the recording is of multiple pages. 【Sample rate】: It shows the sample rate of the current recording. 【HR】: The heart rate is calculated and shown using the current page ECG waveform. -6- Please note: the heart rate calculation is for current page only instead of the whole recording. It may change when the display page is changed. 【Leads】: It indicates the combination of the leads and connection method selected during recording using the Micro Ambulatory ECG Recorder. I、II、III、V1、V3、 V5 is leads information and e/t is connection method. An e stands for electrical lead connection and t stands for skin touch connection. Please refer to the User’s Manual of the recorder for details. 【Mark】: The marking time and fraction numbers will be shown here if mark function in Holter mode was used(Please refer to the User’s Manual for details). The denominator is the total marks, and numerator is the current selected mark. 【Waveform filter bandwidth】: It indicates the filtering bandwidth setting when the recording was made (Please refer to the User’s Manual for details). 【Removal of Power Line Interference】: PLI removal is not necessary in most cases, and it may cause distortion of ECG waveform. However, removal of PLI will help clear up the ECG waveform when the recording is contaminated with PLI. 【Invert】:If the leads are connected reversely while collecting the ECG, the waveform will be shown upside down. Checking this will help restore the waveform. Please keep in mind to remember uncheck when viewing other recordings. 【Measurements】:A number of automatic measurement results of the current page are shown, including R-R interval variation, QRS energy ratio, and correlation coefficients of P-QRS-T complex between the template and current recording. 【No change found】:Automatic analysis conclusion based on current page is shown as one of the following possible statements: no change found, ventricular arrhythmia, supra-ventricular arrhythmia, undetected QRSs, unrecognized waveforms, interferences, and invalid recording. Warning: The analysis conclusion is made automatically and for reference only. It might be inaccurate especially when the waveform is complicated and or contaminated with noises. 【Check later】:The text and its color of this field indicate the level of the early warning of the heart health. The safest level is “Check Later” in green color; the cautious level is “See Doctor” in yellow color; the dangerous level is “Urgent” in red color. There is a situation where the recorded data is unusable for automatic analysis and “Analysis Failed” in black color is shown instead. The early warning indication is for reference only and there might be possible false ones. Please ask doctor to verify the results. 【Comment】:The text comment can also be entered for the current recording. Just -7- click on the comment area and an input box is shown with original comment. Up to 30 letters are allowed for the comment. After finishing entering, click on the OK button to confirm the operation, or click anywhere else to cancel the operation. Figure 5. ECG information recording region ! Attention: all the information output by MicroECG and ECGViewer is for reference of users and doctors only and is not suitable for self-diagnosis. Users should consult doctor for help instead of depending on the shown information. When the green “Check Later” is indicated, more ECG recordings should be made some other time as the heart attack may occur at anytime; when the yellow “See Doctor” is indicated, medical consultation should be made as soon as possible; when the red “Urgent” is indicated, emergency medical help is needed. Moreover, when the black “Analysis Failed” is indicated, recording method should be checked and another recording should be tried again. 5.4 Folder list region All the drive symbols in the computer are listed in this area after the software is started, and the ECGViewer folder is opened by default. Users may find the folder for ECG recordings and click to explore it. Figure 6. Folder list region 5.5 Waveform browsing region All the ECG recordings from the selected folder in the folder list region are shown -8- in this region. The recordings are arranged according to the recording date and time where the format is by using year tag, month tag and date tag: ECG+ year+ month+ day+, and a list of time and ECG recording file name. Click on each tag to expand or collapse. Click on a recording item to view the waveform as shown in the ECG waveform display region. The recording’s file path and name are also shown in the topmost title bar. The recording item will be colored according to its level of early warning, same as in the ECG information display region. The currently opened recording item in focus is always colored in blue for highlighting. The currently opened recording item out of focus will be indicated by a black frame instead of highlighted in blue color. The entered comment will be shown as the mouse cursor stays over the recording item. Figure 7. Waveform browsing region 5.6 Waveform browsing toolbox region The waveform browsing toolbox region is useful for fast browsing of the ECG recordings and is located at bottom of the ECG data display region. It contains a waveform browsing scroll bar and a number of buttons. The waveform browsing scroll bar can be used to indicate the location of the waveform of current page in the whole data. Users can browse the ECG waveform quickly by clicking or dragging the scroll bar with the mouse, or just by rolling the mouse wheel. The waveform is always shown in pages. Figure 8. Waveform browsing scroll bar The file open button is used as an alternative way to view ECG recordings. Clicking this button will pop up a file open dialog window, just like a regular Windows file open dialog. -9- Choose the desired recording file from this dialog window to open it. Please note only one file can be opened at a time. Figure 9. File open button The page left/right buttons are for turning display pages of ECG recordings; one page is turned each time hitting the button. It is used for subtle location of the waveform position Figure 10. Left page/Right page button ECGViewer supports saving the current interface as PNG picture; content saved includes ECG data display region, P-QRS-T analysis region, and ECG recording region. Figure 11. PNG picture saving button Print button is used to print out the current ECG waveform; content saved includes ECG data display region, P-QRS-T analysis region, and ECG recording region. Figure 12. Print button The gain selection box and speed selection box are used to adjust the gain and speed of the displaying ECG waveform respectively. There are three choices for speed: 12.5mm/s, 25mm/s,50mm/s, and four choices for gain: 2.5mm/mV, 5mm/mV, 10mm/mV, and 20mm/mV. Figure 13. Gain and speed selection box The previous and next mark buttons are to locate ECG waveform according to the time mark, made by the subject during ECG recording (shown as in figure 14). Micro ambulatory ECG recorder provides marking function in Holter mode; the marking position will be symbolized as flag during waveform display, and the selected mark will be symbolized as solid flag (shown as in figure 15), and the other as hollow flags(shown as in figure 16). Figure 14. Previous/Next mark button - 10 - Figure 15. Currently chosen mark Figure 16. Other marks The language selection box is for the interface language that can be English or Chinese. The default language is Chinese. Users can choose one and then restart ECGViewer to make the change in effect. Figure 17. Language selection box 6 Tips The vertical position of ECG traces can be adjusted by the vertical scroll bar. The waveform contaminated with PLI may be improved by choosing Remove PLI. Please also pay attention to the PLI frequency that can be either 50Hz (in most Asian and European countries) or 60Hz (in America or Japan). Do not remove the memory card while ECGViewer is running. Please do not install or delete programs while ECGViewer is running. The maximum duration of ECG waveform display for one page is 64 seconds. The print out is the same as the display on screen. Please pay attention to the scale and unit when viewing the ECG waveform. Accurate diagnoses are made possible only by medical authorities. Please consult medical authorities for the clinical meaning of the ECG waveforms instead of trying to make self diagnosis. - 11 -