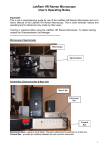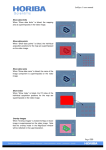
1
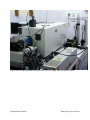
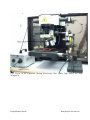
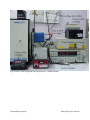
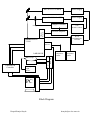
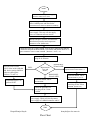
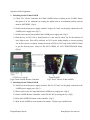
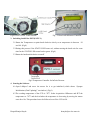
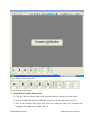
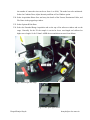
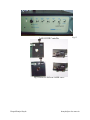
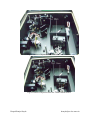
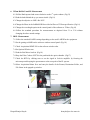
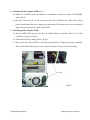
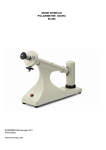
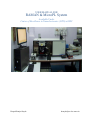
USER MANUAL FOR RAMAN & MicroPL System Available Under Center of Excellence in Nanoelectronics (CEN) at IISC Deepak Ranjan Nayak [email protected] IMPORTANT INSTRUCTIONS 1. This manual is a brief step by step instruction guide. Refer to the system manual to use any other feature of the software or hardware. 2. Before using the equipments, read the manual carefully and follow the instructions. 3. Before making the reservations for the equipments, the user should carefully read the “Booking Rules” and should abide by them. 4. It is mandatory for the users to make an entry in the log book after using the equipment. 5. After measurement is done, shutdown LASERS and switch off the main power supply except the CCD power supply. 6. Extreme care should be taken while handling the filters and focusing on the sample using 10x objective. 7. If you face any problem using the equipment, contact the Equipment Owner immediately. Deepak Ranjan Nayak [email protected] INTRODUCTION Overview: The LabRAM HR (UV) system is a state of the art RAMAN/µPL. This spectroscopic system provides high spectroscopic resolution and a unique wavelength range capability that offers both great flexibility and high performance. LabRAM HR allows the collection of large area Raman images, using the X,Y and Z mapping features, in seconds/minutes. The available equipment in the Characterization Lab of Center of Excellence in Nanoelectronics (CEN) at Indian Institute of Science is capable of performing the following types of measurements. UV, Visible Raman with 325nm and 514nm LASER using CCD detector. Photoluminescence (PL) in o Visible range using CCD (with multi-window) o Near IR (NIR) using the InGaAs detector (800nm to 1600nm) All the above measurements can be done with X, Y and Z mapping. Components associated with the equipment: The instrument consists of four parts: 1. Lasers The system by default has an internal slot for HeNe (633nm) LASER which is unavailable in the discussed setup. It is equipped with two external LASERs, those are 514nm and 325nm LASER. The Argon 514nm Visible (Green) LASER is mounted on the extended chassis behind the LabRAM HR system. The He-Cd UV 325nm LASER is fixed to the table (Fig.1). 514nm LASER enters the LabRAM HR system through the first optical stand where as the 325nm LASER through the second optical stand (Fig. 1). 2. Microscope Sampling is carried out through a standard optical microscope. The present microscope has 5 objectives. MPlan N 10x, MPlan N 50x, MPlan N 100x and MPlanFC N 50x (Long Working Distance) are for visible light. During measurements the focus is done on the sample by using 10x, 50x and 100x respectively but the final spectra is taken using 100x. If the sample is liquid or powder, using 100x for RAMAN or PL may damage the objective and in that case the 50x long working distance objective is used. For measurements using 325nm LASER that is LMU-40x-NUV. (Fig. 2) Deepak Ranjan Nayak [email protected] 3. Spectrometer Dispersing the Raman signal into its constituent parts for detection by detector (CCD or InGaAs). The spectrometer is in the LabRAM HR box. It is connected to the detectors. There are two detectors associated with the system (Fig.3). The CCD detector is for the sensing the signal for RAMAN and PL in near UV and Visible range. The RAMAN measurement can be taken from 50cm-1 to 3000-1 and the IR is from 350nm to 800nm depending on the source. The InGaAs detector is used for PL in IR range (800nm to 1600nm). 4. Optics For coupling the lasers to the sample, and carrying the Raman signal through to the spectrometer. The special optics to be attached to the systems are the filters depending on the LASER source or the type of measurements. As shown in the figure Fig.14 there are 4 filters which have to be changed as per the specification (i.e., the type of LASER written on them). Those filters are to be placed inside the LabRAM HR box as shown in the figure Fig.15 & 16. For IR PL measurement the Filtre Colores OG570 has to be placed in the path of the reflected light signal (Fig.17). Deepak Ranjan Nayak [email protected] Fig1. Picture of the Equipment showing LASERs, Power Supply Units and Optical Stands Deepak Ranjan Nayak [email protected] Fig.2 Picture of the Equipment showing Microscope, Fiber Optics Light Source and Stage arrangement Deepak Ranjan Nayak [email protected] Fig.3 Picture of the Equipment showing Detectors, LASER modules Deepak Ranjan Nayak [email protected] He-Cd 325 UV LASER Power Supply Argon 514 Visible LASER Power Supply Chopper Controller Chopper 316C Remote Control InGaAs Detector Lock-In Amplifier HORIBAJOBIN YVON He Cd LASER Remote Controller CCD Detector CCD Temperature Control Microscope Z Stage LabRAM HR Controller X Y Joy Stick LabRAM HR InGaAs Temperature Control Fiber Optics Light Source PC Block Diagram Deepak Ranjan Nayak [email protected] START Switch on the main power supply for the LASER to be used. Turn On the power switch on the back panel of the LASER power and Wait for the LASER beam to stabilize. (Refer to1.3&2.2) Switch on the LabRAM HR instrument main power supply. This step will also supply power to LabRAM controller and PC. Run the LabSpec5 software and follow the initialization procedure and temperature control for CCD. (Refer to 4) Change the filters for 514nm LASER. Turn ON the LASER from LabRAM Control box and pull the knob behind µ-eye camera and pull the Knob on 1st optics column to select 514nm LASER. ( Refer to 5.10 to 5.13) Perform the spectral calibration using the Si substrate. Place the Filtre Colores OG570 filter inside LabRAM HR. Set the grating 600IR on software control panel. (Refer to 7.2 and 7.6) Follow the steps in 7 to perform IR PL. IR PL Measurement Type and Source RAMAN &PL 325nm LASER RAMAN &PL 514nm LASER Perform the Specified operations described from 6.1. Perform RAMAN and PL measurement as per 6.6. Perform RAMAN and PL measurement. Follow the procedure for switching off the 514nm LASER. Follow the procedure for switching off the 325nm LASER. (Refer to 9) Turn off the LabRAM HR instrument main power supply. Which will also disconnect power supply to LabRAM controller and PC. STOP Deepak Ranjan Nayak [email protected] Flow Chart Operation of the Equipment: 1. Switching On the 514nm LASER 1.1.Check 361C (Power Controller for 514nm LASER) before switching on the LASER. Ensure that power is at its’ minimum by keeping the adjust knob at its minimum position and the mode in SATNDBY. (Fig.4) 1.2.Switch on the main power supply (marked “Argon (514 nm)” on the plug) connected to the LASER power supply unit. (Fig.3) 1.3.Switch on the power button behind the LASER power supply unit. (Fig.5) 1.4.Turn the key on 361C ON (it should point to 1) and wait for about 30s for the emission of laser light to start. This will be reflected on 361C power analog display as current reaching 4A. If more power is required, change the mode to RUN on 361C and use the ADJUST knob to get the desired power. However, DO NOT CROSS AT ANY TIME BEYOND 8Amp. (Fig.4) Fig.4 514nm LASER Remote Controller Fig.5 Power Unit for 514nm LASER 2. Switching On the 325nm LASER 2.1.Switch on the main power supply (marked “He-Cd (325 nm)” on the plug) connected to the LASER power supply unit. (Fig.3) 2.2.Then switch on the AC input behind the LASER power supply unit. (Fig.6) 2.3.On the LASER Remote Controller, switch ON the HV by turning the key. (Fig7) 2.4.Press the LASER ON button on the controller. (Fig.7) 2.5.Wait for the LASER to warm up and wait another ~30min to get a stable beam. Deepak Ranjan Nayak [email protected] Fig.6 Power Unit for 325nm LASER Fig.7 325nm LASER Remote Controller 3. Switching On/Off the PMT (PS/TC-1) 3.1.Rotate the Temperature set point knob clockwise slowly to set temperature in between -30 and -40. (Fig.8) 3.2.During this process if the STATUS LED turns red, without turning the knob wait for some time for the STATUS LED to turn back to green. (Fig.8) 3.3.Rotate the knob anticlockwise to turnoff. Fig.8 Temperature Controller for InGaAs Detector 4. Starting the Software 4.1.Open LabSpec5 and move the mouse for it to get initialized (which shows “Synapse Initialization (Gain Updating)” on window). (Fig.9) 4.2.The working temperature of the CCD is -700C. Select Acquisition Detector and SET the temperature to -700C and check whether the temperature is decreasing by moving the mouse once after 10s. This procedure has to be followed even if the CCD is ON. Deepak Ranjan Nayak [email protected] Fig.9 LabSPEC software interface Fig.10 Software control panel 5. 514nm RAMAN and PL Measurement 5.1.Click the Video tab (camera icon) on the software window to switch to the video mode. 5.2.Turn the LASER OFF from the LabRAM Control Box (not from the source). (Fig.13) 5.3.Turn on the Euromex Fiber Optic light Source by rotating the knob (CW) and adjust the brightness of the light on the sample. (Fig.12) Deepak Ranjan Nayak [email protected] 5.4.Turn the switch of the microscope to VIDEO option located on the top of the microscope. 5.5.Set the MPlan N 10x objective of the microscope. 5.6.Use the joystick to move the stage and to keep the sample under the objective. 5.7.Focus the objective by using the coarse and fine knob on the right hand side of the microscope.(Fig.11) (ACW-objective goes down CW- objective goes up) 5.8.Set the MPlan N 50x objective and focus. 5.9.Set the MPlan N 100x objective and focus. If the sample is powder then use 50x long working distance objective (LMPlanFL N 50x/0.5) in order to prevent damage to the objective. 5.10. Change the filters in the LabRAM HR box with the filters of 514nm specification. (Fig.15) 5.11. Turn the LASER ON from the LabRAM Control Box. (Fig.13) 5.12. Pull the Knob upward slightly and rotate anti-clockwise on the 1st optics column. The spring arrangement on the knob will pull it down. (Fig.21) 5.13. Pull the knob behind the µ-eye camera outward. (Fig.18) 5.14. Turn off the Euromex Fiber Optic light Source by rotating the knob (ACW). (Fig.12) 5.15. The parameters in the control panel of the software need to be changed before measurement. To change the values in the fields, write the number and then press ENTER. Wait for the software to respond and update (which can be seen from the bottom right corner of the software window). (Fig.10) 5.16. Set the slit width by changing the “Hole” input (Recommended hole:100µm or 200µm). 5.17. If the filter is set in the control panel then unselect it (by setting it to ----). 5.18. Set the LASER according to the LASER source that is 514nm. 5.19. For Raman the grating has to be changed to 1800. 5.20. Select OptionsUnit1/cm. 5.21. The first entry in the ACQUISITION tab is for the exposure value in seconds to be used for the spectrum and image RTD acquisition. Set it to 1s. 5.22. Run the Spectrum RTD and use the fine focus on the microscope to get maximum counts. 5.23. The Extended Range Acquisition tab on the top of the software window is for the PIG Run (Spectrum Acquisition). The range can be set in the “From” and “To” entry e.g., 50-3500 cm-1 range. The 3rd column on the first row is the exposure time to the CCD. (Depending on Deepak Ranjan Nayak [email protected] the number of counts the time can be set from 1s to 999s). The mode has to be multimode. Select the Combine Data, Adjust Intensity and Run to First Window option. 5.24. Select AcquisitionAuto Save and entry the details of the Format, Destination Folder, and File Name in the popped-up window. 5.25. Select OptionsUnitnm. 5.26. Select the Extended Range Acquisition tab on the top of the software window and set the range. Generally for the PL the sample is excited at lower wavelength and collected at higher wave length. So for 514nm LASER the accumulation can start from 600nm. Fig.11 Microscope and Stage Fig.12 Fiber optic light source Deepak Ranjan Nayak [email protected] Fig.13 Fig.14 Lenses for Different LASER source Deepak Ranjan Nayak [email protected] Fig.15 Position of objectives used for 514nm LASER Source Fig.16 Position of objectives used for 325nm LASER Source Deepak Ranjan Nayak [email protected] Fig.17 Position of the Lense used for IR PL Exit Mirror Fig.18 Lense and Detector selection Deepak Ranjan Nayak [email protected] 6. 325nm RAMAN and PL Measurement 6.1.Pull the Knob upward and rotate clockwise on the 1st optics column. (Fig.21) 6.2.Push the knob behind the µ-eye camera inside. (Fig.18) 6.3.Change the objective to LMU-40x-NUV. 6.4.Change the filters in the LabRAM HR box with the filters of 325nm specification. (Fig.16) 6.5.Change the wavelength option in the control panel of the software to 325nm. (Fig.10) 6.6. Follow the standard procedure for measurements as depicted from 5.1 to 5.26 without changing the above stated settings. 7. IR PL Measurement 7.1.Follow the standard LASER settings depending on the used LASER for the equipment. 7.2.Set the grating to 600IR on the software window control panel. (Fig.10) 7.3.Check AcquisitionPMT ON on the software window tabs. 7.4.Set OptionsUnit to nm. 7.5.Push the Exit Mirror knob in. (Fig.18) 7.6.Keep the Filtre Colores OG570 in the path inside the optics chamber. (Fig.17) 7.7.Check the RTD by clicking start to see the signal in Lock-in amplifier by focusing the microscope and keeping the spectrometer at the near peak of the PL spectra. 7.8.Select AcquisitionAuto Save and entry the details of the Format, Destination Folder, and File Name in the popped-up window. Fig.19 Chopper Deepak Ranjan Nayak [email protected] 8. Switching Off the 514nm LASER (Fig.3) 8.1.Rotate the ADJUST knob anti-clockwise to minimum and put the control in STANDBY mode. (Fig.4) 8.2.On 361C turn the key to ‘0’ and wait for the fan of the LASER to stop. Then switch off the power button behind the power supply unit and switch off the main power source (marked as Argon 514 nm on the power chord). (Fig 3,4&5) 9. Switching Off the 325nm LASER 9.1.Press LASER OFF button on the He Cd LASER Remote Controller. Wait for the 300s countdown to get over. (Fig.7) 9.2.Switch off the HV by turning the key. (Fig.6) 9.3.Wait for the fan of the LASER to stop. Then switch off the AC Input of the power controller. Then switch off the main power source (marked as Argon 325 nm on the power chord). Fig.20 Deepak Ranjan Nayak [email protected] Fig.21 Optics Columns Fig.22 Direction of LASER Beam for 514nm LASER Deepak Ranjan Nayak [email protected] Fig.23 Direction of LASER Beam for 325nm LASER Fig.24 Detectors Deepak Ranjan Nayak [email protected]