1
Supero: A Sensor System for Unsupervised Residential Power Usage Monitoring
Dennis E. Phillips1
1
Rui Tan1,2∗ Mohammad-Mahdi Moazzami1 Guoliang Xing1 Jinzhu Chen1 David K. Y. Yau2
Department of Computer Science and Engineering, Michigan State University, USA
2
Advanced Digital Sciences Center, Illinois at Singapore
Abstract—Research has shown that providing users finegrained information concerning their power usage in the home
fosters conservation. Several existing systems achieve this goal
by exploiting appliances’ power usage signatures identified in
labor-intensive in situ training processes. Recent work shows
that autonomous power usage monitoring can be achieved
by supplementing a household power meter with distributed
sensors that detect the working states of appliances. However,
sensors must be carefully installed for each appliance, resulting
in high installation cost. This paper presents Supero – an ad
hoc sensor system that can monitor appliance power usage
without supervised training. By exploiting multi-sensor fusion
and unsupervised machine learning algorithms, Supero can
classify the appliance events of interest and autonomously
associate the power usage with respective appliances. Our
extensive evaluation in five homes shows that Supero estimates
the energy consumption with errors less than 7.5%. Moreover,
the users can deploy Supero with considerable flexibility and
in short time.
I. I NTRODUCTION
Since 1978 the percentage of residential electricity has
increased from 17% to 31% [1], while the cost of energy
has also been on the rise. Consumers have become more
interested in reducing their energy usage by appliances. If
the home owner could have a better understanding of the
energy consumption of each appliance, the waste of power
could be identified. Research [2] has shown that providing
users information concerning their fine-grained power usage
in the home fosters conservation.
Previous systems for residential power usage monitoring
can be broadly classified into two basic categories. The first
category, direct sensing, measures power usage through inline power meters. Examples include Kill-A-Watt [3], WattsUp [4], and radio-enabled ACme [5]. As these meters are
connected in between the appliance and power outlet, they
cannot be used on the appliances permanently connected to
the power lines, such as ceiling lights. The second category,
indirect sensing, is less intrusive as it infers the working
states and energy consumption of individual appliances by
detecting their power usage patterns [6], [7] or the ambient
signals they emit during operations [8]. However, the accuracy of these techniques can be influenced by the physical
characteristics of the electrical wiring and appliances. As
a result, many of them need in situ supervised training,
∗
The first two authors are listed in alphabetic order.
in which the information about energy consumption and
groundtruth appliance usage are collected and fed to the
system. Such a training process is often labor-intensive and
sometimes intrusive. A promising solution is to sense the
light, acoustic, and magnetic signals generated by appliances
and then correlate them with the total household power
measurement to infer per appliance energy consumption [9].
However, to achieve autonomous monitoring, this approach
would typically require sensors to be carefully installed for
each appliance, which may result in high installation cost
[10] and reduced usability for non-professional users.
In this work, we ask the question – is it possible for
a residential power usage monitoring system to use only
inexpensive sensing devices, be easy to install, and yet
be capable of working based on a small amount of easily
obtained prior information, without resorting to supervised
in situ training? Such a system must automatically detect
events of interest, autonomously associate the events with
the correct appliances, and finally infer the power usage of
each appliance. Several key challenges must be addressed
for achieving the unsupervised power usage monitoring.
First, homes are a highly dynamic and complex environment. Inexpensive sensors typically have limited sensing
capabilities, and hence likely produce false alarms or miss
important events. Second, when the sensors are installed in
an ad hoc manner, it is highly difficult to associate an event
detected by possibly multiple sensors with the appliance that
generates the event. Finally, to make the system practical,
it is desirable to minimize the amount of prior information
about the appliances that needs to be collected by users. At
the same time, the system must ensure the accurate power
usage monitoring based on the limited prior information
without any supervised post-deployment training.
This paper presents the design and implementation of Supero – a System for Unsupervised PowER mOnitoring using
inexpensive wireless sensors that are ad hoc deployed in the
home. Supero utilizes a power meter to measure the realtime total household power consumption and inexpensive
light and acoustic sensors to detect the events of appliances. Supero adopts a multi-sensor fusion scheme where
the data collected by power, light, and acoustic sensors
are correlated to mitigate the impact of noise and remove
possible sensing errors. By using advanced unsupervised
clustering algorithms, Superio analyzes the signal signatures
of different appliances and identifies the events generated
by the same appliance. Moreover, Supero autonomously
associates the classified events with appliances through
an optimization framework that accounts for environmentdependent factors like light signal propagation. Provided
with a small amount of easily obtained prior information
such as sensor-appliance distances and the rated powers of
a small subset of appliances, these unsupervised algorithms
work together to disaggregate the total household energy
consumption to individual appliances. As Supero does not
require any post-deployment in situ training, it facilitates the
deployment by non-professional users.
We implemented Supero using TelosB/Iris motes and a
wireless power meter, and evaluated Supero in five homes
with significantly different square footage and electric power
consumption. A 10-day extensive evaluation in an apartment
and a ranch house shows that Supero estimates the energy
consumption with errors less than 7.5%. Our results also
demonstrate that Supero can be easily deployed by nonprofessional users in short time.
the thermal camera is cumbersome, hard to install, and can
raise privacy concerns in residential environment.
ViridiScope [9] is a fine-gained power usage monitoring
system that is closest to Supero. It features an autonomous
regression-based calibration framework that can calculate
the energy consumption of each appliance. A fundamental
requirement of the regression approach is that the working
states of each appliance can be accurately sensed. This was
achieved by installing dedicated sensors for each appliance
[9]. For instance, magnetic sensors were carefully attached
to the power cords of the monitored appliances, and light
sensors were positioned in close proximity to the monitored
light and must not be triggered by other lights. Such an
approach incurs high-cost sensor installations, especially for
the difficult-to-access appliances such as ceiling lights/fans.
In contrast, Supero allows ad hoc and non-dedicated sensor
deployment, which can significantly reduce installation cost
and improve usability.
II. R ELATED W ORK
The main goal of Supero is to provide a fine-grained
electrical power usage report for a specified time duration
in a household. The report includes the details of the energy
consumption of a particular appliance as well as when it was
turned on and off. Supero is designed to meet the following
three objectives. First, the sensors should be deployed in an
ad hoc and non-intrusive manner. A non-professional should
be able to deploy the sensors with intuitive instructions such
as “place a light sensor with no obstruction to lights” and
“place an acoustic sensor on top of a microwave.” Second,
we aim to reduce the system configuration efforts by avoiding labor-intensive training and extensive user input. Third,
Supero should be able to achieve long-term monitoring (e.g.,
a few weeks), such that the generated report is instructive
and meaningful for identifying wasteful energy usage.
Four major challenges are brought by the above design
objectives. First, due to the ad hoc deployment, a sensor may
pick up the signals emitted by multiple appliances, making
it difficult to differentiate which appliance is consuming
power. For instance, a light sensor can sense the signals
emitted by various lights and an acoustic sensor in the
kitchen can hear the sounds from exhaust fan, disposer,
microwave and etc. Second, without careful installation,
sensors typically suffer sensing errors caused by interference
from environment and human activities. For instance, light
sensors likely report false alarms when nearby window
blinds are opened during the day time and acoustic sensors
may pick up sounds unrelated to power consumption such as
human conversation. Third, without in situ system training,
more prior information is often required to bootstrap the
unsupervised learning approaches. We strive to reduce the
difficulties for non-professional in obtaining the prior information required by Supero, while maintaining satisfactory
This section discusses representative indirect sensing approaches for appliance power usage monitoring, and identifies the differences from Supero.
Early work [6], [11], [12] utilized per appliance power
operating characteristics measured at the power panel to
disaggregate the total energy consumption using pattern
recognition algorithms. To correctly identify appliances,
these approaches need either post-deployment training [6],
[12] or a comprehensive database of priori power characteristics of appliances [6], [11]. A recent paper [13] presented
the experiences of monitoring power usage of a lab using
38 ACme meters [5] and 6 light sensors. In [14], binary
sensors were employed to help deploying power meters to
estimate energy breakdowns for major devices in a building.
These two studies exploited the tree topology of the power
supply system to reduce the number of sensors [13] and
derive estimation quality [14]. In [7], an electrical event
detection and classification approach was developed based
on the frequency patterns of the transient noises generated by
switching on/off appliances and measured by a single in-line
sensor. However, the transient signature is heavily influenced
by the physical characteristics of the electrical wiring, which
results in the need of post-deployment training. In [8], [15],
appliances were recognized based on their electromagnetic
interference [8] and acoustic signals [15]. However, both
two approaches need labor-intensive in-situ training for the
particular home they are deployed in. A typical training
process involves switching different appliances, collecting
and labeling signals. In a recent work [16], a thermal camera
is employed to detect the on/off states of the appliances in
its field of view, which are utilized to infer the per-appliance
energy consumption. Compared with tiny wireless sensors,
III. OVERVIEW
OF
S UPERO
A. Design Objectives and Challenges
monitoring accuracy. Finally, to extend system lifetime,
wireless sensors must adopt lightweight sensing algorithms
and send the least amount of data, which however imposes
challenges to accurate appliance working state monitoring.
Graphic Config.
Interface
1) Light-sensor
distances
2) Acoustic appliances'
properties
3) Appliances' rated
powers
Base Station
Unsupervised
Event Clustering
Multi-modal Data
Correlation
events features
B. Motivation
To meet the aforementioned objectives, Supero utilizes a
household power meter and a small number of inexpensive
light and acoustic sensors that are deployed in an ad hoc
manner in the home. Based on an unsupervised approach, it
does not require any in situ system training, but leverages a
small amount of prior information that can be easily obtained
by non-professional users. We now discuss several important
observations that motivate our approach.
Real-time total household power metering. Nowadays, the
real-time total household power consumption can be easily
measured by installing a commercial off-the-shelf smart
meter (e.g., TED [17] and AlertMe [18]) on the main circuit
panel. These meters are inexpensive and most of them can
be easily installed without hardwiring with the power lines
[18]. Moreover, as the coverage of smart grid increases, the
real-time total household power readings are increasingly
available to the homeowners, without resorting to a personal
smart meter.
Sensing modalities. According to a survey of U.S. Department of Energy [19], the average distribution of electricity
consumption in household is: heating 24%, lights 24%, air
conditioners (ACs) 20%, refrigerators 15%, dryers 9%, and
electronics 9%. As most heating appliances consume substantially more power than other appliances, their consumption trace often can be identified from the real-time total
household power readings. Most lights, ACs, refrigerators
and dryers emit detectable light and acoustic signals. As a
result, on average, more than 90% power consumption of
a typical household can be captured by a combination of a
smart meter and a set of light and acoustic sensors.
Useful prior information. To avoid expensive in situ system
training, Supero leverages unsupervised learning techniques
and a small amount of prior knowledge including rough
sensor-appliance distances and the rated powers of a small
subset of appliances. As the light/acoustic signal decays
with the distance from the source appliance, the distances
between sensors and appliances provide important hints
for associating the detected events to the right appliances.
Moreover, although the rated power of an appliance often
has small discrepancy with the actual power consumption, it
helps identifying the consumption trace of a small number
of difficult-to-detect appliances from the household power
readings. Rated powers are often available from the labels
on the appliances or the user manuals. Moreover, there exist
a few publicly available databases (e.g., [20]), which provide
rated power based on the appliance brand and model.
Light/Acoustic
Sensors
Fig. 1.
Cluster-Appliance
Association
Power Event
Detection
fine-grained
power usage
power readings
Smart Meter
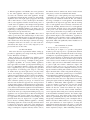
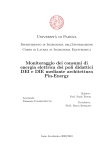
Architecture of Supero.
C. System Architecture
Supero is composed of a number of wireless sensors
distributed in the home, a wireless smart meter, and a base
station receiving the information from the sensors and the
smart meter. Fig. 1 illustrates the architecture of Supero.
In this work, we only consider light and acoustic sensors
while other sensing modalities such as infrared can be easily
incorporated by Supero. Supero has a two-tier architecture as
follows. In the first tier, sensors sample signals and detect the
events that are possibly caused by turning on/off appliances.
Specifically, if a sensor detects a significant change in the
received signal, it extracts various relevant features and
sends an event message to the base station. The details of
the first tier will be presented in Section IV. The base station
provides a graphic configuration interface that allows user
to input prior information such as sensor-appliance distances
and appliances’ rated powers. When Supero is requested to
generate a power usage report for a specified time period,
the base station executes the following algorithms based on
the collected data and the prior information input by user:
Multi-modal data correlation: The base station correlates sensor events and power readings to differentiate the
events generated by turning on and off appliances and
the false alarm events unrelated to power consumption.
(Section IV-D)
Unsupervised event clustering: By leveraging unsupervised clustering algorithms, the events generated by an
appliance can be classified into the same cluster and the
power of the appliance can be estimated by correlating with
the measurements of the smart meter. (Section V)
Autonomous event-appliance association: Supero associates the classified events with respective appliances based
on event features and prior information. Based on the clustering and association results, Supero calculates the energy
consumption of each appliance. (Section VI)
IV. E VENT D ETECTION AND DATA C ORRELATION
In this section, we first describe the event detection
algorithms for sensors, and then present a multi-modal data
correlation algorithm to reduce sensing errors.
A. Light Event Detection
Light sensors detect the state changes of lights from the
changes of light readings. However, besides electrical light
sensor readings
x̄S [n] − x̄L [n]
2400
2200
2000
Light 1 on
1800
Light 2 on Light 1 off
Light 2 off
Movement 2
Movement 1
100
0
-100
1600
0
20
40
60
80
Time (second)
100
120
x̄S [n] − x̄L [n]
Light intensity
2600
140
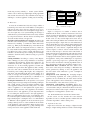
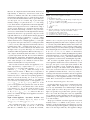
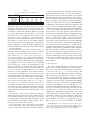
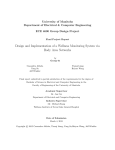
Fig. 2.
Operation of EDF (τ = 4). Green vertical lines represent
detections. A person passes by Light 1 at the 31st and 53rd second.
events, the change of sensor readings can also be caused by
sensor noise and natural ambient light change. We present
a light event detection algorithm that is resilient to these
dynamics. Light sensors may also pick up events unrelated to
power consumption (referred to as non-power events), such
as those caused by human movement and opening/closing
window blinds. The non-power events will be identified by
the multi-modal data correlation discussed in Section IV-D.
Light sensors sample light intensity periodically (4 Hz in
our implementation) and detect light events by an exponential difference filter (EDF), which is a lightweight and yet
effective detection algorithm. By denoting x[n] as the sensor
reading at time step n, the exponential moving average,
denoted by x̄[n], is computed by x̄[n] = α · x[n] + (1 − α) ·
x̄[n − 1], where α ∈ (0, 1). By setting α = αs or α = αl
where αs > αl , we have the short-term and long-term
moving averages denoted by x̄s [n] and x̄l [n]. The changes
of x̄s [n] and x̄l [n] capture the transient light changes and
natural ambient light dynamics, respectively. Given two
positive thresholds ηL and τ , the sensor counts the number
of continuous samples satisfying |x̄s [n] − x̄l [n]| ≥ ηL and
raises a detection once the count exceeds τ . The sign of
(x̄s [n] − x̄l [n]) indicates whether the appliance is turned on
or off. Whenever the sensor raises a detection, it reports a
light event message including current reading and the two
averages. Moreover, it sets x̄l [n] = x̄s [n] to quickly adapt
the long-term average to the most recent light intensities.
The sensor maintains a Gaussian noise model based on
the recent measurements when |x̄s [n] − x̄l [n]| < ηL . The
threshold ηL is continuously updated according to the noise
model to achieve a low false alarm rate, e.g., 5%. The
settings of αs , αl and τ will be discussed in Section VIII.
Fig. 2 shows the operation of the EDF on the readings of a
photodiode when two lights are turned on/off and a person
moves around. It can be seen that the light events can be
accurately detected and the human movements do not trigger
false alarms.
B. Acoustic Event Detection
A challenge in acoustic sensing is that high sampling
rate is often required to extract acoustic features of interest.
Motivated by the observation that many appliances remain
off in most of the time, Supero adopts an adaptive sampling scheme to reduce computation overhead for sensors.
Initially, the sensor samples acoustic signal at 1 kHz for 0.05
seconds (i.e., 50 samples) every 2 seconds. When the signal
energy exceeds a threshold ηA , the sensor switches to a high
sampling rate of 12.5 kHz to capture more details of the
possible event. In the fast sampling mode, the sensor samples
for 0.08 seconds (i.e., 1024 samples) every 2 seconds. A
series of software filters decompose the signal of 1024
samples into low-pass, band-pass and high-pass signals.
Signal energy and zero crossing count of the signals in
the whole band and the three subbands are computed and
transmitted to the base station. Note that zero crossing count
characterizes frequency and can be efficiently computed.
The sensor remains in the fast sampling model when the
acoustic signal energy is above ηA . We set a low threshold
ηA such that the acoustic sensors will not miss the sound
triggered by an appliance of interest. Note that different
from a light event that refers to the switching on/off of
a light, an acoustic event refers to the sound heard by
a sensor. Therefore, the sensor will continuously report
acoustic events while the sound persists. We refer to the
switching or phase change of an acoustic appliance as an
acoustic transition. Owing to intrinsic complexity of the
acoustic modality, acoustic transition detection is achieved
by advanced pattern recognition algorithms on the base
station. This is due to the fact that simple algorithms cannot
well handle the dynamic acoustic signals, while complex
pattern recognition algorithms pose significant computation
overhead on sensors. For instance, the EDF based on signal
energy can easily miss important events especially when the
sounds from non-power events (e.g., shower) and acoustic
appliances (e.g., bath fan) overlap with each other.
C. Power Event Detection
Various commercial off-the-shelf smart meters (e.g., TED
[17]) can deliver real-time power consumption readings.
As the total power consumption is critical for identifying
appliance events and estimating the power of each appliance,
the real-time power readings are transmitted to base station
for storage. The base station detects interesting power events
based on changes in power readings. As the characteristic
of power readings is similar to light readings, we also apply
the EDF to detect the rapid increases and drops in power.
The settings of the EDF will be discussed in Section VIII.
D. Multi-modal Data Correlation
Due to limited sensing capability and complex home
environment, sensors can easily raise false alarms and miss
important on/off events of appliances. For instance, a light
sensor may report events when nearby window blinds are
opened and closed, and an acoustic sensor can be triggered by human conversations. To deal with these sensing
errors, we present a two-tier fusion approach to correlate
the light/power events and acoustic transitions reported by
different sensors. The first tier uses a short moving window
to correlate the events/transitions from multiple sensors of
V. U NSUPERVISED E VENT C LUSTERING
A novel feature of Supero is that it automatically classifies
the events detected by the sensors and associates them with
the right appliances, without any in situ system training.
This section presents the unsupervised event clustering algorithms. We first define the following notation:
• NL and NA are the total numbers of light and acoustic
sensors. ML , MA , and MU are the total numbers of
light, acoustic, and unattended appliances. ∆k denotes
the absolute power change on the k th light/power event
or acoustic transition.
• xi denotes the feature of sensor i in an event. For light
modality, xi is the absolute change of light intensity
measured by sensor i, which can be calculated from the
current reading and the long-term average; For acoustic
modality, xi is the acoustic feature sent from sensor
i, which is composed of the signal energies and zero
crossing counts in the subbands; For unattended power
events, by letting the index of smart meter be 0, x0 =
1 For acoustic modality, event refers to the start or end of a detected sound
signal. Acoustic event will be formally defined in Section V-B.
300
250
ln(Intensity)
Feature of Sensor 2 (x2 )
the same modality.1 The events/transitions falling into the
same window are regarded to be generated by the same
source. This is equivalent to an OR-rule decision fusion
that can largely reduce the overall miss rate. The second
tier correlates the results of the first tier with the readings
from the smart meter to remove false alarms. Specifically,
the base station first calculates the power change of an
event/transition from the first tier. If the power change is
smaller than the minimum wattage among the monitored
appliances, the event/transition will be discarded. In Supero,
the base station timestamps all sensor event messages and
the real-time power readings using its system clock. The
window-based data correlation can fully tolerate small delays of the real-time sampling and event detection algorithms
of sensors. The appliances that cannot be easily or reliably
detected by light and acoustic sensors (e.g., rice cookers)
are referred to as unattended appliances. A power event is
regarded to be caused by an unattended appliance if there is
no simultaneous light event or acoustic transition. We refer
to such power events as unattended events.
A challenge in power event detection is to deal with
the power transients and delay effect of inductive/capacitive
loads. We set a guard region centered at the time instance
of the event and adopt the averages of the power readings
before and after the guard region to calculate the power
change. Note that the length of the guard region dictates the
time granularity at which Supero can differentiate two events
happening close to each other. In our implementation, a
guard region of 6 seconds well handles power transients and
inductive/capacitive delays, and effectively identifies false
alarms.
200
150
100
Light 1
Light 2
Light 3
50 100 150 200 250 300 350
Feature of Sensor 1 (x1 )
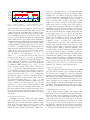
Fig. 3. Light feature vectors of
two sensors.
7.5
7
6.5
6
5.5
5
4.5
4
3.5
50W
100W
150W
4
4.5
5
5.5
6
ln(Distance from light source)
Fig. 4. Light intensity vs. distance
(cm) in log-scale.
∆k . For light and acoustic modality, the feature vector
is defined as X = [x1 , x2 , . . . , xN ]T , where N = NL
or NA .
A. Light Event Clustering
Due to the ad hoc deployment strategy, the signal emitted
by an appliance can be sensed by multiple sensors. Moreover, due to the spatial distribution of sensors/appliances
and environmental dynamics, the group of sensors that can
detect each appliance is different. For a particular appliance,
although the features measured by sensor i are dynamic due
to noise, their variance typically falls within a small range.
Hence, the feature vectors of the events caused by the same
appliance are clustered in the feature space. Fig. 3 shows
the feature vectors of intensity change measured by two
light sensors when three standing lights nearby were turned
on and off. We can clearly see that the feature vectors are
clustered.
The light event features will be clustered into ML clusters.
The Euclidean distance between two feature vectors can
be small when non-zero vector entries are measured by
completely different light sensors, leading to potential false
clustering result. Hence, the Euclidean distance is not a
desirable dissimilarity metric for the light modality. Supero
adopts a new dissimilarity metric that incorporates sensor
location information. Let bk,i ∈ {0, 1} denote the detection
decision made by light sensor i regarding event k, where
bk,i = 1 means that sensor i detects on/off event of
some appliance. The decision vector, denoted by Bk , is
given by Bk = [bk,1 , bk,2 , . . . , bk,NL ]T . The dissimilarity
between two decision vectors Bk and Bj is defined as
PNL
PNL
d(Bk , Bj ) = i=1
bk,i ⊕ bj,i − i=1
bk,i · bj,i , where ⊕
PNL
represents exclusive OR, i=1 bk,i ⊕ bj,i is the number of
sensors
can only detect either event k or j but not both,
PNthat
L
bk,i · bj,i is the number of sensors that can detect
and i=1
both event k and j. Hence, d(Bk , Bj ) quantifies the net
difference between the sets of sensors observing the two
events. By denoting kXk − Xj k as the Euclidean distance
between the feature vectors Xk and Xj in event k and j,
the new dissimilarity metric is defined as
kXk − Xj k,
d(Bk , Bj ) < d0 ,
d(Xk , Xj ) =
(1)
kXk − Xj k + δ, d(Bk , Bj ) ≥ d0 ,
1.2
Major PC (×104 )
det(Sb (k))/det(Sw (k))
1.4
1
0.8
0.6
0.4
0.2
0
1 2 3 4 5 6 7 8 9 10
(a) k
8
6
4
2
0
-2
-4
-6
cluster 1
cluster 2
cluster 3
0
2
4
6
8
(b) Time (minute)
10
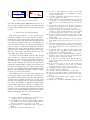
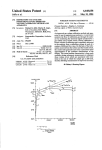
Fig. 5. Acoustic event clustering and transition detection for a 3-speed fan.
(a) The number of phases is identified as 3; (b) Clustering and transition
detection results, where Y -axis is the major principle component (PC),
vertical lines represent the detected acoustic transitions.
where d0 is a threshold and δ is a large constant that
can separate the feature vectors observed by very different
subsets of sensors. The setting of d0 will be discussed in
Section VIII.
Clustering algorithms based on the Euclidean distance
(e.g., k-means) cannot be applied due to the use of the metric
defined in (1). Supero adopts the merging-based clustering
algorithm [21], which is applicable to nonlinear dissimilarity
measures, to group the feature vectors into ML clusters. Due
to space limitation, we omit the details of the clustering
algorithm. Our experience shows that, the clusters with a
small number of feature vectors often affect the accuracy of
clustering results. To improve the robustness of clustering,
we detect outliers as follows. If the size of a cluster is
smaller than a small threshold, its member feature vectors
are regarded to be outliers, which are discarded and then the
clustering algorithm is re-executed. Outliers are produced
by unidentified false alarms and rarely used appliances and
hence removing them has little impact on the accuracy of
overall energy consumption estimation. The setting of the
outlier detection threshold will be discussed in Section VIII.
B. Acoustic Event Clustering and Transition Detection
A challenge of acoustic event clustering is that many
appliances such as multi-speed fan have multiple operation phases. Unfortunately, the number of phases of many
appliances cannot be easily determined by the user. For
instance, refrigerators have different phases depending on
the brand/model and when they were made. Moreover, the
number of actually used phases of an appliance such as
multi-speed fan highly depends on the habit of the user and
hence is unpredictable. In addition, the overlaps between the
sounds from different appliances and noises (e.g., shower,
water flush) can also result in unpredictable number of
acoustic patterns. As a result, it is infeasible to assume
a known and fixed number of clusters in the collected
acoustic features. We propose the following approach based
on advanced pattern recognition algorithms to address the
above challenges.
The dimensionality of acoustic feature vector is 8NA ,
which will incur heavy computation overhead in clustering
even when a few acoustic sensors are deployed. Supero first
applies principal component analysis (PCA) to reduce the
dimensionality. In our experiments, to keep 99% sample
variance, the dimensionality can be reduced from 40 to 8
when 5 acoustic sensors are deployed. Supero then estimates
det(Sb (k))
[21],
the number of clusters as kopt = arg maxk det(S
w (k))
where Sb (k) and Sw (k) are the between-cluster and withincluster variance matrices when the specified cluster number
is k. For each given k, the k-means algorithm is executed
to cluster the features into k clusters and calculate Sb (k)
and Sw (k). With the clusters under kopt , Supero detects the
acoustic transitions by identifying the transitions between
clusters over time. Specifically, by dividing time into small
windows, edges between two consecutive windows having
different largest clusters are detected as acoustic transitions.
The window size is selected to minimize the product of
the number of acoustic transitions and the sum of misclassification rates in all windows. The misclassification rate
in a window is the ratio of the number of events that
do not belong to the largest cluster in the window to the
total number of events in the window. The rationale of
jointly considering the number of acoustic transitions in the
minimization objective is as follows. The misclassification
rate typically decreases with the window size. Therefore,
only minimizing the sum of misclassification rates will
mostly result in an unreasonable small window size. Fig. 5
shows a case study using an acoustic sensor to identify the
number of phases of a 3-speed fan and detect the phase
changes. We can see that the number of phases can be
correctly identified as 3. Moreover, the phase changes can
be accurately detected.
C. Unattended Power Event Clustering
For the unattended power events (i.e., detected power
changes without simultaneous light/acoustic events), Supero
adopts the Euclidean distance between the power changes as
the dissimilarity metric and applies the k-means algorithm
to cluster the events into MU clusters. To simplify the
discussion, in this paper, we assume that the unattended
appliances are not multi-phase. However, by extending the
approach developed for acoustic modality, Supero can be
extended to address multi-phase unattended appliances.
VI. AUTONOMOUS A PPLIANCE A SSOCIATION
The event clustering does not answer which appliance
triggers the events in a cluster. To accurately estimate the
energy consumption of different appliances, the events must
be correctly associated with the appliance that generates
them. In this section, we address this issue by exploiting
the correlation of event features, sensing models, estimated
sensor-appliance distances and other prior information.
A. Light Cluster-Appliance Association
The decay of light intensity follows the power law, which
can be exploited to associate light appliances and clusters.
However, in complex household environment, the decay of
light intensity is affected by several factors such as the
reflection of furniture and walls. We conducted extensive
measurements using light sensors to verify the decay model
in various household environments. Due to space limitation,
we only report one set of results. Fig. 4 plots the light
intensity readings of a photodiode in a 5 × 3.2 m2 living
room, where the line-of-sight distance between the light bulb
and the sensor ranges from 60 cm to 3 m. Both axes of Fig. 4
are in log-scale. We have two observations from the figure.
First, the linear relationship conforms to the power law.
Second, at a certain distance from the light bulb, the intensity
measured by the sensor is proportional to the power of the
light bulb. Therefore, we assume that the intensity measured
−α
by sensor i, denoted by yi , is given by yi = β·Pj ·dij
, where
Pj is the power of light appliance j, dij is the line-of-sight
distance between sensor i and light appliance j, α is the path
loss exponent of the power law, and β is a scaling factor. The
α and β can vary with deployment environment, but have
bounded ranges. The α typically ranges from 2.0 to 5.0.
The β is the ratio of sensor’s intensity at unit distance from
the light source to its power. The range of β can be easily
obtained in offline lab experiments. Based on the ranges of α
and β, Supero automatically learns the values of α and β in
a specific deployment such that the association minimizes
the discrepancy between the measurements and the decay
model. This is desirable because otherwise determining their
exact values through in situ calibration would be laborintensive and infeasible for non-professionals.
The association between clusters and appliances is formally represented by a square matrix A = [am,j ]M×M .
If cluster m is associated with appliance j, am,j = 1;
Otherwise, am,j = 0. Let µm denote the average of the
feature vectors in cluster m. Hence, the ith component of
µm , denoted by µm,i , is the average change of light intensity
measured by sensor i when the corresponding appliance is
turned on and off. By denoting Rm as the set of sensors
that makes positive decisions in cluster m, we define the
error caused
cluster m with appliance j as
P by associating
−α
em,j =
i∈Rm β · Pm · di,j − µm,i , where Pm is the
power of the appliance that generates the events in cluster
m. We estimate Pm as the median value of the absolute
power changes (i.e., ∆k ) of the events in cluster m. For
certain α, β and P
association A, the total error is defined
as E(α, β, A) =
∀m,∀j am,j · em,j . Based on this error
metric, we formulate the light cluster-appliance association
problem as follows:
Light Cluster-Appliance Association Problem. Find
α, βPand A to minimizePE(α, β, A), subject to that
∀m, ∀j am,j = 1 and ∀j, ∀m am,j = 1.
The constraint means that A is a one-to-one mapping.
To solve the above problem, we first fix α and β and
then find A to minimize E(α, β, A) under the constraint,
Algorithm 1 Acoustic Transition-Appliance Association Algorithm
Input: acoustic transition set T , non-primarily monitored appliance set A
Output: acoustic transition-appliance association
1: C = ∅
2: for transition k in T do
3: find sensor i with the largest absolute change of signal energy in k
4: if sensor i is a primary sensor then
5:
associate k with the corresponding primarily monitored appliance
6: else
7:
C = C ∪ {k}
8: end if
9: end for
10: cluster the transitions in C using k-means algorithm based on their
absolute power changes, with |A| as the number of clusters
11: sort clusters according to their centers
12: sort appliances in A in terms of power
13: associate the sorted clusters with the appliances in A in order
which is a linear assignment problem [22]. We employ the
Hungarian algorithm [22] with a time complexity of O(ML4 )
to solve this sub-problem. Henceforth, the final solution can
be found by enumerating α and β in their possible ranges.
The association process can be further sped up by identifying
the dedicated light sensors. Cluster m is an dedicated cluster
if Rm ∩ Rn = ∅, ∀n 6= m, i.e., cluster m is monitored by
dedicated sensors. Before running the Hungarian algorithm,
each dedicated cluster m is associated with the appliance that
is closest to the sensors in Rm . The unassociated clusters
and appliances are then fed into the Hungarian algorithm.
The association algorithm requires the knowledge of
sensor-appliance distances that can be estimated by a sonic
laser tape, arm span or even rough visual estimation. The
association algorithm is robust regarding the distance estimation. As long as the relative order of the distances is
correct, the association results are not affected. Moreover,
the optimization framework finds α and β by jointly accounting for the detected event features and sensor-appliance
distances. As a result, the ranges of α and β limit the impact
of inaccuracy of sensor-appliance distances on association
results. These observations are confirmed in Section IX.
B. Acoustic Transition-Appliance Association
For electrical lights, most power is consumed in the form
of light. Hence, the scaling factor β in the power law
does not vary substantially across different lights. Although
acoustic signal also follows the power law, in contrast to
light, it is typically a by-product in the operation of appliances. As a result, the scaling factor can vary significantly
across different acoustic appliances and the association algorithm developed for light modality is not well applicable
to acoustic modality.
We propose a heuristic association approach for acoustic
modality. Sensor i is defined as the primary sensor of
appliance j if the absolute change of signal energy of sensor
i is always the largest when appliance j changes its state and
must not be the largest when any other appliance changes
C. Unattended Appliance Association
As the unattended appliances are not sensed by any sensor,
more accurate prior information about them will be required.
Similar to light modality, the power of the appliance that
generates the unattended power events in cluster m, denoted
by Pm , can be estimated as the median value of the absolute
power changes of the events in cluster m. Supero associates
the clusters with appliances by matching Pm ’s with the
rated powers. The association can be formulated as a linear
assignment problem, where the error of associating cluster
m with appliance j is defined as em,j = |Pm −Pj∗ | and Pj∗ is
the rated power of j. As the association is accomplished by
an optimization algorithm, it is resilient to small deviations
between the true working power and rated power. We
propose to create a virtual background appliance to represent
all the appliances that consume little but variable powers,
such as laptop computers. In the association algorithm, the
association error of the background appliance is always
zero, i.e., em,j = 0 for any cluster m. In other words,
the background appliance can be associated with any cluster
such that it will not affect the association of other unattended
appliances.
Our pilot deployments show that, for various acoustic
appliances that have complex signal patterns, the sensors
may miss important events. For instance, the sound of a
water boiler becomes detectable in a couple of seconds
after turned on. The delayed acoustic event may be falsely
removed by the data correlation due to little power change.
To address this issue, we treat such an acoustic appliance as
an unattended appliance as well and then merge the acoustic
transitions and power events. In practice, the user may not
know which acoustic appliances might be missed by sensors.
A conservative strategy is to jointly monitor most acoustic
appliances and input their rated powers. Supero is expected
to become more robust to misses if more rated powers are
provided.
StdDev(kW) Power (kW)
state. The appliance j is defined as a primarily monitored
appliance. The complement set of primarily monitored
appliances comprises non-primarily monitored appliances.
Different from dedicated sensor that can only sense one
appliance, a primary sensor can sense multiple appliances.
The primary sensors can be identified according to user’s
intuition based on the sensor and appliance locations. When
a sensor cannot be accurately classified as a primary sensor,
it can be conservatively excluded from the set of primary
sensors. The pseudo code of the acoustic event-appliance
association is in Algorithm 1. In Line 12 of the algorithm,
the non-primarily monitored appliances are sorted according
to power. Hence, the required extra prior information is
the order of non-primarily monitored appliances in terms
of power.
2
1.5
1
0.5
0
1
0.8
0.6
0.4
0.2
0
change heat level
power
envelope
threshold
0
1000
2000
3000
Time (s)
4000
5000
6000
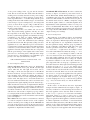
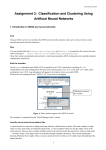
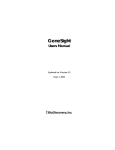
Fig. 6. Detecting stove burner. (1) Red curve: Total household power
readings when a burner is working; Blue curve: The reconstructed lower
envelope. (2) Standard deviation of power readings and threshold-based
detection results (detection window size: 100 s).
D. Energy Calculation
Supero adopts a simple approach to calculate the energy
consumed by each appliance based on the detected events
and estimated powers. For a single-phase appliance, the
energy consumption is simply the product of power and
the on time. For a multi-phase appliance, its power can be
updated according to the associated power changes. Integrating the power over time yields the energy consumption.
The evaluation will show that this approach leads to satisfactory results. Based on the association results, regression
approaches, e.g., [9], can also be integrated with Supero
to improve the robustness in the case of false alarms and
misses.
VII. D UTY-C YCLED H EATING A PPLIANCES
As discussed in Section III-B, heating appliances such
as stove burner and oven are major electricity consumer
in homes. Most modern heating appliances duty-cycle to
achieve the desired heat level. For instance, the top part
of Fig. 6 shows the total household power readings when
a GE JB710ST2SS burner is working. As the cycle can
be short (e.g., several seconds), the EDF-based detector
discussed in Section IV-C will have poor performance. In
this section, we propose a new approach to detect the dutycycling pattern from the total power readings and calculate
the related energy consumption.
Duty-cycled appliance rapidly switches between on and
off, causing large variation in power readings. Hence, we
detect the duty-cycling pattern based on the standard deviation of the windowed power readings. By denoting P and
γ ∈ (0, 1) as the power and duty cycle of the appliance,
the standard
deviation of the power readings √
can be derived
p
as P γ − γ 2 . We choose a threshold of P 0.05 − 0.052
by conservatively assuming that the duty cycle is greater
than 5%. When P is unknown, we can choose a default
value of 1.5 kW for P because most duty-cycled heating
appliances have a rated power around 1.5 kW [20]. As a
result, the default threshold is 0.327 kW. To suppress the
false alarms caused by other high-power non-duty-cycled
appliances, we further require that the zero crossing count
of the mean-removed power readings in a window is at least
2. The bottom part of Fig. 6 shows the standard deviation
of the power readings in the top part and the detection
result. We can see that the time duration that the burner is
working can be accurately detected. For the power readings
in a window that has a positive detection, we apply the kmeans algorithm with k = 2 and then interpolate the power
readings in the cluster with smaller average to reconstruct the
lower envelope of power consumption (i.e., the background
power), as shown in the top part of Fig. 6. With the lower
envelope, it is easy to calculate the energy consumption of
the duty-cycled appliance.
In typical U.S. homes, stove burner and oven are the
major duty-cycled heating appliances and they are often
the components of the range. Supero does not differentiate
the duty-cycled heating appliances and attributes all energy
consumption to the range. To address multiple simultaneously working duty-cycled appliances, the number of
clusters, i.e., k, can be first determined by the technique
presented in Section V-B. The rapid duty-cycling can cause
significant errors to the EDF-based power event detection
(cf. Section IV-C) and the second tier of the multi-modal data
correlation (cf. Section IV-D). Hence, when a duty-cycled
appliance is detected, Supero disables these two components
and the power changes of the light/acoustic events in this
period are set to be missing values. Although such a design
can cause errors to other appliances, it is worthwhile to give
priority to the duty-cycled electricity vampires.
VIII. I MPLEMENTATION , C ONFIGURATION ,
D EPLOYMENT
AND
A. System Implementation
Sensors and smart meter. The sensors are implemented
using TelosB and Iris motes [23]. TelosB only has light
sensors while Iris has both light and acoustic sensors.
According to our lab tests, the light sensors on TelosB and
Iris have satisfactory isotropic sensitivity in a considerably
large incoming angle, which can mitigate the impact of
sensor orientation on the association algorithm presented in
Section VI-A. The light sensors on TelosB and Iris have
also been calibrated such that they can be used in the same
deployment. The signal sampling and event detection algorithms described in Section IV are implemented in TinyOS
2.1. To reduce computation overhead, these algorithms are
carefully implemented using integer arithmetic. All sensors
use 802.15.4 channel 11. The sensors communicate directly
with the base station. Such a single-hop topology suffices
for our deployments in three apartments and two multi-story
houses. TED5000 [17] is used to measure the total household
power consumption.
Base station. The base station is a TelosB mote connected
to a netbook computer. A daemon service on the computer
retrieves real-time power readings from the TED5000 and
stores the event messages received by the base station mote
in a database. The data correlation, clustering and association
algorithms are implemented in GNU Octave.
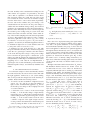
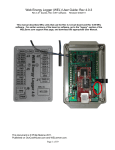
Groundtruth Kill-A-Watt meters. In order to evaluate the
accuracy of Supero, we build 14 power meters based on
the P3 Kill-A-Watt (KAW) Model P4400 [3] to provide
groundtruth power usage data of individual appliances. We
connect two ADC channels of a Senshoc mote to two pins on
the internal circuit board of a KAW to sample the voltage
and current signals. Senshoc is a TelosB-compatible mote
implementation with significantly reduced cost. Fig. 8(a)
shows a modified KAW. The Senshoc mote computes and
transmits the real-time power usage data to the base station
for storage. Each modified KAW is carefully calibrated to
output accurate power readings.
B. System Configuration
The parameters of algorithms in Supero are determined
by offline experiments. Note that this process does not
need to be repeated for different deployment environments.
All the deployments in our experimental evaluation use
the same parameter settings. The first group of parameters
are the coefficients of the EDF for light and power event
detection presented in Section IV. By setting αs = 0.18,
αl = 0.074 and τ = 4, light sensors are resilient to sensor
noise and normal human movement; By setting αs = 0.31,
αl = 0.08 and τ = 4, power changes as small as 50 W can
always be detected. As the above settings depend on sensor
noise and reading calibration, they are sensor-specific but
environment-independent. The above settings are obtained
by extensive evaluation on raw sensor data collected in a
pilot deployment. The second group of parameters are d0
and outlier cluster size in the light event clustering presented
in Section V-A. We set d0 = 2, i.e., two feature vectors
should be classified into two distinct clusters if the number
of sensors that can only detect the first event is 2 more than
that of the second event. Moreover, we set the outlier cluster
size to be 2, i.e., we ignore the appliances that only generate
less than 2 events in a long period such as several days.
As other parameters can be either easily set (e.g., ηA for
acoustic sampling and δ in (1)) or autonomously optimized
(e.g., α and β in Section VI-A), we omit the details here.
C. System Deployment
In this section, we first discuss the sensor deployment
strategies and then summarize the user inputs to Supero. A
necessary condition for correct clustering and association is
that every appliance can be detected, which is referred to
as the coverage requirement. A conservative and intuitive
deployment strategy is to place a sensor close to each
appliance. The user manual can provide a table of detection
ranges for typical household appliances, which are measured
in offline experiments. For instance, a 60 W incandescent
bulb can be reliably detected by a TelosB mote within 5 m. In
addition, we also discuss an incremental deployment strategy
that can possibly reduce the number of sensors. Initially, a
sensor is deployed for each appliance that emits dim signal.
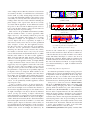
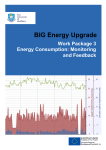
the user input the required rated powers. Currently, TPCDB
comprises the information of more than 500 appliances.
Fig. 7(b) shows our interface of querying TPCDB through
its web service API, where the user can find the rated power
by appliance type, manufacturer and model.
IX. E XPERIMENTAL E VALUATION
A. Deployments and Methodology
(a) Acoustic configuration
(b) Rated power database
Fig. 7. Web configuration interface
The user then switches each other appliance to check if it
can be detected by any already deployed sensor by looking
at sensor’s LED, which blinks to indicate a detection. If not,
an additional sensor is deployed for the uncovered appliance.
This process repeats until the coverage requirement is met.
Finally, a few extra sensors may be deployed at random
locations in the regions (e.g., living room, dining area)
without any sensors.
We now summarize the user inputs to Supero. First,
Supero needs a list of monitored appliances, which are
categorized as lights, acoustic appliances, and unattended
appliances. Supero also needs to know whether an appliance
has multiple working states while the exact number of
working states is optional. Second, for light modality, Supero
requires roughly estimated line-of-sight distances between
sensors and lights, which can be measured by a sonic laser
tape, arm span or even visual estimation. As discussed
in Section VI-A, Supero is robust regarding the distance
estimation. Third, for acoustic modality, Supero needs to
know whether an acoustic appliance has a primary sensor.
All non-primarily monitored acoustic appliances need to be
sorted according to their powers (cf. Section VI-B). Such a
ranking is usually straightforward based on common sense.
This can also be done based on their rated powers. Finally,
Supero requires the rated powers of unattended appliances.
We note that the number of unattended appliances is small
in a typical household. Rated powers can be obtained by
reading the labels on the appliances or from a database
of rated powers. The information described above can be
easily obtained by non-professionals and input to the system
after deployment. Supero only needs to be reconfigured
occasionally, e.g., when sensors/appliances are relocated.
We have developed a web configuration interface using
JavaServer Pages served by the base station computer to
help the user input all the required information. For instance,
Fig. 7(a) shows the configuration for the acoustic sensing,
where the user can input the acoustic sensor IDs, appliance
names, and other information described in last paragraph.
In addition, we leverage TPCDB [20], which is an online
collaboratively edited database of appliance powers, to help
We deployed and evaluated Supero in five typical household environments. We first deployed Supero in a 40 m2
single-bedroom apartment (Apartment-1) and an 150 m2
three-bedroom ranch house (House-1) to evaluate the performance of Supero. As most appliances in Apartment-1 can
be monitored by groundtruth KAW meters, the Apartment-1
deployment allows us to extensively evaluate the accuracy of
Supero. In House-1, most appliances are hardwired to power
lines and hence we cannot collect complete groundtruth
information using KAWs. The major purpose of the House-1
deployment is to evaluate the portability of Supero to larger
home environment. We further deployed Supero in other
three homes to evaluate the impact of sensor placement on
the sensing results and how easily Supero can be deployed
by non-professional volunteers.
We compare Supero with two baseline approaches. These
two baselines are based on a state-of-the-art residential
power monitoring system called ViridiScope [9]. ViridiScope estimates the power of each appliancePi (denoted by
pi ) by the regression arg min{pi |∀i} kP (t) − ∀i pi si (t)kℓ1 ,
where si (t) is the state (0 or 1) of appliance i and P (t) is the
total household power at time t. In our evaluation, the first
baseline approach (referred to as Oracle) uses groundtruth
information to generate the state of each appliance and
then applies the regression in ViridiScope. The results of
Oracle allow us to evaluate the accuracy of Supero with
respect to the state-of-the-art approaches. In the second
baseline approach (referred to as Baseline), the state of each
appliance is detected by the sensor closest to the appliance
and then the regression in ViridiScope is applied. In the
implementation of ViridiScope, each appliance’s state was
obtained by dedicated sensors that were carefully installed
on the appliances [9]. The results of Baseline will help us
understand the challenges brought by the ad hoc sensor
deployment.
B. Controlled Experiment in Apartment-1
1) Experimental Settings: All electrical appliances in
Apartment-1 include 5 standing lights, fridge, water boiler,
3-speed tower fan, rice cooker, bath fan, hair dryer, 3 laptop
computers and a WiFi router. The apartment uses natural
gas range and steam-based central heating unit that do not
draw electrical power. The deployment consists of 4 TelosB
and 5 Iris motes. The Iris motes only detect acoustic events.
The laptops and router cannot be easily detected by sensors.
However, as the router’s rated power is known and it is
node 4
node 3
node 2
node 1
4 4
1 1 2 2 3 3
4 4
5 5 1 1 2 2 3 3
4
5 5 1 2 3
4
5 1 2 3
4
5 1 2 3
FA 4
5 1 23 5
4
open/close faucet (kitchen)
light 4 off
open/close faucet (bath)
toilet flush
hair dryer
on & off (x4)
light 4 on
bath fan
on & off (x4)
rice cooker
on & off (x4)
light 1 on
light 1 off
light 2 on
light 2 off
light 3 on
light 3 off
fridge on light 4 on
light 4 off
light 5 on
light 5 off
light 1 on
light 1 off
light 2 on
light 2 off
light 3 on
light 3 off
light 4 on
light 4 off
light 5 on
light 5 off
light 1 on
light 2 on
light 3 on
light 4 on
light 5 on
light 1 off
light 2 off
light 3 off
light 4 off
light 5 off
light 1 on
light 2 on
light 3 on
light 4 on
light 5 on
light 1 off
light 2 off
light 3 off
light 4 off
light 5 off
tower fan on
tower fan off
tower fan on
tower fan off
tower fan on
fridge off tower fan off
tower fan on
water boiler tower fan off
on & off (x4)
Power
Major PC Detection Total power (kW)
change (kW)
1.6
1.4
1.2
1
0.8
0.6
0.4
0.2
0
4
FA
8000
6000
4000
2000
0
-2000
fridge
tower
fan
1.5
1
0.5
0
-0.5
-1
-1.5
water
boiler
bath
fan
hair
dryer
fridge
water boiler
rice cooker
0
10
20
30
40
Time (minute)
50
60
70
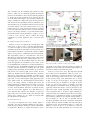
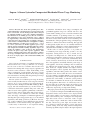
Fig. 9. Results of the controlled experiment in Apartment-1. (1) The top chart shows the power readings labeled with groundtruth of events. (2) The bars
in the second chart show the detections of light sensors. Two black bars at around the 35th minute are the false alarms (labeled “FA” in the chart) identified
by multi-modal data correlation. Clusters are differentiated by colors and the overhead numbers are the IDs of the associated light. (3) The third chart
shows the major principle component given by PCA and the acoustic transitions detected by the window-based algorithm. The acoustic transitions with the
same color are associated with the same appliance. (4) The bottom chart shows the clustered and associated power events of the unattended appliances.
8m
Light 1
kitchen counter
refrig. Node 12
Tower fan
Node 1
Water boiler
Light 3
Rice cooker
bedroom
Node 14
Node 2
Legend:
Light 2
TelosB
Iris
Appliances
(a)
5m
Node 13
living room
bathroom
Bath
fan
Node 4
Light 5
Hair
dryer Light 4
Node 11
Node 15
Node 3
(b)
Fig. 8. (a) The power meter used to measure ground-truth power usage
of appliances. It consists of a Sensehoc mote and a KAW. (b) Apartment-1
deployment.
always on, Supero can estimate its energy consumption.
Hence, Supero can estimate the energy consumption of the
laptops as the difference between the total energy consumption and the sum of estimated energies consumed by all
other appliances. A KAW is connected to each appliance to
provide groundtruth power usage, except for the bath fan that
is hardwired on the ceiling. The rice cooker (500 W), water
boiler (1500 W) and fridge (about 150 W) are treated as
unattended appliances. The water boiler and fridge are also
monitored by acoustic sensors. However, there are numerous
miss detections due to sound delay and low sound level,
as discussed in Section VI-C. Fig. 8(b) shows the floor
plan of the apartment and the sensor positions. The sensors
are placed on the floor, nearby table, chairs and toilet. The
positions of sensors are not carefully chosen except for tower
fan, fridge and water boiler. As the tower fan and fridge
are quiet, they cannot be detected even when the sensor is
just several centimeters away. The water boiler is also quiet
for a few seconds after it is turned on. Therefore, sensors
are deployed close to these appliances. As the bathroom has
complex sound patterns, we deployed two acoustic sensors in
bathroom. Note that they are not dedicated sensors because
each of them can hear all appliances and water facilities in
the bathroom. In this section, we present the results of a
controlled experiment, in which we intentionally turned on
and off the appliances. The controlled experiment allows us
to understand the micro-scale performance of Supero.
2) Energy Estimation Accuracy: Fig. 9 shows the
groundtruth information, power readings, event detection
and clustering results for the controlled experiment. During
this experiment all two light false alarms are identified by
the multi-modal event correlation. There is no light miss
detection. Moreover, all light events are correctly clustered
and associated with lights. For acoustic modality, the nonpower sounds such as toilet flush and tap water can be
identified by the multi-modal data correlation. From the third
chart in Fig. 9, Supero fails to detect the off event of fridge
and total four events of water boiler. In the experiment, the
fridge turned itself off about 3 seconds after the tower fan
finished its transition from the first speed to the second
speed. As the window size of the window-based acoustic
event detection algorithm is larger than 3 seconds, the off
PRR
1
0.8
0.6
0.4
0.2
0
8/30
Power (kW)
2.5
2
1.5
1
0.5
0
-0.5
-1
-1.5
8/30
router failures
reset router
seg 1
seg 2
seg 3
8/31
9/1
9/2
9/3
9/4
9/5
9/6
9/7
9/8
9/9
Date (from 1AM Aug 30 2011 to 11AM Sep 8 2011)
(a) PRR of a KAW
8/31
9/1
9/2
9/3
9/4
9/5
9/6
9/7
9/8
Date (from 1AM Aug 30 2011 to 11AM Sep 8 2011)
9/9
(b) Power trace
Power (kW)
event of fridge is missed. The miss detections of water boiler
are caused by the delay of sound. However, as discussed in
Section VI-D, by jointly treating fridge and water boiler
as acoustic and unattended appliances, these misses can be
successfully recovered by the events detected from power
readings. Other detected acoustic transitions including the
phase changes of the 3-speed tower fan can be correctly
associated with the appliances. As the differences between
the powers of the tower fan in different speeds can be as
low as 6 W, the phase changes of the tower fan cannot be
detected only based on power readings.
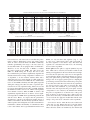
Table I shows the groundtruth measurements by KAWs
and the estimation results of various approaches. Both
Supero and Oracle can accurately estimate the power and
energy of each appliance. The relative error of energy
consumption, averaged over all appliances, is 3.6% and
3.1% for Supero and Oracle, respectively. As Light 1, 2
and 3 have no nearby sensor, Baseline uses the groundtruth
states of Light 1, 2 and 3. For other appliances, Baseline
uses the closest sensor to detect the state of an appliance.
As Baseline does not perform data correlation and event
clustering, the detections contain excessive false alarms.
For instance, as the hair dryer is very noisy, all acoustic
sensors will raise detections when the hair dryer is on, which
introduce false alarms for all other acoustic appliances.
Water boiler and bath fan suffer from the same issue as
well. As a result, Baseline yields wrong power and energy
estimates for several appliances. In fact, it is highly difficult
to deploy dedicated acoustic sensors as they can be easily
triggered by any noisy appliance in the home. Our results
show that acoustic data from multiple sensors must be
jointly processed to produce correct detections. We note that
the performance of regression can be potentially improved
if magnetic sensors are employed. When attached to the
power cord of the appliance, a magnetic sensor may detect
the working state of appliance more reliably than acoustic
sensors. However, this significantly increases the installation
cost. Especially, it is very difficult to install the magnetic
sensors for the permanently installed appliances without
exposed power cords.
3) Impact of Distance Errors: As the association algorithm presented in Section VI-A requires the distances between sensors and lights, we now evaluate the robustness of
the association algorithm with respect to the distance errors.
As Light 4 and Light 5 can only be detected by dedicated
sensors (cf. Fig. 8(b) and Fig. 9), Supero autonomously
prunes their clusters to speed up the association algorithm as
discussed in Section VI-A. Hence, we only focus on Light 1,
2 and 3, which are monitored by Node 1 and 2. The distances
between the lights and nodes are within 1 to 3 meters. The
distances given to Supero are distorted as follows. First, we
proportionally increase all the distances. As the association
algorithm can find a best fit scaling factor β, the association
remains correct even if we multiply the distances by 10.
1.5
1
0.5
0
-0.5
-1
4AM
raw power reading
filtered reading (window size 7)
caused by appliances
10AM
4PM
10PM
Time (starts at 09/01/2011 4AM)
4AM
(c) 12 hours of power trace on September 1, 2011
Fig. 10.
PRR and power traces in 10 days.
Second, we add a random bias to a particular distance in
each test. The result shows that if the bias is within 70%
of the true distance, the association remains correct. These
results demonstrate that Supero is robust to the errors in
the light-sensor distances. Finally, when we exclude Node 2
from the evaluation, the results remain the same as long as
the order of the distances from Node 1 to Light 1 and Light
3 is consistent with reality, i.e., Light 1 is farther from Node
1 than Light 3.
C. 10-Day Experiment in Apartment-1
To evaluate the performance of Supero in long period, we
conducted an uncontrolled experiment that lasts for 10 days
in Apartment-1 with the deployment shown in Fig. 8(b).
During the 10 days, two residents led normal life in the
apartment. In this section, we first discuss our experiences
and learned lessons, and then present the evaluation results.
1) Experiences and Learned Lessons: Router failures.
The probe of TED5000 installed on the power panel sends
real-time readings through power lines to the TED5000
gateway, which was attached on a power outlet and wired to
the WiFi router (TP-Link WR740N) to deliver readings to
the base station computer. However, the router failed twice
during the 10 days, leading to disruptions to the collection
of power readings. We had to reset the router manually to
restart the data collection. We suspect that the failures were
caused by bugs in the router. As power readings are crucial
information to Supero, various improvements can be made
in the future work. For instance, when the base station fails
to receive power readings for a while, it can raise alarm
sound to remind the user to reset the router.
Communication performance. The quality of wireless links
Table I
E NERGY BREAKDOWN IN THE 1- HOUR CONTROLLED EXPERIMENT IN A PARTMENT-1.
Appliance
KAW measurements
Supero
Oracle
Rated power
Power
Energy
Power
Energy
Error∗
Power
Energy
Error∗
Power
(W)
(kW·h)
(W)
(kW·h)
(%)
(W)
(kW·h)
(%)
(W)
(W)
Light 1
150
152
0.0307
154
0.0309
0.7
152
0.0305
0.7
153
148
0.0298
150
0.0300
0.7
150
0.0300
0.7
151
Light 2
150
Light 3
150
151
0.0300
153
0.0304
1.3
153
0.0306
2.0
152
Light 4
50
60
0.0211
61
0.0210
0.5
60
0.0210
0.5
62
Light 5
100
102
0.0207
103
0.0205
0.5
100
0.0200
3.4
102
Water boiler
1500
1472-1524
0.0490
1479
0.0456
6.9
1481
0.0481
1.8
232
23-40
0.0031
N/A
0.0029
5.3
{23, 28, 35}
0.0028
9.7
30
Tower fan
N/A
Rice cooker
500
498
0.0163
508
0.0168
3.1
507
0.0168
3.1
508
442
0.0158
462
0.0150
5.1
459
0.0150
5.1
5
Hair dryer
N/A
Fridge
N/A†
117-146
0.0784
129
0.0841
7.3
122
0.0795
1.4
119
Bath fan
N/A
N/A
N/A
60
0.0020
N/A
61
0.0020
N/A
55
Router
12
12.5
0.0147
12
0.0142
3.4
13
0.0154
4.8
13
3 Laptops
N/A
37-63
0.0468
36
0.0430
8.1
31
0.4840
3.4
53
Average error
3.6
3.1
∗
Error is the relative error of energy, in percentage, with respect to the KAW measurements.
†
Fridge’s rated power is not available. However, its power events can be correctly associated when a rated power of 80 W to 400 W is given to
Name
Table II
E NERGY BREAKDOWN DURING 7 DAYS IN A PARTMENT-1∗
Error∗
(%)
1.0
2.3
2.3
3.8
0.5
41.0
45.1
0.0
88.6
8.2
N/A
4.8
0.9
16.5
Supero.
Table III
E NERGY BREAKDOWN IN H OUSE -1∗
Appliance
Groundtruth
Appliance
KAW
Supero
Oracle
Baseline
Name
P
E
Name
E
P
E
Error
P
E
Error
P
E
Error
Entry
light
32
.0079
Light 1
4.14
154
4.17
0.5
152
4.11
0.9
152
4.11
0.9
Hall light
38
.0112
Light 2
4.96
150
4.96
0.1
149
4.92
0.8
149
4.92
0.8
Kitchen light
24
.0059
6.15
155
6.24
1.4
155
6.25
1.7
155
6.25
1.7
Light 3
76
.0149
Dining light
Light 4
1.45
62
1.45
0.1
62
1.45
0.1
63
1.48
1.7
43
.0041
Living
light
0.39
105
0.39
0.2
105
0.39
0.7
110
0.41
5.5
Light 5
Master bed light
33
.0065
Water boiler
0.48
1493
0.48
0.5
1491
0.48
1.6
0
0
100
22
.0054
Master bath light
Tower fan
0.15
30
0.21
50
26
0.17
17.9
24
0.24
66.2
Master bath fan
47
.0069
1.00
499
0.98
2.2
513
1.01
1.2
511
1.01
0.8
Rice cooker
Guest bed light
29
.0071
Hair dryer
0.09
467
0.07
19.2
467
0.09
0.4
3
0.02
73.2
Guest bath light
20
.0070
12.22
143
11.8
3.7
127
11.8
3.2
127
11.8
3.2
Fridge
Guest bath fan
41
.0097
Bath fan
N/A
50
0.12
N/A
57
0.17
N/A
0
0
N/A
Stove burner
1356
.4603
2.12
12
2.03
4.3
18
3.04
43.3
18
3.04
43.3
Router
N/A
N/A
Water dispenser
Average error
7.5
6.5
27.0
Average error
∗
Power (P ) and energy (E) are in W and kW·h; Error is the relative error of energy, in percentage, with respect to the KAW measurements.
between the base station and sensors can affect the performance of Supero. Each Supero sensor only sends a packet
when an event is detected while each KAW continuously
transmits groundtruth power usage to the base station by
the attached Senshoc mote equipped with a CC2420 radio.
Therefore, we use the data traces of KAWs to examine
the packet reception ratio (PRR). Fig. 10(a) shows the
PRR of a KAW during the 10 days. We can see that
the communication performance significantly degraded and
fluctuated between the evening of September 1 and the noon
of September 3. As the residents watched online videos
during this period, we suspect that the poor link quality was
caused by the interference from WiFi. We also examined the
traces of other KAWs. Similarly, their link quality degraded
during this outrage period. We were able to repeat this phenomenon in an extra experiment using Senshoc motes and
two laptops that transferred a large file over WiFi. Although
the channel of Senshoc was set to 11, which is well separated
from channel 6 used by WiFi, the PRR of Senshoc still
significantly degraded. However, we did not observe significant degradation of PRR when experimenting with TelosB
and Iris motes. Hence, we suspect that the performance
degradation is caused by the imperfect antenna design of
Senshoc. Nevertheless, after the 10-day experiment, we have
enabled packet acknowledgment and added retransmission
mechanism to enhance the reliability of communication. Due
to the router failures and lost groundtruth information from
Baseline
Energy
(kW·h)
0.0310
0.0305
0.0307
0.0219
0.0206
0.0289
0.0045
0.0163
0.0018
0.0848
0.0048
0.0154
0.0472
P
33
38
23
77
41
31
21
47
29
20
40
1379
140
Supero
E
.0081
.0109
.0056
.0113
.0040
.0061
.0052
.0068
.0056
.0070
.0097
.4675
.0518
Error
2.3
1.9
5.8
24.6
3.1
6.0
3.6
2.3
21.2
0.6
0.0
1.6
N/A
6.1
KAWs, we only use three data segments (“seg 1”, “seg
2” and “seg 3” shown in Fig. 10(a)). The total length of
the three segments is more than 7 days. The three data
segments are concatenated and then fed to the clustering
and association algorithms.
Power spikes. Power spike is a typical dynamics in power
lines, which can be caused by bad weather conditions and
turning on/off appliances in the tested home and even neighbor homes. Power spikes may cause errors in the appliance
power estimation. In the controlled experiment, we can see a
few power spikes in the top chart of Fig. 9 when an appliance
changes state. As we apply a guard region for computing the
power change as discussed in Section IV-D, the power spikes
do not affect the results. However, in the 10-day experiment,
we observe excessive power spikes as shown in Fig. 10(b)
that can affect the calculation of power changes for the
detected events. We suspect that the power spikes observed
on September 1 were caused by the thunderstorms during
the period of experiment. A zoomed-in view of the power
trace on that day is shown in Fig. 10(c). Almost all power
spikes can be removed by a median filter with a window size
of 7 seconds. We also apply the median filter with the same
setting to the power traces collected in other experiments.
2) Evaluation Results: Table II shows the results based
on the data of 7 days. During this period, 713 false alarms
out of total 859 light events were raised by light sensors,
where 703 false alarms are identified by the multi-modal
data correlation. All the remaining false alarms are identified as outliers by the clustering algorithm presented in
Section V-A. In addition to the acoustic transitions generated
by fridge, 60 acoustic transitions were detected. We can
see from Table II that Supero can accurately estimate the
energy consumption of lights. The tower fan was turned on
and off twice in the experiment and all its transitions were
detected. However, two bath fan transitions were incorrectly
associated with the tower fan, because Node 13 (i.e., the
primary sensor for tower fan) heard loud noises in living
room at the same times. The two false associations introduce
errors to the energy estimates of tower fan and hair dryer.
From Table II, the overall performance of Supero is close
to that of Oracle. Baseline fails to estimate the energy
consumption of several appliances due to excessive false
alarms.
D. Controlled Experiment in House-1
House-1 is an one-story three-bedroom ranch house with
living space of about 150 m2 . Compared with Apartment1, it has more lights in various types (incandescent bulbs,
standard/compact fluorescent lamps) and an electrical stove
burner. Hence, the House-1 deployment evaluates whether
Supero can be ported to a different household environment.
The deployment consists of 7 TelosB and 3 Iris motes.
The Iris motes detect both light and acoustic events. From
the clustering result, there is no dedicated light sensor, i.e.,
each light sensor can detect multiple lights. As almost all
monitored appliances are hardwired to power lines, we do
not install KAW. We conducted a controlled experiment for
more than 5 hours. Groundtruth information was manually
recorded and then rectified by checking the total power
readings. In the experiment, 40 false alarms out of total 127
light events were raised by light sensors, where 38 false
alarms are identified by the multi-modal data correlation.
The left two false alarms are identified as outliers by the
clustering algorithm. Table III shows the results. In a dining
light event, a sensor monitoring the dining light missed the
event, which results in a misclassification and introduces
error to the energy estimate of dining light. From the
background cluster of unattended power events, we observe
an unknown appliance with a power of 140 W was turned
on every about 10 minutes and lasted one minute. It turns
out to be a hot water dispenser on a sink. Moreover, it
is the dispenser that caused a miss detection of guest bed
light as they were once turned on/off at the same time. The
average error of Supero is 6.1%, which is consistent with
the experiments in Apartment-1.
E. Sensor Placement
As sensors are deployed in an ad hoc manner, Supero is
designed to be robust to the high variability in sensor placement. We deployed Supero in three more homes (Apartment2, Apartment-3, House-2) to evaluate the impact of sensor
Fig. 11. Sensor placements in Apartment-2. The numbers in the squares
and circles are the sensor IDs of TelosB and Iris. If a TelosB does not face
upward, the arrow represents its facing direction.
Node 2
2nd placement
Node 5
4th placement
Node 11
Node 20
Fig. 12. Sensor installation examples. Sensors were placed on the ground,
in the corner of walls, on the fan of a range, and on a table.
placement on the sensing results and provide case studies on
whether non-professionals can successfully deploy Supero in
their homes and how much time they need.
1) Impact of Sensor Placement: We deployed 6 TelosB
and 11 Iris motes in Apartment-2, which is a 80 m2 twobedroom apartment, to evaluate the impact of sensor placement on the sensing results. Sensors were only deployed
in the doorway, living room and kitchen area, as shown
in Fig. 11. As the “doorway light 1” and “doorway light
2” are in series, they are regarded as one light. As shown
in Fig. 12, sensors were placed or attached on ground,
walls, appliances and furniture using mounting tape. We
separately evaluate the impact of sensor placement on the
light and acoustic sensing algorithms. We conducted five
sensor placement trials to monitor 6 lights including incandescent bulbs and standard/compact fluorescent lamps.
Different colors of TelosB motes in Fig. 11 represent different placements, which are also labeled with the initials of
the color names, i.e., ’R’, ’G’, ’B’, ’Y’ and ’BK’. The red
and green placements follow the conservative deployment
strategy discussed in Section VIII-C. The blue and yellow
placements follow the incremental strategy to reduce the
number of sensors from 6 to 4. As there is no sensor in
the living room, the black placement does not follow any
Table IV
Rm
AND CLUSTERING / ASSOCIATION RESULTS
``` Placement
```
Appl.
``
Dining light
Kitchen light
Doorway light
Living light 1
Living light 2
Clustering/association
Red
Green
{6}
{6}
{3}
{3}
{5}
{5}
{1,2,4}
{1,2,4}
{1,2,4,6} {1,2,4,6}
X
X
Blue
Yellow
Black
{6}
{3}
{1}
{5}
{5,6}
X
{6}
{3}
{1}
{5,3}
{5,6}
X
{6}
{3}
{1}
{3}
{6}
X
deployment strategy. All placements ensure the coverage
requirement. The distances between sensors and lights were
determined by visual estimation. We conducted a controlled
experiment to evaluate each placement. Table IV shows the
set of sensors that can detect the same light (i.e., Rm defined
in Section VI-A). The clustering and association results
of the red to yellow placements are correct. In the black
placement of 3 sensors, although all events can be detected,
they cannot be correctly clustered. For instance, although
sensor 6 can detect the near dining light (13 W) and the
farther “living light 2” (150 W), the changes of light intensity
from the two lights measured by sensor 6 are similar, leading
to incorrect clustering.
We then deployed 11 Iris motes as shown in Fig. 11
and then select four different subsets of them to evaluate
the impact of sensor placement. The subsets are S1 =
{All 11 Iris motes}, S2 = {10, 12, 14, 15, 16, 18, 20}, S3 =
{10, 12, 14, 19}, and S4 = {10, 14}. The acoustic appliances
covered in the experiment include exhaust fan over the range,
waste disposer in the sink, dish washer and vacuum. During
the experiment, we used the vacuum both in the dinning
area and living area. S1 and S2 use redundant sensors and
hence are conservative. S3 basically follows the incremental
deployment strategy. As there is no sensor in the living area,
S4 does not follow any deployment strategy. All subsets
ensure the coverage requirement. As the exhaust fan has
two phases (low- and high-speed), sensor 10 that is closest
to the fan is designated as the primary sensor of the fan. For
other appliances, the order (rather than the actual values)
of their power consumption is provided to Supero. The
event detection and association results for S1 , S2 and S3
are correct. For S4 , although all acoustic events can be
successfully detected, some of them cannot be correctly
associated. For instance, when the vacuum ran in the living
area, sensor 10 received the highest signal energy, which is
inconsistent with its designation as the primary sensor of the
exhaust fan.
From the above results, we can see that by following the
deployment strategies discussed in Section VIII-C, the user
has considerable flexibility in choosing the sensor positions.
Compared with the existing approaches that require careful
sensor installation, this feature is highly desirable to facilitate the large-scale deployment in practice.
2) Deployment Time: We now present two case studies
on how easily Supero can be deployed and configured by
non-professionals. We recruited two homeowner volunteers
to deploy Supero in their homes including a single-bedroom
apartment (Apartment-3) and a two-story house with basement (House-2). We first introduced Supero and explained
the deployment strategies to the volunteers, which took less
than one hour. They then installed the sensors and configured
the system using the web interface without any instructions
from us. For safety reasons, they did not install TED5000.2
In Apartment-3, the volunteer deployed 5 TelosB and 3 Iris
motes to monitor all appliances including 5 lights, a fridge,
a microwave and a fan. The deployment and configuration
only took about half an hour. In House-2, the volunteer took
about one hour to survey the appliances and another hour to
install the sensors. He finally deployed 12 TelosB and 10 Iris
motes to monitor 12 lights, an exhaust fan in kitchen, a waste
disposer, a dish washer, a fridge, a microwave, and three
fans in three bathrooms. The base station on the first floor
can reliably receive the packets from the sensors distributed
on two floors and basement. After the system deployments,
we conducted controlled experiments to evaluate the deployments and configurations. We generate fake total power
readings according to the groundtruth to run the algorithms.
The event detection, clustering and association results of
the controlled experiment in both deployments are correct.
These two case studies show that the non-professional users
are able to quickly deploy Supero and ensure correct sensing
results. We also find that the non-professional users tend
to adopt the conservative deployment strategy discussed in
Section VIII-C.
F. System Lifetime
This section evaluates the lifetime of the battery-powered
Supero sensors. In this experiment, we force the CPUs of
the motes to stay active even though they would operate
in low duty cycles (e.g., ≤ 5% for Iris) in Supero. The
radios are turned on only when there are packets to transmit.
The TelosB motes report their battery voltages to the base
station every minute. Fig. 13(a) plots the battery voltages
of two TelosB motes with Alkaline and Lithium batteries,
respectively, over time. The projected lifetime with Alkaline
batteries is 79 days by conservatively setting the minimum
operating voltage (MOV) to be 2.2 V although it is 2.1 V
in datasheet [23]. With the high-capacity Lithium batteries,
there is no observable voltage drop in one month. For the
tested Iris mote, we enforce it to always work in the fast
sampling mode. It piggybacks voltage reading to the acoustic
feature packet. Fig. 13(b) plots the battery voltage of the Iris
with Alkaline batteries. The tested Iris kept working from
the 4th to the 9th day. Regression analysis shows that the
projected lifetime is 40 days by conservatively setting the
MOV of Iris to be 2.2 V, since the MOVs of the RF230
2 The TED5000 probe needs to be hardwired to the electrical service wires
to get powered and connected to the gateway. We are building a batterypowered Zigbee smart meter based on TelosB and Fluke i2000 Flex current
clamps to replace TED5000, which does not need the hardwiring.
Voltage (V)
Voltage (V)
3.3
3.2
3.1
3
2.9
2.8
2.7
TelosB w/ Lithium
TelosB w/ Alkaline
0
5
10 15 20
(a) Days
Fig. 13.
25
30
3.3
3.2
3.1
3
2.9
2.8
2.7
Iris w/ Alkaline
0
2
4
6 8 10 12 14
(b) Days
Battery voltage traces of TelosB and Iris.
radio chip and ATmega1281 8MHz MCU on Iris are 2.1 V
and 1.8 V. We note that the lifetime can be further extended
by simply using Lithium batteries and duty-cycling the CPU
of motes.
X. C ONCLUSION
AND
F UTURE W ORK
This paper presents Supero – a sensor system for unsupervised residential power usage monitoring. In Supero,
the multi-sensor fusion can effectively reduce sensing errors
in complex household environments. By using unsupervised
event clustering algorithms and a novel event-appliance association framework, Supero can autonomously estimate the
power and energy of each monitored appliance. Extensive
evaluation in five homes shows that Supero estimates perappliance energy consumption with an average error of less
than 7.5%. Case studies demonstrate that the users can
successfully deploy Supero in short time.
As discussed in Section III-B, electronics like TV and
stereo consume 9% electricity in typical U.S. homes. It is
challenging to monitor the activities of many electronics as
they emit either no or complex light/acoustic signals and
often consume variable power. From the fact that a home
typically has a limited number of high-power electronics and
most of them are plugged into power outlets, a direct sensing
approach, e.g., by applying radio-enabled KAW developed in
this work, can be integrated with Supero to achieve complete
coverage of power usage monitoring.
Our evaluation does not cover all possible appliances due
to the specific settings of the tested homes. For instance, in
the apartments evaluated in this paper, the laundry machines
are shared among multiple homes and do not draw power
from the tested apartments. We also acknowledge that there
may exist a small number of appliances that have highly
complex signal characteristics and power consumption profiles, e.g., a modern furnace with variable speed motor. In
our future work, we will study these appliances and explore
the use of other sensing modalities such as infrared, seismic,
magnetic and imaging sensors to detect their activities.
R EFERENCES
[1] U.S. Energy Infrmation Administration, “Residential energy
consumption survey,” 2011, http://www.eia.gov.
[2] A. H. McMakin, E. L. Malone, and R. E. Lundgren, “Motivating residents to conserve energy without financial incentives,”
Environmental and Behavior Journal, vol. 34, 2002.
[3] P3 International Corp., “P4400 Kill A Watt TM Operation
Manual.”
[4] “Watts-Up,” https://www.wattsupmeters.com.
[5] X. Jiang, S. Dawson-Haggerty, P. Dutta, and D. Culler,
“Design and implementation of a high-fidelity ac metering
network,” in IPSN, 2009.
[6] G. W. Hart, “Nonintrusive appliance load monitoring,” Proceedings of IEEE, vol. 80, 1992.
[7] S. Patel, T. Robertson, J. Kientz, M. Reynolds, and G. Abowd,
“At the flick of a switch: Detecting and classifying unique
electrical events on the residential power line,” in UbiComp,
2007.
[8] S. Gupta, M. S. Reynolds, and S. N. Patel, “Electrisense:
single-point sensing using emi for electrical event detection
and classification in the home,” in UbiComp, 2010.
[9] Y. Kim, T. Schmid, Z. Charbiwala, and M. Srivastava,
“Viridiscope: design and implementation of a fine grained
power monitoring system for homes,” in UbiComp, 2009.
[10] Y. Kim, T. Schmid, M. Srivastava, and Y. Wang, “Challenges in resource monitoring for residential spaces,” in ACM
BuildSys, 2009.
[11] S. Drenker and A. Kader, “Nonintrusive monitoring of electric
loads,” IEEE Computer Applications in Power, vol. 12, no. 4,
1999.
[12] L. Farinaccio and R. Zmeureanu, “Using a pattern recognition
approach to disaggregate the total electricity consumption in a
house into the major end-uses,” Energy and Buildings, vol. 30,
no. 3, 1999.
[13] X. Jiang, M. Van Ly, J. Taneja, P. Dutta, and D. Culler,
“Experiences with a high-fidelity wireless building energy
auditing network,” in ACM SenSys, 2009.
[14] D. Jung and A. Savvides, “Estimating building consumption
breakdowns using on/off state sensing and incremental submeter deployment,” in ACM SenSys, 2010.
[15] Z. C. Taysi, M. A. Guvensan, and T. Melodia, “Tinyears:
spying on house appliances with audio sensor nodes,” in ACM
BuildSys, 2010.
[16] B. Ho, H. Kao, N. Chen, C. You, H. Chu, and M. Chen,
“Heatprobe: a thermal-based power meter for accounting
disaggregated electricity usage,” in UbiComp, 2011.
[17] “The Energy Detective,” http://www.theenergydetective.com.
[18] “AlertMe,” http://www.alertme.com.
[19] U.S. Dept. of Energy, “Annual energy outlook,” 2006.
[20] “The power consumption database,” http://www.tpcdb.com.
[21] R. Duda, P. Hart, and D. Stork, Pattern Classification. Wiley,
2001.
[22] R. Burkard, M. Dell’Amico, and S. Martello, Assignment
problems. SIAM, 2009.
[23] Memsic Corp., “TelosB, Iris, MTS/MDA datasheets,” 2011.