1
The Alberta Oil Sands Community Exposure and Health Effects Assessment Program: Methods Report November 2000 Methods Report This report is one of a series of published documents: Pilot Study, 1997 Summary Report, 2000 Methods Report, 2000 Technical Report, 2000 For more information or copies of any of these documents contact: Health Surveillance Alberta Health and Wellness P.O. Box 1360 10025 – Jasper Avenue Edmonton, Alberta T5J 2P4 Phone: (780) 427-4518 Fax: (780) 427-1470 Internet: www.health.gov.ab.ca ISBN (0-7785-0697-5) Methods Report Acknowledgements This report is the result of the efforts of a number of individuals who collaborated to develop a holistic approach to the study of personal exposure and the potential health impact of airborne contaminants. Dr. Stephan Gabos, Health Surveillance, Alberta Health and Wellness led the study team. The required data analysis and the development of the report was carried out by selected members of the Science Team: Dr. Robert Audette, Dr. Siu Chan, Jasna Dmitrovic, Bond X. Feng, Dr. Marvin Fritzler, Dr. Francis Green, Dr. Patrick Hessel, Dr. Chris Le; Health Surveillance staff: Alexander MacKenzie, Jonathan Robb, Dr. Donald Schopflocher, Susan Shaw, and Fu-Lin Wang. Science Advisory Committee Dr. Petros Koutrakis Dr. Rein Ottson (deceased) Dr. Pierre Band Dr. Tee Guidotti Dr. Antero Aitio Harvard School of Public Health Health Canada Health Canada The George Washington University World Health Organization Science Team Dr. Stephan Gabos Alexander MacKenzie Dr. Donald Schopflocher Susan Shaw Bond X. Feng Dr. Shaole Wu Dr. Siu Chan Jasna Dmitrovic Dr. Robert Audette Dr. Charles Beck Dr. Ken Froese Dr. Patrick Hessel Dr. Steve Hrudey Dr. Chris Le Dr. Marvin Fritzler Dr. Francis Green Dr. Ian Mitchell Dr. Sheldon Roth Alberta Health and Wellness Alberta Health and Wellness Alberta Health and Wellness Alberta Health and Wellness Alberta Research Council Alberta Research Council Centre for Toxicology Centre for Toxicology University of Alberta Hospital University of Alberta University of Alberta University of Alberta University of Alberta University of Alberta University of Calgary University of Calgary University of Calgary University of Calgary Methods Report Methods Report Table of Contents 1.0 Study Design and Overview ............................................................ 1 1.1 1.2 1.3 1.4 1.5 1.6 1.7 1.8 Study Design ....................................................................................................... 1 Components of the Main Study........................................................................... 3 Recruitment of Volunteers .................................................................................. 5 Field Staff ........................................................................................................... 5 Study Office ........................................................................................................ 6 Field Staff Training ............................................................................................ 6 Field Operations ................................................................................................. 6 Introductory Interview ........................................................................................ 6 1.8.1 1.8.2 1.8.3 1.8.4 1.8.5 1.8.6 1.9 Site Visits .......................................................................................................... 10 1.9.1 1.9.2 1.9.3 1.9.4 1.9.5 1.10 1.11 2.0 Neurocognitive Tests..........................................................................................7 Supplementary Psychological Tests....................................................................9 Respiratory Health Questionnaire ......................................................................9 Demographic and Exposure Questionnaire ......................................................10 Health and Nutrition Survey.............................................................................10 Personal Healthcare Numbers (PHNs) .............................................................10 Personal Exposure Measurement Instruments ..................................................11 Time Activity Diary ..........................................................................................11 Lung Function..................................................................................................12 Drinking Water Sampling.................................................................................12 Biological Sampling .........................................................................................12 Data Entry......................................................................................................... 12 Data Analysis .................................................................................................... 13 Exposure Assessment Methods and Protocols...............................13 2.1 Passive Air Samplers......................................................................................... 13 2.1.1 2.1.2 2.2 Particulate Air Samplers................................................................................... 26 2.2.1 2.3 Passive Field Sampling Protocols ....................................................................21 Quality Assurance and Control ........................................................................26 Particulate Sampling Protocol .........................................................................31 Electron Microscopy .......................................................................32 2.3.1 2.3.2 2.3.3 2.3.4 2.3.5 2.4 Modifications and Additions to Sampler Protocol ............................................ 34 2.4.1 2.4.2 2.5 Materials and Methods.....................................................................................32 Sample Preparation .........................................................................................32 Scanning Electron Microscopy .........................................................................32 Particle Characterization.................................................................................32 Data management and statistical analysis ........................................................33 Passive Sampler Protocol Changes ..................................................................34 Particulate Protocol Changes ..........................................................................34 Water Sampling ................................................................................................ 35 2.5.1 2.5.2 2.5.3 2.5.4 Sample Collection ............................................................................................35 Routine Chemical Analysis...............................................................................35 Trace Metal Analysis........................................................................................36 Internal/External Quality Assurance Protocols.................................................36 Methods Report 2.6 Biological Markers of Exposure.....................................................37 2.6.1 2.6.2 3.0 Nicotine and BTEX Compounds .......................................................................37 Arsenic.............................................................................................................37 Health Assessment Methods and Protocols ...................................41 3.1 Biological Markers of Effect............................................................................. 41 3.1.1 3.1.2 3.1.3 3.1.4 3.1.5 Autoantibodies .................................................................................................41 Lung Function..................................................................................................41 Immunoglobulin gamma E ...............................................................................42 Neurocognitive Function (NES2)......................................................................42 Analysis of Health Records...............................................................................44 Appendix A: Forms and Questionnaires Appendix B: A Collocation Study to Evaluate Samplers Used for Collecting Airborne Particulate Matter List of Figures Figure 1: Components of the Study ..........................................................................................................3 Figure 2: Set-up for Replicate Passive Sampler Study ............................................................................14 Figure 3: Precision of NO2 Passive Sampler...........................................................................................15 Figure 4: Precision of SO2 Passive Sampler ...........................................................................................16 Figure 5: Precision of VOC Passive Sampler (Benzene) .........................................................................17 Figure 6: Precision of O3 Passive Sampler..............................................................................................18 Figure 7: Passive Sampler Data Compared to Ambient Station Data for NO2 .........................................20 Figure 8: Passive Sampler Data Compared to Ambient Station Data for Ozone ......................................20 Figure 9: Passive Sampler Data Compared to Ambient Station Data for SO2 ..........................................21 Figure 10: Comparisons between MINIVOL and PEMTM (with a flow rate of 10 L/min) for PM10 Measurements.................................................................................................................................27 Figure 11: Comparisons between PEMTM and Dichotomous Samplers (with a flow rate of 10 L/min) for PM10 Measurements........................................................................................................................28 Figure 12: Precision of PM Mass Concentration Measurement as a Function of PM Mass Concentrations .......................................................................................................................................................29 Figure 13 Chromatogram Showing the Separation of Four Arsenic Species............................................39 Figure 14: Typical Chromatograms Showing the Speciation of Arsenic in Three Urine Samples ............40 Figure 15: Results of 3-Year Follow-up of Population Cohort ................................................................44 List of Tables Table 1: Components of the Main Study ..................................................................................................4 Table 2: NES2 Tests, Functional Domain and Specific Function, .............................................................8 Table 3: Results of Replicate Study on NO2 Samplers ............................................................................15 Table 4: Results of Replicate Study on SO2 Samplers.............................................................................16 Table 5: Results of Replicate Study on VOC Samplers (Benzene) ..........................................................17 Table 6: Results of Replicate Study on O3 Samplers...............................................................................18 Table 7: Summary of Passive Sampler Detection Limits ........................................................................19 Methods Report Table 8: Detection Limits of Elemental Concentrations in PM ...............................................................30 Table 9: Non-Fibrous Particle Classification Scheme .............................................................................33 Table 10: Criteria for Spirometric Tests .................................................................................................42 Table 11: Percentile Distribution of Visiting a Physician and Hospital for Respiratory Disorders by Diagnostic Category, April 1995 – March 1998 ..............................................................................46 Table 12: Case Definitions for Asthma...................................................................................................47 Table 13: Case Definitions for COPD ....................................................................................................48 Table 14: Case Definitions for Respiratory Disorders.............................................................................48 Methods Report Methods Report 1.0 Study Design and Overview 1.1 Study Design The Alberta Oil Sands Community Exposure and Health Effects Assessment Program was modeled after the USEPA TEAM approach.1 The TEAM approach is based on four fundamental characteristics: direct measurement of all routes of exposure (breathing, ingestion, and skin contact), direct measurement of biomarkers, daily logs of a participant’s activities, and a representative probability sample. The study was designed to assess exposure and associated health effects by direct measurement of personal exposure, direct measurement of biomarkers, and daily logs of a participant's activities. The study did not use a representative probability sample, for two major reasons: 1) the high level of commitment required from participants; and 2) the high cost of administering a complex sampling design. The science team determined that the high level of commitment required from potential participants would result in a biased sample, regardless of the recruitment method. Furthermore, the high cost of administering a complex sampling design was not considered to be offset by an improvement in the selection bias. Consequently, participants were recruited on a volunteer basis. The Methods Report provides a more detailed description of the various components in the study, including the methods, protocols, and validation studies. Please refer to this document for further detail. The contaminants identified for personal exposure measurement for the Alberta Oil Sands Community Exposure and Health Effects Assessment Program were sulphur dioxide, nitrogen dioxide, ozone, volatile organic compounds, and particulates. The final list of contaminants were identified using three criteria: • the local priority contaminants of concern; • national initiatives; and • the availability of technology to measure the contaminants. The local community identified a number of priority contaminants, and these were highlighted during the public hearings conducted by the Alberta Energy and Utilities Board in relation to Syncrude’s Mildred Lake Development Project (1994). Human health concerns related to air quality were raised by various participants including aboriginal groups, environmental associations, and Alberta Health and Wellness. National initiatives also identified these contaminants as a priority, and set exposure limits and monitoring requirements for sulphur dioxide (SO2), nitrogen dioxide (NO2), ozone (O3), and particulate matter (PM). Finally, the availability of appropriate technology was a key defining factor in the final selection. Personal samplers for ozone and particulate matter were commercially available, but samplers for SO2 and NO2 had to be developed and tested during the pilot study. Commercially available VOC samplers were deployed during the pilot study and analyzed for a wide range of contaminants; the final selection of VOCs analyzed for the main study included all VOCs for which measurable quantities were identified during the pilot study. The selection of biomarkers for the Alberta Oil Sands Community Exposure and Health Effects Assessment Program was based on a number of factors, including the ability of the laboratory to measure low levels of relevant biological markers, the most appropriate media for measuring the markers, and the burden placed on each volunteer. The final set of biological measures of exposure included: trace metals 1 Methods Report such as arsenic, cadmium, lead, and uranium; nicotine; and metabolites of the BTEX compounds (benzene, toluene, ethylbenzene, m-, p-, and o-xylene). Although there are several methods of measuring benzene exposure in biological media, the most appropriate measure of low level exposure to benzene from environmental sources is urinary muconic acid.2 Studies have shown that urinary muconic acid is the most sensitive measure available to detect environmental exposures of less than 1mg/m3. 3 Similarly, urinary mandelic acid, hippuric acid, 2-, and 3-, 4-methylhippuric acids are indicative of exposure to ethylbenzene, toluene, and o- and m-xylene, respectively. Measures of serum levels of nicotine were included to identify the contribution from tobacco smoke to serum levels of both trace metals and BTEX compounds. The biological measures of effect included in the study included: autoantibody activity, a neurocognitive assessment, and a respiratory health assessment including a respiratory health history survey and a spirometry assessment. Increases in antinuclear autoantibodies result from a reaction by the immune system to external stressors. Comparison of prevalence with reference populations can be used to demonstrate differences in exposure and response. In addition, it is important to estimate the impact on human health from natural sources such as pollen and dust, to determine the relative impact from oil sands activity. Neurocognitive impairments have been associated with exposure to a variety of contaminants, both through high volume occupational exposure and low-level environmental exposure. Neurobehavioral tests have been demonstrated to be sensitive to minute changes in neurocognitive functioning resulting from exposure to contaminants such as lead, mercury, aluminum, and volatile organic compounds. Organic solvents also pose a threat to the central nervous system because of their lipophilic characteristics. Shortterm low-level exposure has been linked with a pre-narcotic reversible effect of psychomotor slowing or vigilance decrement.4 Other studies have shown a pre-narcotic state of central nervous system depression, characterized by behavioral dysfunction.5 Further evidence of the detrimental health effects of organic solvents have demonstrated that heavy and long term exposure situations can induce a chronic, partially irreversible encephalopathy, with an excess of neuropsychiatric complaints.6, 7 Volatile organic compounds (VOC) can have a similar impact on the central nervous system. Symptom questionnaires and rating scales have produced consistent evidence of sensory irritation or discomfort resulting from exposure to low-level VOC mixtures.8 Among the wide range of VOCs, toluene is the best known neurotoxicant. Accidental occupational exposure9 and controlled exposure experiments10, 11 have demonstrated its adverse effects on balance, cognitive function, and colour vision. Moreover, toluene toxicity can be further increased with the simultaneous exposure of methyl ethyl ketone. The respiratory system is naturally a major site of exposure to airborne contaminants. The effects of exposure to airborne contaminants on the respiratory system range from mild, acute, and reversible, to severe, chronic, and permanent. Epidemiological studies have shown increased respiratory symptoms (sneezing, cough, chest pain, wheezing) and asthma medication use;12 hospital admissions for respiratory illness;13 cardiovascular mortality;14 and all-cause mortality15 associated with increased concentrations of ozone, nitrogen dioxide, sulphur dioxide, and inhalable suspended particles. Acute effects of exposure to these contaminants, as well as to volatile organic compounds, include irritation of the respiratory tract, resulting in coughing, sneezing, chest pain, wheezing, etc. and the exacerbation of asthma symptoms; higher concentrations may cause lung edema. Sulphur dioxide can even cause death due to spasm of the larynx and respiratory arrest.16 Chronic exposure to these contaminants may cause structural alterations in the respiratory epithelium that compromise oxygen absorption and lung elasticity, reduce the ability of ciliated cells to clear mucus from the lungs, leading to increased susceptibility to infection, and can even lead to tumor formation.17 Humerfelt argued that occupational exposure to sulphur dioxide and metal fumes result in an accelerated decline in forced expiratory volume in 1 second (FEV1).18 2 Methods Report Measuring the extent of damage due to exposure to airborne contaminants can be problematic. Spirometric measurements such as FVC or FEV1 produce consistent results, but may not be sensitive enough to detect damage to the smaller airways, which are the primary site of attack by airborne contaminants. On the other hand, tests of small airway function, such as the FEF25%-75%, are more sensitive, but show large within-individual variation, decreasing the reliability of results.19 The measure of choice in this case was FEF25%-75% because it is sensitive enough to detect obstruction in the small airways, and its higher variability makes it more useful in the comparison of data from large populations.20 In addition to the direct measures of exposure and the measurement of biological markers of exposure and effect, the study instruments also included a time-activity diary that required participants to record daily activities that might have an effect on exposure. 1.2 Components of the Main Study The Main Study collected and utilized a very broad range of human health and exposure data sources. Figure 1 provides a pictorial description of some of these sources of data. Table 1 provides a more extensive list of data sources for the project, grouping them into various components and providing a purpose for collecting each source of data. Figure 1: Components of the Study Blood and urine samples Respiratory health Neurocognitive measures Occupational environment Time activity diaries Diet and nutrition Other lifestyle behaviors Diagnosed health conditions Health history Ambient air station Meteorological data Active particulate matter samplers: PM2.5 and PM10 _ Drinking water Residential environment Passive samplers: SO2, NO2, VOCs, and O3 3 Methods Report Table 1: Components of the Main Study Component Media or Source of Data Vital Statistics Other Demographics Characteristics of the Sample Lifestyle behaviors Drinking water Time Activity Diary Personal Exposure Monitors Exposure Measurement Passive samplers Particulate samplers Electron microscopy Household sources Work sources Dietary exposure Blood Biomarkers of Exposure Urine Autoantibodies Biomarkers of Effect Immunoglobulin gamma E (IgE) Lung Function Neurocognitive measurement Measures of Health Exposure Sources Questionnaires WBEA ambient station data Exposure measurements Purpose General information was collected to help characterize the samples and populations. Questionnaires identified individual smoking habits, body mass index, nutritional intake, and physical activity levels. Routine chemistry and trace metals were measured in a sample of the drinking water used by the household. The time activity diary identified potential routes of exposure in daily activities. Exposure measurement identified the actual exposure levels of each participant during a regular day, using personal, indoor, and outdoor air monitors. A sub-sample of participants was asked to provide exposure measures for particulates. Particulate matter samplers were analyzed for the presence and type of organic, mineral, and metal particles. A questionnaire was used to identify potential sources in the home and work environments, and identification of potential dietary sources of exposure. Analysis included cotinine (a metabolite of nicotine) and a variety of heavy metal compounds including arsenic, selenium, lead, vanadium, and cadmium. Analysis included metabolites of the BTEX compounds (benzene, toluene, ethylbenzene, m-, p-xylene, and o-xylene) and a variety of heavy metal compounds such as arsenic, selenium, lead, vanadium, and cadmium. Analysis included immunofluorescence microscopy to detect autoantibodies, which indicate elevated immune system reaction. Levels of IgE in blood were examined. High levels of IgE are associated with an increased incidence of diseases including bronchial asthma, allergic rhinitis, and eczema. Spirometry was used to measure the individual’s lung capacity and volume during the exposure-monitoring period. A respiratory health survey was also administered. Computerized neurocognitive tests and the completion of other activities were used to determine the possible impact of chronic exposure on neurocognitive functioning. Questionnaires identified general, occupational, emotional, and psychological health. A questionnaire identified previously diagnosed health problems. Quantify relative contribution of local emission sources to exposure for various contaminants. 4 Methods Report 1.3 Recruitment of Volunteers A sampling pool of volunteers was recruited from the community through the use of local newspaper, radio, and television advertisements, as well as some general phone solicitation and staff recruitment from the major employers. All participants who participated were required to be either temporary or permanent residents of the town of Fort McMurray, Alberta. Volunteers were restricted to adults who lived within the town of Fort McMurray, and excluded people who lived on acreages outside of the city limits. Participants were selected at random from the volunteer sampling pool and contacted for an introductory interview at the study office. It was believed that volunteers would be more willing to comply with the high level of commitment required in the study. At the time of recruitment, all participants were made fully aware of the purpose and requirements of the study. Volunteers were required to provide their phone number and current address, in order to be contacted at a later date and time, to confirm an appointment for the introductory interview. All volunteers were required to be at least 18 years of age. Volunteers younger than 18 years of age were not accepted due to the difficulty of obtaining legal consent for their participation in addition to the level of commitment and responsibility required from participants in the study. Volunteers who smoked, although excluded from the pilot study, were included in the main study for three main reasons: 1) the relative importance of exposure to contaminants in the ambient air could be compared to voluntary exposure; 2) it was also believed that by minimizing the exclusion criteria, the sample size would be more representative of the general population of the community; and 3) it was believed that by collecting, and including in the analysis, data on past and present individual smoking habits, that excluding smokers was not necessary. All participants were required to participate in a 1-2 hour appointment at the study office. Furthermore, to meet the requirements of the air-sampling component of the study, volunteers had to be available for five consecutive evenings, beginning on the day of their initial appointment. No incentives to participate in the study were provided to the volunteers. One participant was added to the study each day. This method maintained a steady and manageable workload for the field study teams, and ensured that an equal number of participants would be assessed in each season of the year. The same approach of volunteer recruitment was used for the control community. 1.4 Field Staff A field coordinator was responsible for selecting and screening participants, booking appointments for the field monitoring teams, maintaining the sampler inventory, coordinating the flow of samplers to the laboratory for analysis, supervising the field personnel, and to undertake all monitoring activities at the ambient air station. In addition, the field coordinator was responsible for organizing sampling information and respondent data, and ensuring that all aspects of the study were administered to each of the participants. There were several field-monitoring teams each consisting of two trained personnel who were responsible for deployment and retrieval of the air samplers in participant homes, conducting daily spirometry tests and collecting completed questionnaires and time activity diaries. The field coordinator was available to assist the monitoring teams with identification of the appropriate location for samplers, to establish the required flow of information, and to prepare the field equipment each day. 5 Methods Report 1.5 Study Office A study office was situated in a location that provided easy access to local residents to enhance participation. The available space was divided into a testing office, equipment preparation and repair, equipment cleaning, and sampling head assembly areas. Biological sample collection was conducted at the local hospital laboratory by trained technicians. 1.6 Field Staff Training Field staff received several days of classroom and practical training. Field staff were required to follow a strict protocol for sampler deployment and retrieval, designed for quality control purposes. Periodic review and retraining was conducted to maintain quality, consistency and accuracy of procedure and protocol. A supervisor accompanied field staff on site visits chosen at random to ensure that the protocol remained consistent. 1.7 Field Operations Each participant was required to complete a standard protocol. The standard protocol required each volunteer to visit the study office for initial testing. Participants were required to sign a consent form and provide their Personal Health Number (PHN) before beginning. Additional screening criteria included: 1.8 • participants must be able to remain at the study office for approximately two hours to provide the required preliminary information; and • participants must be available the same evening to allow the field team to install the monitoring equipment in their home and on the individual. Introductory Interview The introductory interview was conducted by a trained interviewer who began with a clear description of the requirements of participation. Volunteers were given the opportunity to decline participation, and were required to sign a consent form before proceeding. The interviewer ensured that the participant read and understood the consent form, and answered any questions concerning their participation. The consent form is included in the Appendices. To maintain and ensure confidentiality of participant information, a personal identification number was assigned to each participant. This unique identifier was used in all components of the study, and the participant names and addresses were not included on any data files. All participants completed a test of visual acuity using a standard Snellen eye chart.21, 22 Previous articles have recommended measuring participants visual acuity when responding to visual stimuli presented via computerized neurobehavioral testing.23 In addition, all participants completed a colour blindness test.24 Correct colour vision was necessary to accurately complete the colour-word task of the neurocognitive battery. Participants showing any colour deficits during the colour-blindness test were not administered the colour-word task. The participant’s weight and height were also recorded. All instructions given and activities administered were the responsibility of a trained interviewer. The order of administration of all activities was identical for each subject. Participants first completed the test of visual acuity, followed by the colour blindness test. The Verbal Digit Span and Respiratory Health Questionnaire were administered by the interviewer, and then participants were left alone while they completed the Neuropsychological Impairment Scale (NIS). A complete description of the Verbal Digit 6 Methods Report Span, the Respiratory Health Questionnaire and the NIS is included in the Appendices. The remaining time of the appointment consisted of participants completing several selected tests from the Neurobehavioral Evaluation System (NES2) battery. At the completion of the interview, each participant was given two questionnaires and some information outlining the events to take place over the course of their participation. The participants were made aware of what to expect and given numbers to call if their schedule interfered with the appointments booked at the outset of the interview. The interviewer also reviewed and explained how to complete the questionnaires and the time activity diaries. 1.8.1 Neurocognitive Tests The neurocognitive tests used for the study included both computerized and manually administered tests. A computerized battery of neurocognitive tests was preferred for many reasons. Some of the advantages of computerized neurocognitive testing include: 1) standardization of testing conditions between different research groups, which results in greater feasibility of pooling data from unexposed populations to generate reference data; 2) data collection and scoring is automated, and thus easier, faster, invariable, more accurate, and less error-prone (the NES2 contains an efficient data processing program that permits rapid scoring and display of results after testing); 3) a computer-administered format can change the nature of the test session from a potentially threatening and tedious situation to one with a challenging “game” quality; 4) automated administration is generally a more efficient and less time consuming method of assessing neuropsychological function in epidemiological studies; and 5) results in lower administration costs. After an extensive review of the literature on neurocognitive test batteries, it was determined that the most appropriate test battery, for the purposes of the current study, was the Neurobehavioral Evaluation System (NES2). The NES2 is a computerized neurobehavioral test battery that was developed in 1985 at Harvard University, Cambridge, Massachusetts, by Dr. E. L. Baker and Dr. Richard Letz. The intention of the development of the NES2 was to have an efficient and practical tool to measure neurobehavioral functions in large-scale epidemiological studies. The main goal was to have the NES2 quantify a range of neurobehavioral functions of employed, primarily healthy, adult populations in a standardized format, under field investigation conditions, with severe time constraints and portable equipment. The NES2 was designed to be easy to use to encourage widespread acceptability and thus, address the need for standardized test methods.25 The primary purpose of the data collected with the NES2 is to relate the quantitative neurobehavioral assessment to measurements of neurotoxicant exposure. It was assumed that test performance would become more impaired with increased neurotoxicant exposure. The NES2 was designed to be used in two types of exposure situations: 1) studies examining the acute effects of exposure by repeated testing of individuals throughout the work day; and 2) the cross-sectional epidemiological study that evaluates participants on a single occasion. The current study is most closely related to the latter of these two uses. The flexibility and the “user friendly” design of the NES2, which is easily administered by a minimally trained technician, using an IBM compatible computer, has allowed it to be useful in these and many other testing situations.26 The NES2 consists of 18 neurocognitive tests, which evaluate a variety of neurocognitive functions. Four of the NES2 tests are direct variants of the World Health Organization Neurobehavioral Core Test Battery (WHO-NCTB), a widely administered and validated battery of non-computerized neurobehavioral tests, from which the concept for the automated NES2 was derived from. During the selection of the tests to include in the NES2 battery, emphasis was placed on adapting tests that had been useful in many 7 Methods Report occupational studies. Simple, non-verbal tests were chosen that would be minimally affected by differences in language and education.27 Table 2 lists the tests included in the NES2, their functional domains, and the specific function tested. Table 2: NES2 Tests, Functional Domain and Specific Function28, 29 Test Functional Domain + Function Symbol-digit substitution * Coding speed/ability Hand-eye co-ordination * Motor co-ordination (dexterity)/visuomotor accuracy Simple reaction time *+ Continuous performance test or CPT with animals * Psychomotor Performance Finger tapping * Pattern comparison test * Sustained attention, speed Motor speed Perceptual Ability Visual digit span *+ Visual perception/perceptual speed Short term memory/attention Paired-associate learning * Paired-associate recognition * Visuomotor speed Visual learning Memory and Learning Intermediate memory Pattern memory test * Visual memory Serial digit learning * Learning/memory Vocabulary test Verbal ability Horizontal addition * Calculation (arithmetic) Switching attention * Cognitive Mental flexibility Grammatical reasoning * Higher mental processes (reasoning) Colour-word vigilance* Vigilance/attention Mood test (scales) *+ Affect Mood + Note: *Suitable for repeated measures design; Original WHO-NCTB test The NES2 tests to be administered and the administration order was determined based on an extensive review of the literature, including other studies using the NES2, reliability studies,30-32 validity studies,33 and taking into account the recommendations in the NES2 manual.34 The following NES2 tests were administered to each subject in the order presented: finger tapping; continuous performance test; hand-eye co-ordination task; paired associate learning; simple reaction time; symbol-digit substitution; pattern comparison; pattern memory; serial digit learning; switching attention; colour-word; vocabulary test; mood test; and paired associate learning delayed recognition. A complete description of the battery of NES2 tests administered is provided in section 3.1.4. To maintain consistency, each subject was tested in the same testing environment, located in an office established for the purposes of the neurocognitive testing. The NES2 tests were administered on an IBM compatible computer, using the MS-DOS program.35 The program automatically stored all NES2 test 8 Methods Report results. Participant’s data was stored under a separate file associated with their personal identification number. 1.8.2 Supplementary Psychological Tests An assessment based entirely on computerized tests has a number of drawbacks, such as the reliance on visual stimulus and the absence of verbal, non-visual tests. Two manually administered activities were included to supplement the primarily visual tests included in the NES2, the Verbal Digit Span and the Neuropsychological Impairment Scale. All participants completed the Verbal Digit Span, from the Wechsler Memory Scales-Revised (WMSR).36 Although the computerized neurocognitive battery included the Visual Digit Span, a task derived from the Verbal Digit Span. The original format was chosen as a replacement to introduce a non-visual component to the neurocognitive evaluation. Other advantages of the Verbal Digit Span include its wide range of scientific use and acceptance, and its ease of administration and scoring. Previous studies of solvent and lead toxicity have used the Digit-Span test as a measure of short-term memory and attention.37 There are two parts to the WMS-R version of the Digit Span: the Digits Forward and Digits Backward, which are administered separately. Both parts consist of six items, each consisting of two trials, which have the same number of digits. The examiner begins with item one, trial one by reading aloud the string of numbers at a rate of one per second. Each string of digits is read only once. The subject then attempts to repeat the string of numbers back to the examiner. Regardless of whether the subject is successful on the first trial, the examiner then continues with the second trial of the item, then moves to the first trial of the second item, and so on. This pattern continues until the subject fails a complete item (i.e., both trials of that item) or the subject completes the entire task (i.e., all six items). In both tasks each item increase results in the number of digits in the trials increasing by one. The Digits Backward test differs from the Digits Forward test in that the first two trials are a string of two numbers (instead of three), and the subject repeats the digits in reverse order. One point is given for each trial repeated correctly. The Neuropsychological Impairment Scale (NIS) was administered to all participants who participated in the study. The NIS was chosen to add a subjective evaluation to the neurocognitive component, which also appropriately complemented the NES2 mood scale. The Neuropsychological Impairment Scale (NIS) is a self-administered paper and pencil task consisting of a 50-item scale designed to identify neuropsychological symptoms and deficiency. The NIS provides eight scores: two global indices, a symptom intensity gauge, and a five-item LIE scale. Four additional clinical scales evolved as a result of item and empirical analysis: a General scale, a Pathognomic scale, a Learning-Verbal scale, and a Frustration scale. The NIS requires a 5th grade reading level, can be administered in 5-10 minutes, and is readily scored by hand.38 1.8.3 Respiratory Health Questionnaire The European Community Respiratory Health Survey Questionnaire was developed by the International Union Against Tuberculosis and Lung Diseases.39 It includes some basic demographic data, information on a variety of respiratory symptoms (including cough, phlegm, wheeze, chest tightness, shortness of breath, and others), qualitative information on the indoor environment (presence of carpeting, pets, smokers, type of heating and cooking fuel, etc.), a smoking history, and a history of past medical conditions, especially respiratory conditions. Although many of the questions are replicated in the Demographic and Exposure Questionnaire, both questionnaires were included in entirety because they are standardized and to support comparisons between interviewer-administered questions and selfadministered questions. 9 Methods Report 1.8.4 Demographic and Exposure Questionnaire The Demographic and Exposure Questionnaire was designed to collect information about participant demographics, occupational health, and work and home environments including potential sources of contaminants. It included all of the questions on the Basic Standard Environmental Inventory Questionnaire, designed to help classify relative concentration estimates.40 A standard occupational health symptom questionnaire was included to identify symptoms related to exposure and the location with which the symptoms were associated. 1.8.5 Health and Nutrition Survey The Health and Nutrition Survey was designed to collect a variety of health indicators including mental and physical health, physical activity levels, and nutritional intake. The Dietary Survey was developed for the study based on the format used for the American National Cancer Institute’s Health Habits and Diet Survey.41 Participants were required to estimate the amount of each food item that they typically ate over the previous year, including estimating the usual serving size as well as the frequency they consumed the food. The Dietary Survey included a wide range of commercially available foods as well as a number of wild foods obtained locally. Volumes were defined using the Canadian Food Guidelines so the data collected from the survey could be converted into average daily nutritional intakes using the Canadian Nutrient File.42 The survey was self-administered, and included a detailed example to clarify the instructions. The survey also requests information about the participant’s weight and height, weight gain or loss over the previous year, and vitamin or medication intake. Two standardized scales were included: the General Health Questionnaire (GHQ), and the Short-Form-36 Health Survey (SF-36). Both questionnaires are well validated and documented tools for assessing health. The GHQ assesses psychological well-being, and the SF-36 assesses physical functioning, role limitations, bodily pain, social functioning, general mental health, vitality and general perceptions.43, 44 Measures adapted from the National Population Health Survey conducted by Statistics Canada were included to provide information about physical activity level. Participants were also required to identify previously diagnosed chronic health conditions. There were 307 Demographic and Exposure Questionnaires completed, 277 from Fort McMurray and 30 from Lethbridge and 304 Health Habits and Diet Surveys completed, 274 from Fort McMurray and 30 from Lethbridge. Some participant’s questionnaires could not be retrieved after several attempts to contact the volunteer and others dropped out of the study part way through and thus, did not complete the questionnaires. 1.8.6 Personal Healthcare Numbers (PHNs) During the completion of the consent form participant’s were asked to record there Personal Health Number (PHN). A total of 327 PHNs were collected, 295 (98.3%) from Fort McMurray and 32 (94.1%) from Lethbridge. 1.9 Site Visits The field coordinator was responsible for preparing the equipment, supplies and tools necessary for each visit, checking and validating data, and supervising the teams to ensure accuracy and consistency. Preprinted stickers with bar code numbers were used to track all samplers and biological material. 10 Methods Report Field monitoring teams operated in pairs to ensure safety and improve accuracy. Each team received a list of participants, who had completed the initial interview described above, and the times that the appointments were booked. The teams were responsible for contacting the participant at the previously arranged appointment time to place the samplers inside and outside the home and on the individual. The monitoring team also provided details about the equipment being placed in the home and explained what to do if there were problems with the equipment. In addition, the monitoring team reviewed the method for completing the time activity diaries. Each participant was required to be available for four consecutive 24-hour periods, and appointments were booked during the introductory interview. Two field staff visited each site at approximately the same time each evening to retrieve exhausted samplers and deploy fresh samplers and conduct spirometry. Field staff also retrieved completed time activity diaries each day and retrieved the questionnaires when completed. The urine sample bottles were deployed during the last appointment, along with instructions for their use. Participants were also reminded to visit the local hospital laboratory on the following day to deliver the urine sample and provide a blood sample. All documents and data collected by the field monitoring teams were returned to the study office at the end of the day. The information on the data collection instruments was keyed and the forms were returned to storage. After error checking and validation, the keyed data was used for statistical analysis. Sampler identification numbers, participant identification numbers, date and time of exposure and location of exposure was recorded each day for each set of exposed samplers. The field coordinator maintained a hard copy inventory of all samplers sent to the laboratory from Fort McMurray, and a copy was sent to the laboratory with the details of each shipment. Each sample was logged-in upon receipt at the laboratory and its condition noted. All monitoring filters were sorted by numerical filter number order. Filters were kept in their original plastic slides, bundled in batches of 10, and stored in boxes. The boxes were then placed in a locked refrigerator set at 4.5oC. A hard copy inventory of all sampler filters returned from Fort McMurray was maintained in the laboratory to record the status of each filter. 1.9.1 Personal Exposure Measurement Instruments Five air contaminants, including volatile organic compounds (VOCs), sulphur dioxide (SO2), nitrogen dioxide (NO2), ozone (O3), and particulates (both PM10 and PM2.5) were designated for evaluation in the Main Study. Figure 1 provided a pictorial description of the monitoring of the air contaminants on the study participants. Passive samplers measuring SO2, NO2, O3, and VOCs were placed outside and inside the residence and on the person daily for four days. One in six participants were selected for particulate matter (PM) monitoring which involved two pumps outside and two inside collecting PM2.5 and PM10 and one pump on the individual alternating between PM10 and PM2.5 samples. Descriptions of the passive gaseous samplers and active particulate samplers used in the study are described in greater detail in sections 2.1 and 2.2 of this report. 1.9.2 Time Activity Diary Activity logs and diaries are an important part of exposure assessment. The time activity diary can indicate potential sources of exposure to a particular contaminant due to many daily activities, such as taking a shower, driving a car, or hobbies, that are known to be associated with exposure to particular airborne contaminants. Activity diaries are widely recommended in the literature45, 46 and have been proven to be valuable to the interpretation of the measured exposure levels. The collection instrument was a 11 Methods Report simple design that allowed the participant to identify their daily activities and the time at which these activities took place. Participants were asked to include all activities undertaken while wearing the sampler, including periods of sleep, bathing, and eating. Participants were asked to record their activities during each 24-hour monitoring period, recording where they spent their time, what they did, and what potential exposures they may have had. 1.9.3 Lung Function Field staff were provided two days of intensive training in administering the spirometry tests. The American Thoracic Society’s standardization protocol was used to define appropriate and successful spirograms.47 Each participant was required to complete five spirometry tests on each day of participation in the study, for a total of twenty-five tests. Tests were then evaluated and invalid tests were discarded. Additional information is included in the Appendices. 1.9.4 Drinking Water Sampling The standard provincial protocol used for public health assessments of drinking water was employed for the study. Routine and trace metals analysis was performed on samples obtained from each participant’s tap water. 1.9.5 Biological Sampling Each participant was required to provide a 12-hour urine sample and a blood sample for biomarker measurement. The urine samples were separated into three separate aliquots. The blood samples were treated and separated prior to shipping. The samples were shipped to the three laboratories frozen and packed on dry ice. The urine samples were analyzed for muconic acid, hippuric acid, mandelic acid, methylhippuric acid, 2-hexanol and 2,5-hexamedion, and a variety of heavy metal compounds including arsenic, selenium, lead, vanadium, and cadmium. In addition, the species of arsenic found in each sample were identified. Blood samples were analyzed for cotinine as a measure of exposure to cigarette smoke, for trace metals, and to identify the species of arsenic found in each sample. 1.10 Data Entry All data was entered into a Microsoft Access database and validated by the data manager to ensure completeness and accuracy. Personal information was removed from all materials, and records were identified exclusively with the participant identification number. All data files on the PC were then converted to SPSS and SAS databases for analysis. Documentation of the file formats, including variable positions, lengths, types, and meanings, were developed. Results of the laboratory analysis of the samplers and particulate filters were also sent from the laboratory to the data manager who created a database of all information collected during the study. After the original database was compiled from the various sources, the data manager printed records for examination. All discrepancies were investigated and corrected where possible. Records with unusable or suspect data were flagged and returned to the database with the accompanying flag. The data manager also scanned the database to discover specific problems, including out-of-range particulate pump flows or 12 Methods Report particulate catches, duplicate uses of codes, and missing data. These problems were flagged, investigated, and corrected wherever possible. 1.11 Data Analysis Data analysis was completed by the science team at Alberta Health and Wellness using SPSS, SAS, and S-plus statistical packages. 2.0 Exposure Assessment Methods and Protocols 2.1 Passive Air Samplers Five contaminant classes have been designated for the study, including volatile organic compounds, sulphur dioxide, nitrogen dioxide, ozone, and particulates (PM10 and PM2.5). All of the compounds, except for particulate, were measured through the use of passive sampling devices. The passive sampling devices used were small plastic containers that held adsorbent pads containing compounds designed to react with the contaminants of interest in the air, such as O3 or SO2. After samplers were exposed to the air for a specific period of time, the adsorbent pads were removed and analyzed to determine the amount of the reaction products collected. The original concentration of contaminants of interest in the air can then be determined using a formula that converts the mass of reaction products to the mass of the contaminants of interest and divides by the volume of air sampled. The volume of air sampled is a product of the diffuse sampling rate of each sampler and the length of the exposure period. The SO2 and NO2 samplers used in the study were developed by Dr Siu Chan at the Centre for Toxicology, University of Calgary. The O3 sampler used the Ogawa sampler cartridge but was loaded and analyzed at the Centre for Toxicology.48 The VOCs sampler used was the commercially available 3M sampler with the extraction and analysis (GC-MS) of the collected samples done at the Centre for Toxicology (see following sections for more information on the passive samplers used). The performance of the passive samplers in terms of precision, accuracy, and detection limit can be affected by the physical processes governing diffusive sampling and the factors related to the quantifying of compounds on the adsorbent pad before and after sampling. Standard protocols in the shipping and handling of the passive badges in the field and the lab were used in an effort to minimize the variability in quantifying the compounds. Many field blanks were taken (roughly 20% of the total samples) to provide a good understanding of the background noise and detection limits. Replicate samples were used to investigate the precision of the passive samplers and the effects of air movement on the face of the samplers. Ten sets of each type of sampler were deployed daily for eight days with a 24 hour exposure period in a room of a home. Five sets of samplers were mounted on a staytionary frame while the other five were mounted on 2 m diameter frame spinning so that the sampler speed was 3 km/hr (see Figure 2). A barrier was suspended between the moving and stationary samplers to reduce the effect that air movement due to the moving frame would affect the face velocity of the stationary samplers. In addition to the 24 hr samplers, 2 groups of 20 set of each sampler type were exposued for four days with half moving and half stationary to investigate the improvement in precision with increased sample period. The results of the replicate samples are shown in Tables 3 to 6 and Figures 3 to 6 for NO2, SO2, O3, and benzene. 13 Methods Report Figure 2: Set-up for Replicate Passive Sampler Study The points plotted in the figures were the standard deviations divided by the means (percent relative standard deviation %RSD) of groups of collocated samplers. The two regression lines on each figure represent the average precision for the samplers exposed for one and four days. These figures showing the precision of the samplers also provide an estimate of the confidence interval of an individual passive measure at the different concentrations. For example, the 95% confidence interval (1.96 standard deviations) of a one-day passive measure of NO2 at a concentration of around 13 µg/m3 is roughly ±5.2 ug/ m3 (±40%). As the figure show, the precision of the passive samplers varies with the concentration of the contaminant being measured. At high concentrations relative to the background levels of the samplers the imprecision will be low while at low concentration the imprecision will increase rapidly. 14 Methods Report Table 3: Results of Replicate Study on NO2 Samplers Date 06-Jul-99 07-Jul-99 08-Jul-99 09-Jul-99 10-Jul-99 11-Jul-99 12-Jul-99 13-Jul-99 06-Jul-99 10-Jul-99 Duration 1 day 1 day 1 day 1 day 1 day 1 day 1 day 1 day 4 day 4 day Average ug/m3 16.34 11.97 15.88 18.46 22.23 31.78 31.02 24.18 14.82 24.97 Still Stdev Count ug/m3 3.89 5 1.47 5 7.56 5 2.03 5 1.97 5 3.30 5 10.01 5 11.95 5 0.94 10 2.05 10 data from collocation at Ft. McMurray Ambient Station 27-Aug-98 1 day 0.137824 0.19 5 27-Aug-98 4 day 0.468758 0.12734 5 %RSD 24% 12% 48% 11% 9% 10% 32% 49% 6% 8% Moveing Increased Average Stdev Count %RSD sample ug/m3 ug/m3 Rate 22.76 1.16 5 5% 39% 21.09 1.74 5 8% 76% 23.23 2.06 5 9% 46% 36.90 9.43 5 26% 100% 39.64 2.80 5 7% 78% 48.24 4.31 5 9% 52% 45.50 4.78 5 11% 47% 34.36 9.91 5 29% 42% 23.99 1.85 10 8% 62% 36.85 2.05 10 6% 48% Average increase in sample rate due to Wind60% using one day samples with postitive averages only 140% 27% Figure 3: Precision of NO2 Passive Sampler %RSD of NO2 Concentration 160% 140% 120% Still 1 day y = 0.2011x-0.3645 R2 = 0.9212 100% Still 4 day Move1 day 80% Move 4 day 60% Regression 1 day y = 0.5674x-0.4171 40% Regression 4 day R2 = 0.3962 20% 0% 0 10 20 30 40 Concentration of NO2 (ug/m3) 15 50 60 Methods Report Table 4: Results of Replicate Study on SO2 Samplers Date 06-Jul-99 07-Jul-99 08-Jul-99 09-Jul-99 10-Jul-99 11-Jul-99 12-Jul-99 13-Jul-99 06-Jul-99 10-Jul-99 Duration 1 day 1 day 1 day 1 day 1 day 1 day 1 day 1 day 4 day 4 day Average ug/m3 0.49 -0.38 -0.33 -0.28 0.65 0.36 -0.22 -0.01 0.04 0.29 Still Stdev Count ug/m3 0.72 5 0.30 5 0.20 5 0.42 5 2.03 5 1.21 5 0.52 5 1.09 4 0.13 10 0.44 10 data from collocation at Ft. McMurray Ambient Station 27-Aug-98 1 day -0.14004 1.05 5 27-Aug-98 4 day 2.354209 0.496863 5 Moveing Increased Average Stdev Count %RSD sample ug/m3 ug/m3 Rate 145% 0.73 2.56 5 354% 47% -80% -0.05 1.55 5 -3047% -87% -61% -0.16 0.27 5 -170% -52% -150% -1.00 1.17 5 -118% 258% 312% 1.40 0.80 5 57% 116% 335% 0.82 1.67 5 203% 129% -233% 0.92 1.31 5 142% -511% -20837% 1.32 1.08 5 82% -25230% 330% 0.36 1.12 10 310% 842% 150% 0.60 0.27 10 45% 104% Average increase in sample rate due to Wind97% using one day samples with postitive averages only -749% 21% %RSD %RSD of SO2 Concentration Figure 4: Precision of SO2 Passive Sampler 450% 400% 350% 300% 250% 200% 150% 100% 50% 0% 0.00 Still1 Still 4 Move1 -1.1146 y = 1.2669x Move4 R2 = 0.5803 0.50 1.00 1.50 Concentration of SO2 (ug/m3) 16 y = 0.3745x-0.6815 Regression 1 day R2 = 0.8755 Regression 4 day 2.00 2.50 Methods Report Table 5: Results of Replicate Study on VOC Samplers (Benzene) Date 6-Jul-99 7-Jul-99 8-Jul-99 9-Jul-99 10-Jul-99 11-Jul-99 12-Jul-99 13-Jul-99 6-Jul-99 10-Jul-99 Duration 1 day 1 day 1 day 1 day 1 day 1 day 1 day 1 day 4 day 4 day Average ng/m3 3289.20 3559.97 5725.87 1269.32 2733.17 1244.12 547.19 3207.02 1721.72 1808.79 Still Stdev Count ng/m3 536.87 5 241.67 5 735.77 5 1976.30 5 1629.93 5 1937.57 5 1583.82 5 176.43 5 128.56 10 116.66 10 data from collocation at Ft. McMurray Ambient Station 27-Aug-98 1 day 112.9652 1320.84 5 27-Aug-98 4 day 3064.075 73.2241 5 Moveing Increased Average Stdev Count %RSD sample ng/m3 ng/m3 Rate 16% 3554.62 439.25 5 12% 8% 7% 3127.19 283.86 5 9% -12% 13% 6263.82 635.38 5 10% 9% 156% 1939.99 1931.38 5 100% 53% 60% 2774.38 1658.32 5 60% 2% 156% 2801.18 1677.67 5 60% 125% 289% 2671.14 1631.01 5 61% 388% 6% 3858.42 427.82 5 11% 20% 7% 2173.67 160.19 10 7% 26% 6% 2162.07 118.12 10 5% 20% Average increase in sample rate due to Wind36% using one day samples with postitive averages only 1169% 2% %RSD Figure 5: Precision of VOC Passive Sampler (Benzene) %RSD of Benzene Concentration Precision of VOC Sampler (Benzene) 500% 450% 400% 350% 300% 250% 200% 150% 100% 50% 0% 0.00 y = 110531x-1.8948 R2 = 0.8187 y = 15129x-1.374 R2 = 0.7603 1000.00 2000.00 3000.00 4000.00 5000.00 6000.00 7000.00 Concentration of Benzene (ug/m3) 17 Still1 Still 4 Move1 Move4 Regression 1 day Regression 4 day Methods Report Table 6: Results of Replicate Study on O3 Samplers Date 6-Jul-99 7-Jul-99 8-Jul-99 9-Jul-99 10-Jul-99 11-Jul-99 12-Jul-99 13-Jul-99 6-Jul-99 10-Jul-99 Duration 1 day 1 day 1 day 1 day 1 day 1 day 1 day 1 day 4 day 4 day Average ug/m3 1.18 1.53 0.91 1.19 1.40 4.33 -0.51 -0.46 0.59 2.14 Still Stdev Count ug/m3 0.40 5 0.74 5 1.59 5 2.68 5 0.60 5 0.71 5 0.51 5 1.33 4 0.50 10 0.46 10 %RSD 34% 48% 176% 225% 43% 16% -101% -293% 85% 22% data from collocation at Ft. McMurray Ambient Station 27-Aug-98 1 day 94.57444 21.56 5 27-Aug-98 4 day 70.24772 7.997642 5 Moveing Increased Average Stdev Count %RSD sample ug/m3 ug/m3 Rate 1.30 1.31 5 101% 10% 2.66 1.63 4 61% 74% 1.22 1.98 5 163% 34% 1.58 1.22 5 77% 33% 3.51 1.10 5 31% 151% 4.62 0.81 5 17% 7% -0.07 0.72 5 -1043% -86% -0.41 0.73 5 -180% -11% 0.95 0.26 10 28% 59% 2.51 0.27 10 11% 17% Average increase in sample rate due to Wind51% using one day samples with postitive averages only 23% 11% Figure 6: Precision of O3 Passive Sampler %RSD of O3 Concentration 250% 200% Still1 Still 4 150% Move1 Move4 100% y = 0.2875x-0.2463 2 R = 0.3085 Regression 1 day -0.4328 Regression 4 day y = 0.8151x R2 = 0.3646 50% 0% 0 10 20 30 40 50 60 70 80 90 100 Concentration of O3 (ug/m3) The physical processes governing diffusive sampling can be affected by changes in temperature, relative humidity (RH), and wind speed on the samplers face. Tables 3 to 6 show the wind effects on the passive samplers used in this study causes an increased sampling rate of 36% (VOC), 60% (NO2), and 51% (O3) between samplers that were stationary and samplers moving at 3 km/hr. The SO2 samplers likely experiences similar effects although they were indeterminable due to extremely low levels of SO2 during 18 Methods Report the investigation. It has also been reported elsewhere that the sampling rate of passive samplers increases with increasing wind speed and temperature and decreases with increases in relative humidity49, 50. Corrections for these factors were not possible in the calculations of the air contaminants however, it is important to appreciate the potential bias when interpreting the results. For example, a sampler place indoor may under-report concentrations relative to a sampler place outdoors and on a person due to wind on the sampler face. Similarly outdoor samplers in the cold may under report contaminant concentrations relative to indoor and personal samplers due to temperature effects. A rough estimate of the magnitude of the bias, if a participant moved about at 3km/hr for 15% of the day then the personal NO2 sampler would have a 9% higher sampling rate than the stationary indoor NO2 sampler and uncorrected would report a 9% higher concentration. The detection limits of the passive sampler were based on three standard deviations of the field blank levels and may vary slightly between the batches of samplers through the study. The average detection limits over the study for the compounds investigated (assuming a 24-hour sample) are listed in Table 7. Table 7: Summary of Passive Sampler Detection Limits Sample Rate mL/min Detection Limit ug/m3 NO2 120 18.5 SO2 218 6.7 O3 24.5 4.7 HEXANE 32.0 6.5 BUTANONE 36.3 1.1 METHYHEXANE 28.9 3.2 BENZENE 35.5 4.4 HEPTANE 28.9 5.2 TOLUENE 31.4 26.6 OCTANE 26.6 1.8 ETHYL BENZENE 27.3 0.26 MPXYLENE 27.3 3.7 OXYLENE 27.3 0.11 NONANE 24.6 0.19 DECANE 23.1 2.0 LIMONENE 30.0 3.3 Sampler Compound An estimate of the accuracy of the NO2, SO2, and O3 samplers was obtained by comparing daily passive samples taken at the Wood Buffalo Environmental Association's Athabasca ambient monitoring station with the results of the continuous monitoring equipment. Figures 7 to 9 show a comparison of the passive and ambient station data. 19 Methods Report Figure 7: Passive Sampler Data Compared to Ambient Station Data for NO2 Passive Sampler (ug/m3) 120 100 1 to 1 line Regression line rate = 120 mL/min 80 60 40 y = 1.1038x - 3.6976 2 R = 0.5124 20 0 -20 0 10 20 30 40 50 60 70 80 -40 WBEA Ambient Station (ug/M3) Figure 8: Passive Sampler Data Compared to Ambient Station Data for Ozone 250 1 to 1 line Regression Line 200 Passive Sampler (ug/m3) y = 1.0463x + 7.018 R2 = 0.4699 150 100 50 0 0 20 40 60 80 -50 WBEA Ambient Station (ug/M3) 20 100 120 Methods Report Figure 9: Passive Sampler Data Compared to Ambient Station Data for SO2 45 1 to 1 line Regression line Passive Sampler (ug/m3) 35 25 y = 0.7958x + 0.1888 R2 = 0.7174 15 5 -5 0 5 10 15 20 25 30 35 40 45 -15 WBEA Ambient Station (ug/M3) The data show the passive samplers were reasonably accurate with fairly good agreement between the passive samplers and the ambient station monitors. 2.1.1 Passive Field Sampling Protocols Nitrogen Dioxide Sampler Jim Mulik (1989) published research on high-efficiency passive samplers designed for monitoring NO2 in ambient air over exposure durations as low as 8 hours.51 The article provided a description of a sampler holder, that was very similar in design to our SO2 sampler, and the sorbent material, triethanolamine (TEA), solutions that have been in use in active samplers for over two decades. Direct contact was made with Mulik and he agreed that our sample holder would, in all probability, function very well with a TEA treated filter. A decision was made to use our in-house sampler holders and to have the scientists at Centre for Toxicology prepare and load the sorbent pads. By doing this, the study is ensured of the highest standards of laboratory quality control, which translates into fewer concerns about the detection limits of the NO2 samplers. There are fewer sources of contamination from the sampler and analytical equipment materials (in comparison to SO2) and the typical levels of NO2 in the urban air would be notably higher due to common anthropogenic sources found in an urban environment. The sampling rate used in the study was 120 mL/min determined through collocation with the WBEA ambient monitoring station during the study. Sulphur Dioxide Sampler Leaderer et al., 1994, published results where typical urban air concentrations were measured with a passive sampler over 24 hours.52 The sampling rate of the sampler was determined to be 41.1 mL/minute and sensitivity of the sampling method was down to 200 ppb over a 4 hour sample duration. Assuming a constant sampling rate, this would translate into sensitivities of about 35 ppb over a 24 hour sampling duration. Unfortunately, from a methods development perspective, the Air Quality Monitoring Report for 21 Methods Report Alberta, 1993 indicates that typical concentrations of SO2 in Fort McMurray and Fort McKay are between 5 and 10 ppb (13 to 26 ug/m3).53 It was decided that the Leaderer design was acceptable, however the sorbent pad area needed to be slightly larger to facilitate the collection of more contaminant. In addition, the diffusion path between the diffusion membrane and the treated sorbent pad needed to be decreased to increase the sampling rate. The final sampler design for the current study was a clear, lightweight, plastic holder with a diameter of 55 mm. The sampler is constructed from a modified 55-Plus Millipore Filter Holder with a removable TEFLON diffusion barrier designed to protect the sorbent pad from wind and rain. The sorbent pad is cleaned and treated at the Centre for Toxicology at the University of Calgary and loaded into the holders under zeroair conditions. A specially designed TEFLON ring is used to hold the filters in place and a standard “bull-dog” clip is used to attach the sampler to the volunteer. Lastly, the samplers are shipped individually in an airtight vial purged with nitrogen prior to leaving the Centre for Toxicology. The sampling rate used in the study was 120 mL/min determined based on collocation with the WBEA ambient monitoring station during the study. NO2 and SO2 Sampling Protocol 1. Each monitor is packaged in a plastic transportation vial that is sealed with parafilm tape. Ensure that the parafilm seal is intact. If it is not, use another monitor or make note of this on the field data log sheet and continue. 2. Unscrew the plastic lid of the vial and carefully remove the monitor. DO NOT TOUCH THE WHITE FILM (permeation barrier). 3. The container should have three identical peel-away labels. There should also be a label on the back of the sampler as well as on the outside of the container. Ensure that all labels are identical. The “no” or “so” prefix will identify whether the sampler is an NO2 or SO2 sampler, respectively. 4. Affix one of the labels to the field data log sheet in the appropriate space provided. Place the remaining two labels back into the container (the laboratory will require the remaining labels). 5. The following should be recorded on the field data log sheet: participant number, site description, date and time (military) of sample initiation, and relevant comments as deemed necessary. 6. Ensure that the sampler is intact and the clip is operable. If the clip is broken or the permeation barrier of the sampler is damaged, it is advised that you do not use this sampler or at the very least, record this information on the log sheet. 7. Attach the air monitor to the personal sampler necklace, the indoor stand, or the outdoor stand. 8. After the sampling period has ended, remove the monitor from the sampling location and return it to the appropriate shipping vial facedown. Ensure that the labels on the sampler and the container are identical. 9. Tightly screw the lid onto the transport vial and seal with parafilm tape. 10. Record date and time of sample termination on the data log sheet. 22 Methods Report 11. Transport vials are to be collected at a central location and shipment is made to the laboratory twice weekly. Preparation of NO2 and SO2 Blank: 1. Skip step 7 above and continue with following steps as if the air monitor was exposed. It is not necessary to record the time of exposure as the monitor is not being exposed for any relevant length of time. Ozone Sampler The Ogawa Sampler is recognized by several research institutions (EPA Research Triangle Institute, Harvard School of Public Health, Gage Research at University of Toronto) as the preferred passive sampling method for ozone. The sampler was originally designed by Harvard and is currently receiving royalties from Ogawa & Co. USA, Inc. who serve as the North American distributors. There is a significant level of comfort when using this method because it has been used extensively in the United States and Japan for monitoring ozone for personal and stationary ambient air exposures. Extensive validation studies are also available that indicate the variability of the sampling rate and possible sources of bias. The original selection of the sampler came on the recommendation of Dr. P. Koutrakis, while subsequent support for the sampler has been received from Dr. J. Mulik (RTI), Dr. Broder (Gage Research), and from field studies carried out by Alberta Environmental Protection and the Clean Air Strategy for Alberta. The design of the sampler makes it very compact and ergonomically friendly. It is a small cylindrical polymer body (2 cm diameter x 3 cm) with treated filters mounted at each end. The diffusion barrier, as mentioned earlier, is not a membrane but rather a plastic cover with several holes. This is preferred for sampling gases such as ozone because it is high reactivity with many substances including porous materials that may be used in other passive sampler applications. The cylinder holder is mounted in a small support with a pin attached to the back. Unlike the SO2 and NO2 samplers, the O3 sampler sorbent filter pads are patented and must be ordered from the supplier. The sorbent pads are ordered separately from the holders and loaded under zero air conditions in the laboratory. The active ingredient on the pads is nitrite (NO2-); it collects ozone as nitrate (NO3) and is reported from the lab as a mass of nitrate ion. Stoichiometry is again 1:1 and the sampling rate reported by Koutrakis, et al. (1993) is 24.5 mL/minute.54 O3 Sampling Protocol 1. Each monitor is packaged in a plastic transportation vial that is sealed with parafilm tape. Ensure that the parafilm seal is intact. If it is not, use another monitor or make note of this on the field data log sheet and continue. 2. Remove the plastic lid from the vial and carefully remove the monitor. DO NOT TOUCH THE SIDES OF THE SAMPLER (intake location). 3. The container should have three identical peel-away labels. There should also be a label on the back of the sampler as well as on the outside of the container. Ensure that all labels are identical. The “oo” prefix will identify that the sampler is an O3 sampler. 23 Methods Report 4. Affix one of the labels to the field data log sheet in the appropriate space provided. Place the remaining two labels back into the container (the laboratory will require the remaining labels). 5. The following should be recorded on the field data log sheet: participant number, site description, date and time (military) of sample initiation, and relevant comments as deemed necessary. 6. Ensure that the sampler is intact and the clip is operable. If the clip is broken or the intake areas of the sampler are damaged, it is advised that you do not use this sampler or at the very least, record this information on the field data log sheet. 7. Attach the air monitor to the personal sampler necklace, the indoor stand, or the outdoor stand. 8. After the sampling period has ended, remove the monitor from the sampling location and return it to the appropriate shipping vial. Ensure that the labels on the sampler and the container are identical. 9. Tightly place the lid onto the transport vial and seal with parafilm tape. 10. Record date and time of sample termination on the data log sheet. 11. Transport vials are to be collected at a central location and shipment is made to the laboratory twice weekly. Preparation of O3 Blank: 1. Skip step 7 above and continue with following steps as if the air monitor was exposed. It is not necessary to record the time of exposure as the monitor is not being exposed for any relevant length of time. Volatile Organic Compounds Sampler The 3M Brand Organic Vapour Monitor #3500 is the passive air sampling device that was selected for use in the Alberta Oil Sands Community Exposure and Health Effects Assessment Program. For personal sampling the sampler is worn near the breathing zone on the human host lapel or shirt collar, while ambient indoor and outdoor monitoring involves placing the sampler in an open area with sheltering from the elements if required. The OVM-3500 is made of a metal collar clip attached to a plastic sorbent pad holder containing a charcoal pad. A porous material that serves as a diffusion membrane protects the sorbent. After exposure, the monitor is eluted with 1.5mL of carbon disulfide fortified with internal standards (benzene-d6, toluene-d8 and ethylbenzene-d10) and then the extract is analyzed by GC/MS. The 3M sampler was introduced in the early 1970's as an occupational hygiene air sampler. Since this time, research by Coutant and Scott (1982), Shields and Weschler (1987), and Otson (1990) have combined to build a considerable level of confidence in the methodology.55-57 Moreover, Gagner (1996) performed exposure chamber, field, and personal validation studies at low temperatures in direct support of the current study’s mandate.58 24 Methods Report VOCs Sampling Protocol 1. Each monitor is packaged in an aluminum can. The original shipping container must be used to send the exposed monitor to the laboratory for analysis. 2. Remove the plastic lid from the can. There should be four removable labels under the tab of the can. Ensure that all four labels as well as the label affixed to the side and lid of the can are identical. The “vo” prefix will identify that the sampler is a VOC sampler. 3. Open the can carefully and remove the air monitor from the can. DO NOT TOUCH WHITE FILM OR REMOVE THE PLASTIC RING. (Note: If the ring tab snaps off while attempting to open the container, you may be able to carefully use something to assist in removing the lid. As a last resort, use a can opener. This will destroy the container and will require you to use parafilm to reseal the exposed sampler.) 4. Affix one of the labels to the back of the VOC sampler and one to the field data log sheet in the appropriate space provided. Place the remaining two labels back into the container (the laboratory will require the remaining labels). 5. The following should be recorded on the field data log sheet: participant number, site description, date and time (military) of sample initiation, and relevant comments as deemed necessary. 6. Ensure that the sampler is intact and the clip is operable. If the clip is broken or the permeation barrier of the sampler is damaged, it is advised that you do not use this sampler or at the very least, record this information on the field data log sheet. 7. Attach the air monitor to the personal sampler necklace, the indoor stand, or the outdoor stand. 8. After the sampling period has ended, remove the plastic ring and white film from the face of the sampler. Take the closure cap from the container and firmly snap it onto the face of the sampler. Ensure that the two port plugs are firmly seated. 9. Turn the clip to one side and return the monitor to the appropriate can and seal with plastic lid provided. Ensure that the labels on the sampler and the container are identical. No parafilm is required as the closure cap and plastic lid provide an appropriate seal. 10. Record date and time of sample termination on the data log sheet. 11. Transport vials are to be collected at a central location and shipment is made to the laboratory twice weekly. Preparation of VOC Blank: 1. Skip step 7 above and continue with following steps as if the air monitor was exposed. 25 Methods Report 2.1.2 Quality Assurance and Control Desorption Efficiency A known amount of each volatile organic compound was deposited on the activated charcoal filter of the 3M OVM-3500 passive monitor. These compounds were desorbed (extracted) with carbon disulfide. The amounts of these compounds recovered were determined by instrumental analysis. This was performed in triplicates and desorption efficiencies were found to be about 100%. This was in agreement with what was indicated by the manufacturer. Stability of Analytes Three sets of passive monitors were spiked with the volatile organic compounds. They were stored for one, four and seven days. The compounds were extracted from the monitors and analyzed. It was found that the amounts recovered were similar among these three sets of monitors indicating the exposed monitors were stable up to at least seven days. Sampling Rates In order to calculate the concentration of the volatile organic compounds in air, the sampling rates of these compounds were required. These sampling rates were obtained from the manufacturer, except for limonene. For limonene, a sampling rate of 30 ml/min was used, and this value was in line with compounds of similar structure. Detection Limits In most cases there was no contamination of volatile organic compounds in the monitors, and the detection limit was governed by the performance of the analytical system, gas chromatograph/mass spectrometer. The detection limit was 0.1 µg/mL in the extract, or 150 ng per monitor. If there were contamination in the monitor, the detection limit would be higher. The most common contaminant was toluene. When there was measurable contamination, the limit of detection can be estimated through a statistical analysis of the amount of the contaminant in the blank monitors. The detection limit was equal to three times the standard deviation. For example, the limit of detection of toluene was estimated to be 580 ng per monitor. 2.2 Particulate Air Samplers PM samples were collected by drawing air through a size-selective impactor that removed the unwanted larger sizes of particulate and captures the smaller sizes on a pre-weighed Teflon filter. The PM samplers used for outdoors samples were the Personal Environmental Monitors (PEMTM, MSP Corporation, flow rate 10 L/min), indoor samples used the MINIVOL Portable Samplers (Airmetrics, flow rate 5 L/min), and personal samples used the PEMTM at 4 L/min. A collocation study to evaluate the performance of samplers used for collecting PM2.5 and PM10 was carried out in December 1996 (Appendix B). The goal of the collocation study was to determine the detection limit, precision, and accuracy of the PM sampling techniques used in the main study. Many factors can affect the PM measurements such as filter weighing, sampler flow rate stability and measurements, temperature and barometric pressure changes during sampling, sampler shipping and storage, and filter handling. To minimize filter-handling errors, pre-weighed filters were loaded in sampling heads at the lab and shipped to the site. Care was taken to ensure the flow measurement devices 26 Methods Report were comparable. Problems that occurred with oil from the PEMs impactor surfaces adsorbing to the Teflon filters during shipping and handling were resolved by using a less volatile oil and refrigerating the samplers during storage. An investigation of the effect of relative humidity on the filter weighing in the lab found that controlling RH within ±5% in the range of 30-40% RH during weighing minimized the impact on the PM mass measurement to 2% of the mass. The instrument detection limit (electronic micro-balance CAHN C-30) for the mass measurement is 5 µg, while the method detection limit is 20 µg per filter regardless of the samplers used. The method detection limit in terms of air concentration for a 24 hr sample at the various flow rates is 3.5 ug/m3 for personal, 2.8 ug/m3 for indoor, and 1.4 ug/m3 for outdoor. The accuracy of the PM measurements was investigated by comparing the results with a dichotomous sampler (Series 244, made by Graseby-Anderson) that was collocated with the other samplers. Figure 10 is an example of the PEMTM (PM10 10 L/min) versus MINIVOL and Figure 11 is PEMTM (PM10 10 L/min) versus dichotomous sampler. The figures shows excellent agreement between the different PM samplers used in the study. Similar results were found for the various flow rates and PM cut sizes and is provided in Appendix B. Figure 10: Comparisons between MINIVOL and PEMTM (with a flow rate of 10 L/min) for PM10 Measurements PM 10 40 MINIVOL PM 10 / µ g/m 3 35 30 25 1 :1 lin e 20 y = 0.9326x + 0.0218 15 R 2 = 0 .96 6 10 5 0 0 5 10 15 PEM TM 20 P M 10 25 / µ g /m 27 3 30 35 40 Methods Report Figure 11: Comparisons between PEMTM and Dichotomous Samplers (with a flow rate of 10 L/min) for PM10 Measurements PM10 40 30 µ g/m 3 25 1:1 line 20 15 PEM TM PM 10 (10 L/min) / 35 y = 1.1645x - 4.5698 10 R 2 = 0.9755 5 0 0 5 10 15 20 Dichotomous PM 25 10 30 / µ g /m 35 40 3 The measurement precision with MINIVOL and PEMTM samplers, expressed as the percentage relative standard deviation (%RSD), is presented in Figure 12. As shown in the figure, the precision of the samplers depends on the PM concentration. At PM concentrations of 15 ug/m3 the precision at the 95% confidence level was within ±1.5 µg/m 3 (10%) for the PEMs samplers and ±3.0 µg/m 3 (20%) for the MINIVOL samplers. As expected, near and below the detection limit, the precision declines rapidly (%RSD increases). The particulate matter was analyzed to determine the concentrations of 36 elements. The collected particulate matter was extracted with a mixture of nitric and hydrofluoric acids in a closed vessel under constant temperature and the metal concentrations were determined with ICP-MS (Perkin-Elmer Elan 5000). The list of elements with the detection limits achieved during the main study is show in Table 8. The detection limits were based on three times the standard deviations of the blank samples taken during the study. The detection limits of the elements in terms of air concentrations for a one day sampling can be obtained by dividing the limit per filter in Table 8 by the volume of air sampled (i.e., 5.7 m3 for personal samples, 7.2 m3 for indoor samples and 14.4 m3 for outdoor samples). The table also shows the percentage of the samples taken that were above the detection limit. While the majority of the measures for most elements were above the detection limits there were some elements that were not in the detectable range due to a combination of high background concentrations or low levels in the samples collected. 28 Methods Report Figure 12: Precision of PM Mass Concentration Measurement as a Function of PM Mass Concentrations 110 (b) % RSD of PM Mass Concentrations 100 90 80 70 MINIVOL 60 y = 146.41x-1.0262 R2 = 0.6976 50 40 PEMTM y = 39.818x-0.774 R2 = 0.7775 30 20 10 0 0 5 10 15 20 25 30 3 PM Mass Concentration / µg/m MINIVOL PM2.5 PEM PM10 MINIVOL PM10 Power (MINIVol) 35 PEM PM2.5 Power (PEM) 29 40 Methods Report Table 8: Detection Limits of Elemental Concentrations in PM Element Average of blanks ng Stdev of blanks ng Detection Limit ng/filter AG AL AS B BA BE BI CA CD CL CO CR CU FE HG K LI MG MN MO NA NI P PB S SB SE SI SN SR TH TI TL U V 0.023 131 -0.23 2.6 2.5 -0.12 0.031 603 0.20 1100 0.51 37 14 146 0.0014 4.1 -0.15 56 2.0 0.15 138 2.8 9.5 1.1 -716 0.09 -0.31 -146 0.76 1.0 0.004 7.0 -0.022 0.0014 0.20 0.031 62 0.32 3.6 1.7 0.36 0.024 315 0.11 748 0.59 14 5 70 0.176 238 0.52 20 1.5 0.10 61 1.4 50 0.61 2683 0.08 1.14 1859 0.66 0.46 0.017 3.6 0.033 0.0078 0.14 0.092 187 0.95 10.8 5.1 1.1 0.071 945 0.32 2244 1.8 41 15 211 0.528 713 1.55 61 4.6 0.29 184 4.3 151 1.83 8049 0.24 3.4 5578 2.0 1.39 0.051 10.8 0.098 0.0233 0.41 30 Fraction of Samples Detectable PM2.5 PM10 54% 88% 81% 84% 86% 10% 69% 60% 78% 10% 33% 16% 54% 86% 15% 50% 19% 92% 97% 80% 69% 62% 12% 95% 21% 91% 15% 12% 60% 88% 60% 88% 32% 57% 89% 75% 99% 92% 92% 98% 15% 85% 91% 85% 24% 55% 26% 81% 99% 29% 82% 59% 99% 99% 89% 95% 84% 62% 99% 19% 97% 21% 65% 78% 98% 91% 99% 58% 88% 99% Methods Report 2.2.1 Particulate Sampling Protocol In the Field: 1. The assembled sampling heads and filters are shipped in sealed plastic bags that are placed inside a cooler. 2. Prior to sampling, turn all active sampling equipment on and run for approximately 30 minutes to ensure that a stable flow is established. 3. There should be one removable label on the back (personal/outdoor) or on the side (indoor) of the particulate head that corresponds to the fixed label. Ensure that these labels are identical before removing the appropriate label and placing it on the particulate field data log sheet. 4. To begin sampling, attach the particulate head/filter to the vacuum source and record the counter time displayed on the device. 5. Make a continuous connection between the particulate head/filter and the calibration device (i.e., DryCal) by using the appropriate attachments provided. You may be required to remove a protection cap if using an indoor particulate head. 6. Start the DryCal and adjust the flow rate of the active sampling device until the DryCal reading is within the desirable range of the target flow rate. Take at least ten continuous readings during which the rate of airflow remains relatively constant and within the target flow rate. Record the average after ten consecutive readings, which is shown on the DryCal display. 7. Detach the calibration attachment and replace protection cap if using an indoor particulate head. 8. The following should also be recorded on the particulate field data log sheet: participant ID, date and time (military) of sample initiation, and relevant comments as deemed necessary. 9. If using a personal sampling pump, affix the pump and particulate head to the subject in the individuals breathing zone (just below their lapel). Alternatively, affix appropriate rain shields or protection caps and leave in a stationary location inside or outside the home. 10. After the sampling period has ended affix the calibration device to the particulate head/filter and determine the end flow rate by taking the average of ten consecutive readings during which the rate is relatively stable. Record the end flow rate and the end counter time in on the field data once the device has been turned off. 11. Detach the particulate head/filter, ensuring to keep the intake portion of the device in an upright position. Wrap the filter in the plastic bags provided and carefully place the exposed head/filter into the cooler to be returned to the laboratory for analysis. Check for arrows on shipping containers that indicate which way the boxes should be positioned and ensure that shipping staff are aware that boxes must not be inverted and should be handled with care. 12. Samples are shipped to a central location, unloaded, cleaned, and reloaded for further sampling. 31 Methods Report 2.3 Electron Microscopy 2.3.1 Materials and Methods The filter samples were taken by the project field teams between July 16, 1998 and November 4, 1998. Particle filters were collected from three locations: (1) outdoor (n = 12), (2) indoor (n = 12), and (3) personal (n = 12). In addition, two sized cut-off points were made, one at PM2.5, another at PM10. The Marple PEM or “Personal Exposure Monitor” was first recommended by Petros Koutrakis from Harvard University. Follow-up conversations with Steve Ferguson from the School of Public Health at Harvard eventually led us to the Research Triangle Institute where they are currently administering an extensive sampling program for PM10 and PM2.5 in Toronto, Ontario. A considerable amount of documentation was shared with us and provided an outline of the necessary quality control protocol required with the Marple PEMs. After reviewing these reports, a final decision was made to pursue this sampling method for the Oil Sands Pilot study. 2.3.2 Sample Preparation Filters were handled gently to avoid displacement of particles. A proportion of each filter was taken for x-ray microanalysis, another portion for morphology, and the rest held in reserve. For scanning electron microscopy, the samples were coated with gold/paladium in a sputter coater and mounted on aluminum stubs prior to examination in the scanning electron microscope. Samples for x-ray microanalysis were sputter coated with vaporized carbon, mounted on carbon-based stubs and examined in the scanning electron microscope. 2.3.3 Scanning Electron Microscopy The majority of the analyses were performed on a Hitachi S400 scanning electron microscope equipped with a back-scattered electron detector, Kevex x-ray detector and Tracor Northern x-ray analytical system. As the x-ray detector at the University of Calgary does not detect light elements (carbon, oxygen, nitrogen), selected samples were also examined on a Leo S360 scanning electron microscope with a Kevex delta 4 quantum light element detector x-ray detector and analyzer run by John McGovern and Associates in northeast Calgary. 2.3.4 Particle Characterization Particles on the filters were characterized by morphology and elemental composition. Morphology was primarily determined in the secondary electron mode of the scanning electron microscope. In this mode it was easy to differentiate organic particles (such as moulds, spores, carpet fibres) by their characteristic appearance. Differentiation of carbon-based organic particles from mineral particles and metals was further aided by the use of back-scattered electron imaging. This mode of examination enables differentiation of particles by atomic number contrast. Particles of high average atomic number (for example mineral dust particles and metals) appear brighter in this imaging mode than particles with a predominantly organic composition (for example a pollen grain). X-ray microanalysis was performed on 100 randomly selected mineral and metal particles. These particles were then characterized according to their net fractional x-ray counts for selected elements. The elements chosen for this semi-quantitative analysis were sodium, magnesium, aluminum, silicon, potassium, calcium, titanium, iron, chromium, and manganese. This profile was chosen to correspond with previously reported data.59 Elements that fell 32 Methods Report outside this grouping were also noted. The ratios of the x-rays for each of the elements for a given particle were then classified into 17 categories shown in Table 9. This characterization allows classification into broad mineral groups, however it is not intended to provide exact mineralogical identification. This would require selected area electron diffraction (for individual particles) or x-ray diffraction (for bulk samples). The results, therefore, are intended to be a guide to the types of mineral classes that may be present in these samples. Table 9: Non-Fibrous Particle Classification Scheme Group Elements Percent elemental composition Na Mg Al Si K Ca Ti Fe Cr Mn Examples 1 Al, Si <1 <10 10-55 40-90 <4 <4 <1 <4 * * Kaolinite, etc. 2 Al, Si, K <1 <10 10-40 25-75 4-25 <4 <1 <1 * * Alkali feldspar, illite, etc. 3 Al, Si, Fe <1 <10 10-40 25-75 <4 <4 <1 4-49.9 * * Bentonite, ferrogedrite, etc. 4 Al, Si, K, Fe <1 <10 10-40 25-75 4-25 <4 <4 >1 * * Mica, muscovite, etc. 5 Al, Si, Na >1 <10 10-40 25-75 <4 <4 <1 <4 * * Albite feldspar 6 Al, Si, Mg (Fe) <1 1030 10-40 25-75 <4 <4 <1 <30 * * Chlorite, etc. 7 Al, Si, Ti, Fe, K (Mg) <1 <10 10-40 25-75 1-20 <4 1-10 >1 * * Biotite, etc. 8 Al, Si, Ca (Na, Fe, Mg) * * 10-40 25-75 <4 4-49.9 <1 * * * Plagiocase feldspar, smectite, hornblende, etc. 9 Al, Si, x * * 10-40 25-75 * * * * * * Other al. silicates 10 Si * * * >85 * * * * * * Silica 11 Si rich * <10 <10 50-85 * * * * * * ------- 12 Mg, Si, (Fe) <1 1050 <6 45<90 <4 <4 <4 * * * Talc, etc. 13 Ti rich * * * * * * 50-100 * * * Rutile, etc. 14 Fe rich * * * * * * * 50-100 * * Pyrite, goethite, marcasite, etc. 15 Al rich * * 50-100 <40 * * * * * * ------- 16 Ca rich * * * * * 50-100 * * * * Misc. 17 Gypsum, calcite, dolomite, anhydrite, etc. Misc. Note: (1) Elements in brackets ( ) may or may not be present within that group. (2) * This element is not considered if the specified criteria is met. (3) All particles that do not meet the requirements for any of the first 16 categories are placed in the miscellaneous class. (4) Groups 15 and 16 were assigned to miscellaneous for data analysis. 2.3.5 Data management and statistical analysis Data were entered into an Excel file and analyzed by analysis of variance. Primary analyses were made to determine differences in elemental composition of particles for the three types of sample (personal, indoor and outdoor). Secondary analyses were performed to look for differences between PM10 and PM2.5 samples. 33 Methods Report 2.4 Modifications and Additions to Sampler Protocol To improve data collection methods and address quality control issues, certain changes were made to the protocols and procedures of the main study. 2.4.1 Passive Sampler Protocol Changes § As the study progressed, the field coordinator developed a more efficient means to transport samplers to and from the laboratory, increase the circulation rate of the samplers, and facilitate proper deployment and retrieval of the samplers by the field staff. The shipments of samplers were carefully managed to decrease the time that samplers were held in storage. This was necessary in order to minimize the possibility of background exposure of the samplers. Receiving procedures included checking each sampler identification label with the shipment log sheets as well as the field staff ensuring that each sampler was returned to its original container. Finally, prior to shipment back to the laboratory, the field coordinator reviewed and signed off the log sheets and kept a record of which samplers were being returned to the laboratory for analysis. § The resealing technique of the nitrogen dioxide, sulphur dioxide, and ozone containers was modified in September 1997. During the pilot study and early stages of the main study, the samplers were resealed using plastic wrap and elastics. Not only was this method cumbersome for the field workers, but it was decided that using parafilm as a sealant would act as a more efficient barrier from unwanted airflow. Upon receiving and prior to shipping, each sampler was visually inspected for proper sealing by the laboratory and field staff. § During the initial stages of the main study, some of the nitrogen dioxide and sulphur dioxide samplers had dark spots on the Teflon membranes. The laboratory was contacted regarding this and the problem was rectified. § In the event of damaged or missing passive samplers, a spare set of samplers traveled with the field staff. These extra samplers were rotated by the field coordinator to minimize background exposure to the monitors. 2.4.2 Particulate Protocol Changes § The personal particulate pump batteries were confirmed to run continuously for more than a 72-hour (3-day) period, but to help decrease the possibility of battery failure during sampling, the batteries were exchanged every 48-hours (2-days). For the same reason, the indoor particulate Minivol units were plugged directly into an electrical outlet and were equipped with back-up batteries in case of a power failure. § During the initial months it was detected that there was a problem with the resulting weights of the particulate filters. It was discovered that vapours from the lubricant applied to the impaction surface of the particulate head were migrating to the Teflon filters and increasing the analytical weight of the filters. To alleviate this problem, in October 1997, an alternative lubricant was used and all particulate filters were shipped and stored in a cool environment. § After some initial problems with flow rates for some of the indoor particulate filters, all filters were checked for possible cross-threading and corrected before deploying. § In February 1998, a new method of calibration for the particulate airflow was utilized. The old process of using the Gilabrator bubble flow meter by Gillian was found to be awkward for the field staff and the cold temperatures often froze the liquid solution. After some validation tests, the old 34 Methods Report process was replaced by a more accurate and efficient calibration method using a Drycal DC-lite by Bios International. § To avoid additional weight and crowding of air samplers in the participants’ breathing zone, personal particulate blanks were often set on top of the indoor particulate units. The indoor and outdoor blanks were secured by an elastic band to the back of the active samplers. Following a request from the laboratory, as of January 1998, all particulate blanks were left in their packaging when deployed. 2.5 Water Sampling 2.5.1 Sample Collection Following a defined protocol, two water samples were collected from the kitchen tap or, in cases where treatment was present, at a tap location which bypassed treatment. All samples were collected after running the water for three to five minutes. A routine chemical water sample was collected in a 500 mL PET500 (polyethylene terephalate) trace metal free sample bottle. This bottle was properly labelled for Routine Chemical analysis with a unique sample ID NO from the Request for Chemical Analysis form. A water sample for trace metal analysis was collected in a separate 500 mL PET500. After 500 mL of water was collected this sample was preserved with 5 mL of trace metal free Nitric Acid, 70% (Eagle Picher 5 mL ampule - NA-6166-1EP2). This bottle was properly labelled for Trace Metal analysis with another unique sample ID NO from a separate Request for Chemical Analysis form. Both samples were shipped to the Trace Element/Environmental Toxicology Laboratory at the University of Alberta Hospital, Edmonton. 2.5.2 Routine Chemical Analysis The samples were thoroughly mixed prior to aliquots being taken for the routine analyses protocols. All chemical parameters were performed using modified American Public Health Association (APHA) Standard Methods for the Examination of Water and Wastewater protocols. Conductivity, pH and fluoride concentrations were determined using Radiometer conductivity/ specific ion electrodes employing a Radiometer VIT90 autotitrator system equipped with a 40 sample SAC90 auto-sampler, a CDM 80 conductivity meter, and a ABU93 25 mL triburette (for the TISAB delivery). All cation analyses were performed using air/acetylene flame atomic absorption spectroscopy protocols on a Perkin Elmer Z5000 Flame Atomic Absorption Spectrophotometer equipped with a flow spoiler burner chamber and an AS40 auto-sampler. Samples aliquoted for sodium, potassium, calcium, and magnesium analysis contained a final concentration of 0.24N HCl and 2% La (as LaNO3) to eliminate interferences from varying concentrations of carbonate, bicarbonate, and sulphate. Samples aliquoted for iron analysis were acidified with concentrated trace metal free HNO3 to a final concentration of 1% HNO3 to dissolve any precipitated iron. The anion quantitations were performed on a Roche COBAS FARA II autoanalyzer for chloride (ferricyanide method), nitrate+nitrite nitrogen (hydrazine reduction method), sulphate (turbidimetric method) and alkalinity (autotitration method). Samples with pHs > 8.3 were manually titrated employing a pH meter to a pH of 8.3 to assist in the proper calculation of carbonate, bicarbonate, hydroxide concentrations. Total Dissolved Solids and ion balances were calculated from the analytical results. 35 Methods Report 2.5.3 Trace Metal Analysis Samples were stored at 4º C prior to analysis. Samples and standards were prepared in a trace metal free (TMF), positive pressure, hepafiltered room employing Eppendorff pipettes/ tips and SARSTEDTR polypropylene sample tubes. SPEXR Certified Ultra-pure single element standards were employed for the preparation of all mixed aqueous calibration standards, internal standards and quality control samples. All standards were prepared by weight in TMF Nalgene low density polyethylene bottles, acidified with TMF HNO3 acid and diluted to appropriate weight with Barnstead 18 Megohm-cm TMF water. SEASTARR TMF HNO3 acid was used throughout. The analyses were conducted in a separate TMF, positive pressure, hepafiltered room employing a PESCIEX Elan 6000 Inductively Coupled Plasma - Mass Spectrometer (ICP-MS) operating in the quantitative mode with internal standardization. All samples contained a mixed internal standard consisting of 45Sc, 89Y, 103Rh, and 181Ta. The total recoverable metal by direct analysis for 23 trace metals was performed using a modified Ontario Ministry of Environment DWATER protocol (Determination of Trace Metals in potable waters by ICP-MS). The ICP-MS method employed was consistent with the principles outlined for Total Recoverable Analyte by Direct Analysis of an unfiltered acid preserved drinking water sample employing ICP-MS in the US-EPA Method 200.8, Revision 5.4, 1994 protocol (Determination of Trace Elements in Waters and Wastes by Inductively Coupled Plasma - Mass Spectrometry). 2.5.4 Internal/External Quality Assurance Protocols All routine chemistry and trace metal analytical procedures adhered to stringent in-house QC protocols employing standards and QC samples traceable to international standard reference materials. The analytical protocol typically consisted of 15-25% QC samples/unknowns. In addition, the accuracy and precision of the trace metal analyses was concurrently further monitored employing the National Institute of Standards & Technology Standard Reference Material for Trace Elements on Water (NIST SRM 1643d) employed as additional QC samples. Typical RSDs for the routine analytes were between 0.2-4% and for the trace metals RSDs were between 1-3%. All analyzed NIST SRM 1643d samples were within acceptable certified values. Further validation of the data quality was ensured by successfully participation in two external Interlaboratory Proficiency Testing (PT) programs for all the parameters in this study. The first PT program was the bi-annual Alberta Water Analysts Committee PT program (25-35 Alberta water laboratories) and the second was the Analytical Product Groups (APG) Proficiency Environmental Testing Program (>250 North American laboratories) on a quarterly basis. Both PT programs meet the stringent International Standards Organization (ISO) Guide 43, Part I, 1996 Proficiency Testing Program protocols employing z-scores for performance evaluations. The APG program, the largest PT provider of water samples in North America, is ISO 9002 certified and they are currently seeking accreditation under the new US EPA/NIST National Standards for Water Proficiency Testing Program, which they helped develop. 36 Methods Report 2.6 Biological Markers of Exposure 2.6.1 Nicotine and BTEX Compounds Mandelic acid, hippuric acid, and the isomers 2-, 3-, and 4-methylhippuric acid are quantified in urine using liquid chromatography (LC) without prior extraction of the specimens. Internal standard was added to a 1 mL aliquot of the specimen and then the urine is analyzed on the LC. To determine muconic acid content, 0.5mL of urine specimen was used. After adding internal standard, the pH of the urine was adjusted to be 1-2, with 1N hydrochloric acid and saturated potassium hydrogen tartrate. Muconic acid was extracted into an organic solvent (diethyl ether), derivatized with BSTFA (1% TMCS), and the derivatized extract injected onto a gas chromatogram/mass spectrometer (GC/MS). Nicotine in serum was quantitated by GC/MS. As an internal standard, 1 mL of serum was fortified with nicotine-d4. The serum was alkalinized with 5M potassium hydroxide and sodium chloride was added. Nicotine was extracted into an organic solvent (ethyl acetate). The extract was concentrated under a stream of nitrogen at 40°C and the extract was injected onto a GC/MS. For each batch of samples, a set of calibration standards and two quality control specimens were analyzed. The concentration of the analyte in the sample was calculated against the calibration curve. 2.6.2 Arsenic Blood Samples Two samples of blood were obtained using gold-cap 4mL serum collection tubes. These vacuum tubes contain gel and clot activator, which help to separate serum. Samples were set aside for 30-60 minutes (maximum) to allow for clotting, then centrifuged and poured (or transferred with a clear plastic pipette) into a metal-free polypropylene plastic screw-cap vial (8mL Sarstedt #60.542 or equivalent). Both serum and blood cells remaining in gold-top vials were stored at 4°C and shipped on refrigerated coolant, twice weekly (Monday and Thursday). Speciation analysis of arsenic in blood Speciation analysis of arsenic in serum was carried out using the same methodology as for urine. From a total of 131 serum samples, only 4 samples had detectable arsenic concentration. The rest of serum samples had arsenic below detection limit. This is consistent with the literature: arsenic in the body has very short half time (1-4 hours depending on arsenic species). Speciation analysis of arsenic in blood serum is less useful than that in urine. Urine Samples Laboratory technicians were required to pour a 50 mL aliquot into a chemical-free tube such as the Fisherbrand disposable sterile centrifuge tubes with plug seal cap, made of modified polystyrene (50 mL Catalog No. 05-539-10). No preservatives were added. Samples were stored at 4°C and shipped on refrigerated coolant, twice weekly (Monday and Thursday). Urine samples were kept either at 4oC (if analyzed within 48 h) or -20oC (if kept for longer-term storage). No preservative was added to the samples. After filtration through a 0.45 µm nylon membrane, the sample was subjected to high performance liquid chromatography with hydride generation atomic fluorescence spectrometry analysis (HPLC/HGAFS). 37 Methods Report Speciation of arsenic in urine Arsenic compounds were speciated by high performance liquid chromatography (HPLC) with hydride generation atomic fluorescence detection (HGAFD). Detailed methodology has been previously described.60, 61 The HPLC system consisted of a Gilson (Middletone, WI) HPLC pump (Model 307) and a Rheodyne 6-port sample injector (Model 7725i) with a 20-µl sample loop. A reversed phase C18 column (ODS-3, 150 mm x 4.6 mm, 3-µm particle size. Phenomenex, Torrance, CA) was used for separation. A solution (pH 5.8) containing 5 mM tetrabutylammonium hydroxide (Aldrich), 4 mM malonic acid (Aldrich), and 5% methanol (Fisher), was used as the HPLC mobile phase. The column was mounted inside a column heater (Model CH-30, Eppendorf) and the temperature was maintained at 50 oC. Isocratic HPLC operation was performed under 1.5 mL/min flow rate. A hydride generation atomic fluorescence detector (HGAFD) (Model Excalibur 10.003, P.S. Analytical, Kent, UK) was used for the detection of arsenic. The combination of HPLC and HGAFD has been described previously.62 Briefly, continuous flows of hydrochloric acid and sodium borohydride, introduced by using a peristaltic pump, meet directly with effluent from the HPLC column at two Tjoints. Hydride generation takes place when the three solutions are mixed. Optimum concentrations of hydrochloric acid and sodium borohydride were found to be 1.2 M and 1.3%, respectively. Hydride generated from the reaction is separated from liquid waste in a gas/liquid separator apparatus and carried by a continuous flow of argon carrier gas to the atomic fluorescence detector. A Pentium computer with Varian (Victoria, Australia) Star Workstation software and ADC board was used to acquire and process signals from the atomic fluorescence detector. Samples (urine or serum) were filtered through a 0.45 µm membrane filter. An aliquot (20 µl) of the filtered sample was injected onto the HPLC column for arsenic speciation analysis. No other sample treatment was applied. Deionized water from a Maxima ultra-pure water system (Elga) was used for the preparation and dilution of all reagents and standards. Standard solutions of arsenite [As(III)], arsenate [As(V)], monomethylarsonic acid (MMAA) and dimethylarsinic acid (DMAA) were prepared by appropriate dilution with deionized water from 1000 mg/L stock solutions, as described previously.63, 64 Standard solutions containing above 1 µg As/mL were stable for several months. Standard solutions containing less than 10 ng As/mL were prepared fresh daily by serial dilution with deionized water from 1 µg As/mL arsenic standard solutions. The arsenic standards were used for chromatographic peak identification and for calibration and quantitation. A Standard Reference Material, Toxic Metals in Freeze-Dried Urine SRM 2670, from National Institute of Standards and Technology (NIST, Gaithersburg, MD) was used for method validation. The certified value, provided by NIST, for total arsenic concentration is 480 + 100 ng/mL in urine containing elevated levels of toxic metals. In urine containing normal levels of toxic metals, the concentration of arsenic is not certified and a reference value of 60 ng/mL has been provided by NIST. Results from analyses of these standard reference materials using the present method agree well with the certified and reference values.65 Creatinine in urine samples was determined by using HPLC with UV/Vis absorption spectrophotometric detection, as described previously.66, 67 Urine samples were diluted 50 times with deionized water and a 10 µl aliquot was injected onto a C18 column (Bondclone C18, 3.9 x 300 mm, Phenomenex, Torrance, CA). Sodium acetate (50 mM, pH 6.5) in 98:2 (v/v) water: acetonitrile was used as the mobile phase with a flow rate of 1.0 mL/min. A system consisting of a Dionex (Sunnyvale, CA) Gradient Pump DX300, 38 Methods Report Waters 712 WISP Autosampler, and Waters 484 Tunable Absorbance Detector was used. Absorbance at 254nm was measured and peak area was used for the quantitation of creatinine. All 144 urine samples were analyzed for three times using the HPLC/HGAFD method. Results were reported as mean +1 standard deviation from triplicate analyses of each sample. Concentration below detection limit of 0.5 ng/mL (for As(III) and MMAA) and 1 ng/mL (for As(V) and DMAA) were reported as not detected (n.d.). Figure 13 shows a typical chromatogram obtained from the analysis of 4 arsenic species in deionized water. It shows that the four common arsenic species are well separated. The retention time is a characteristic for each species and peak intensity is a function of the concentration of the species present in the sample. Figure 13 Chromatogram Showing the Separation of Four Arsenic Species. As(III), inorganic arsenite As(V), inorganic arsenate MMAA, monomethylarsonic acid DMAA, dimethylarsinic acid Figure 14 shows chromatograms from three urine samples analyzed for arsenic species. These samples were from the general population participating in the study. Differences in speciation patterns as observed here are common, and may reflect inter-individual variability with respect to the metabolism of arsenic compounds. 39 Methods Report Figure 14: Typical Chromatograms Showing the Speciation of Arsenic in Three Urine Samples Abbreviations: As(III): inorganic arsenite As(V): inorganic arsenate DMAA: dimethylarsinic acid MMAA: monomethylarsonic acid HPLC: high performance liquid chromatography HGAFS: hydride generation atomic fluorescence spectrometry 40 Methods Report 3.0 Health Assessment Methods and Protocols 3.1 Biological Markers of Effect 3.1.1 Autoantibodies Immunofluorescence microscopy utilizing tissue culture cells as the antigen substrate is the standard method for detecting autoantibodies. Test sera are incubated on the wells containing the cells. After washing away excess serum, the antibody binding to intracellular antigens is detected by a fluorescentlabeled antibody to human immunoglobulin (IgG). All testing was performed at the Advanced Diagnostics Laboratory, University of Calgary. Commercially obtained Hep-2000 slides (Immuno Concepts, Sacramento, CA) were used as substrate. Test serum samples were diluted to 1:40, 1:160 and 1:640 in phosphate buffered saline (PBS), and incubated on the slide wells for 30 minutes at room temperature. Slides were then washed in two changes of PBS for 10 minutes. Fluorescein-tagged goat antibody to human IgG, (Immuno Concepts, Sacramento, CA) was then added to the wells, and the slides were incubated for 30 minutes in a dark humidified chamber at room temperature. The washes in PBS were repeated, the slides were cover-slipped, and then stored at 4°C until read using a Leitz microscope fitted with UV fluorescence. Fluorescence intensity was graded by one observer, as 0 or 1+ to 4+ using standard controls on each slide. The cutoff for a positive value was 1+ intensity at a dilution of 1:80; a result recorded as “low titer” indicates that the sample had intensity of 1+ at the 1:40 dilution. Serum samples demonstrating >1+ fluorescence intensity at 1:640 were titrated to end-point. The primary observer (LJS) was trained in techniques and interpretation by the technician (AF) who performs this test for the diagnostic lab, and has done so for approximately 10 years. Prior to the study, inter-rater reliability was assessed and found to be 94-98%. During the study, a second reader (AF) read a few slides, and again inter-rater reliability with the primary observer (LJS) was >95%. 3.1.2 Lung Function Pulmonary function tests generate quantifiable assessments of respiratory status. The most widely used such test is the spirometric examination. Spirometry measures the volume of air inhaled and exhaled from a subject’s lungs as a function of time during clearly defined breathing maneuvers (note: for the present study, only expiratory volumes and flow rates were recorded).1 Critical inspection of the graphic records or spirograms produced can indicate changes in functional condition, disease state, and morbidity. Spirometry has become an integral part of medical screening, surveillance, and monitoring strategies.2 Thus, as an indicator of general respiratory health, it is often a fundamental tool employed in pulmonary epidemiologic studies addressing public health concerns. Effort-dependent, forced expiratory spirometric examinations include multiple trials per testing session. Initial analysis of these collected tracings requires identification of the best test curves based on a clearly defined set of standards established by the American Thoracic Society. Table 10 provides a detailed summary of the ATS acceptability and reproducibility criteria employed in the data selection process. Because these curves then constitute the data set for all further evaluations, stringent adherence to ATS protocol, ensuring both validity and optimal quality, is crucial. 41 Methods Report Table 10: Criteria for Spirometric Tests Acceptability Criteria A test is considered acceptable if: § The participant performs a satisfactory start, free of excessive hesitation. § The extrapolated volume, derived from the start of the volume-time curve, is less than 5% of the forced vital capacity (FVC) or 0.15 L, whichever is greater. § Maximal expiratory and inspiratory efforts are demonstrated. There should be at least a 1-second observed volume plateau at maximal expiration. § No variable effort is demonstrated by the participant during the maneuver. § No obstruction of the spirometer mouthpiece occurs. § No volume loss from a leak in the spirometer occurs. § No coughing occurs during the spirometric maneuver. Reproducibility Criteria After establishing the acceptability of at least two tests, reproducibility is demonstrated if: § The two largest FVC values are within 0.2 L or 5% of each other, whichever is greater § The two largest FEV1 values are within 0.2 L or 5% of each other, whichever is greater Data-reporting Criteria § If the above conditions are not met, the test session should be rejected. Participants involved in the Alberta Oil Sands respiratory health assessment performed spirometry over a consecutive five-day testing period using a standard pneumotach spirometer connected to a portable computer. After each spirometry session, the graphic output was stored and/or printed to facilitate visual interpretation. All subsequent spirometric test evaluations were completed following ATS guidelines (refer to Table 10.). Test sessions not complying with these guidelines were rejected. A log book, manually compiled at the time of testing was referenced in order to determine completeness of the data provided on disks. It was presumed that noted discrepancies were a result of technical difficulties. 3.1.3 Immunoglobulin gamma E Blood sera was obtained from 242 participants, 214 from Fort McMurray and 28 from Lethbridge. Total IgE was quantitated using the Pharmacia & Upjohn Fluoroenzyme-immunoassay Phadiotop7 FEIA screen. The lowest detectable limit was 2 kU/L. Samples that tested positive for the Phadiotope screen were tested for IgE, specifically for the following common inhalant allergens: D. pteronyssinus (housedust mite), cat dander, dog dander, Hollister-Stier (housedust mix), Cladosporium Herbarum (mold), Alternaria Tenuis (mold), dandelion pollen, birch tree pollen, wild grass rye pollen, and Timothy grass pollen. 3.1.4 Neurocognitive Function (NES2) The NES2 is a computerized test that assesses a number of basic neurological and cognitive parameters, as detailed below, providing a non-invasive means of evaluating associations between exposure and effects on measures of neurocognitive functioning. The existence of an exposure-response relationship would suggest a potential causal effect, linking the agent of interest and the central nervous system (CNS) outcomes assessed. In addition, neuropsychological assessment provides the possibility of estimating the 42 Methods Report magnitude of effects associated with a given level of exposure, thereby contributing to the risk assessment of the agent. Finger Tapping Participants were required to press a button with the index finger of their preferred, nonpreferred, and alternating hand as often as possible in four 30-sec. trials. Summary measures were the number of taps from each trial with preferred, nonpreferred, and alternating hand. Finger tapping has been shown to be sensitive to acute and sub-acute effects of toxins68. Continuous Performance Test (CPT) The objective was to respond immediately and only when a large letter “S” was flashed on the screen. A series of letters, of which 20% were the letter “S”, were randomly and briefly (for about 50-msec.) flashed at a rate of one per second for five minutes. Individual response latencies were recorded and stored, which allowed for computation of the mean reaction time. Omission and commission errors were also recorded. Some studies have used this form of testing extensively in attempt to evaluate solvent and lead neurotoxicity69. Hand-Eye Coordination Required the subject to use a joystick to trace over a large, fixed sine- wave pattern. A cursor moved horizontally at a constant rate, while the individual controlled only the vertical motion of the cursor with the joystick. The errors the participant made, measured as the amount and frequency of deviation from the line, were recorded. Hand-eye coordination and dexterity are functions found to be disrupted in previous studies of various neurotoxic agents70. Symbol-Digit Substitution Nine symbols and nine digits were paired at the top of the monitor and the subject had to press the digit keys that corresponded to a reordered test set of the nine symbols. Six sets of nine symbol-digit pairs were displayed in succession (the first was a practice set). The pairing of the symbols with digits was varied between sets to avoid learning. The time required to complete each symbol-digit set and the number of digits incorrectly matched were recorded. A computerized version of the Symbol-Digit task has been found to be of value in automated screening of psychiatric patients71. Besides being included in the WHONCTB, the Digit-Symbol test has been found to be useful in prior epidemiological studies of individuals exposed to lead, carbon disulphide, and solvent mixtures72. Pattern Comparison Participants were presented with 25 trials of three 10 x 10 arrays of black and white squares and asked to choose the array that differed from the other two. Four out of the 100 arrays are set to differ in each trial. The mean latency of correct responses to stimuli 2 to 25 were examined. Improved performance on this test with experimental administration of dextroamphetamine and worse performance after administration of scopalomine has been observed73. Pattern Memory A single stimulus 10 x 10 black and white array was presented for a brief period and then the screen was blanked. After a very brief retention interval, three arrays were presented side-by-side. One of these was 43 Methods Report identical, while the other two patterns varied slightly. For each trial, the subject chose which of the three arrays was identical to the initial presented array. The task was repeated with different stimulus and choice patterns to a total of 15 trials. The computer recorded the number of correct and incorrect responses, and the response latency for each item. Serial Digit Learning Participants were presented a series of ten digits to be reproduced in correct serial order. The stimulus and interstimulus intervals were both 600 msec. Presentation of the same series of digits continued until the subject recalled the sequence correctly on two consecutive trials, or until eight trials had been administered. An error score was recorded by the test program. Zero points were given for a correct answer, one point was awarded for each trial with at least two-thirds of the series reproduced correctly, and two points were awarded for a series that had fewer than two-thirds of the digits correct. The value used for analysis was the sum of scores. Vocabulary Twenty-five words were presented and the subject was to select, from a set of four words, the synonym for the presented word. The number correct was recorded. This test is said to provide an index of stable CNS function and is a modification of a vocabulary subtest from the Armed Forces Qualifying Test (AFQT).74 3.1.5 Analysis of Health Records Methods for Cohort Construction, Analysis, and Case Definition Of the 42,356 residents of Fort McMurray and 90,289 residents of Lethbridge from April, 1995 to March 1998, 34,031 Fort McMurray residents and 79,379 Lethbridge residents were registered with the Alberta Health Care Insurance Plan (AHCIP) on April 1, 1995. Of these, 29,368 (86.3%) from Fort McMurray and 70,390 (88.7%) from Lethbridge, were followed for three years. Individuals who changed their residence postal code during the 3-year period were excluded from the final analysis, leaving 21,612 (73.6%) and 55,079 (78.2%) individuals for Fort McMurray and Lethbridge, respectively, by the end of the study (Figure 15). Figure 15: Results of 3-Year Follow-up of Population Cohort Start (April 1,1995) End (March 31, 1998) N = 34,031 Loss of follow-up N = 4,663 Remaining N =29,368 (86.3%) Fort McMurray Change of Residence N = 7,756 (26.4% of 29,368) Leaving N = 21,612 (73.6%) N = 79,379 Lethbridge Loss of follow-up N = 8,989 Remaining N =70,390 (88.7%) Change of Residence N = 15,311 (21.8% of 70,390) Leaving N = 55,079 (78.2%) Source: Fort McMurray Study, Population Database, April, 1995 - March, 1998 44 Methods Report A children’s cohort was also constructed from the population cohort. The criteria for inclusion in the children’s cohort were: 1. registered with the AHCIP on April 1, 1995, until March 31, 1998, 2. born after March 31, 1995, 3. permanent residents of Fort McMurray or Lethbridge between April 1, 1995 and March 31, 1998. Overall, there were 436 children in Fort McMurray and 925 children in Lethbridge who were followed for three years. Of these, 272 (62.4%) from Fort McMurray and 629 (68.0%) from Lethbridge did not change their residence address through the 3-year period. They were used for incidence estimation. All asthma cases in the children’s cohort are considered as new incident cases.75 Residential History and Mobility Status – Who Are at Risk for Potential Exposure? A valid residence address is essential for the estimation of the potential residential exposure. This issue is particularly important for the present study since the residence is an assumed exposure factor under examination. Thus, understanding the residential history of the study population becomes the first step in defining potential exposure. The population cohort was grouped into three categories: 1. those who did not report a change of the residence address through the 3-year period of observation; 2. those who reported the same residence address for any two years of the 3-year period of observation; 3. those who reported a change of the residence every year through the 3-year period of observation. In those with a complete 3-year observation of the population cohort, about 73.6% (21,612/29,368) and 78.2% (55,079/70,390) of study subjects of Fort McMurray and Lethbridge, respectively, did not report a change of the postal residence address through the 3-year period. These individuals were assumed to be ‘permanent’ residents of each study area during the study period and were used as the population at risk for health outcome estimation. Years of Observation – Who is Under the Complete Observation? The time period of observation is an important factor for risk estimation of the present study. The initial study population included individuals with a differing number of years of observation due to differences in the time of entry into the study and many other reasons. Years of observation were defined as follows: • Three years – registered with the AHCIP for all three consecutive years between April 1, 1995 and March 31, 1998. • Two years – registered with the AHCIP for only two years during the 3-year observation period. • One year – registered with the AHCIP for only one year of the 3-year observation period. Overall, 29,368 and 70,390 residents had a complete 3-year follow-up for Fort McMurray and Lethbridge, respectively. Cases and Health Outcome Measures A health outcome is defined as a specific health event of an individual, such as visiting a health care practitioner, admission into a hospital, or death from a specific cause. One person can have single or multiple health events. The following discussion is focused on the case definition for asthma and other selected diseases, using physician claims and hospital morbidity data. 45 Methods Report Definition of a Case: Selection of a case definition depends upon the purpose of a study. Similar to the process in determining the value of a test for screening, a very stringent case definition will less likely misclassify a non-case as a case, leading to a high “specificity” but a low “sensitivity”. In contrast, a less stringent case definition will lead to a high “sensitivity” but a low “specificity”. In studies of potential health impact from the environment, it is important to have a case definition that is sensitive enough that no health effect will escape the evaluation. However, a very sensitive case definition may result in false cases. Three case definitions were developed for the health effect assessment. Two factors, the frequency of the visit and the interval between the visits, appear to be important and are considered in case definitions of every disease. Percentile Distribution of Physician Visits and Hospitalization To assist in the development of case definitions, the percentile distribution of visits for selected respiratory disorders was examined. Table 11 shows the percentile distribution of the number of visits to a physician or hospitalization for respiratory disorders between April 1, 1995 and March 31, 1998. Since the number of visits is one for all percentiles less than 50%, only the distribution from percentiles 50 or above is presented. Table 11: Percentile Distribution of Visiting a Physician and Hospital for Respiratory Disorders by Diagnostic Category, April 1995 – March 1998 Category of Visit and Diagnosis Visit a Physician (PV) All Respiratory Disorders Asthma COPD Visit a Hospital (Hospitalized) All Respiratory Disorders Asthma COPD Combined PV and HV All Respiratory Disorders Asthma COPD Note: Mean 50 Percentile of the Number of Visit 75 90 95 99 Maximum 3.9 2.9 2.2 2 2 1 5 3 2 8 6 4 12 9 6 23 19 18 472 197 234 1.5 1.4 1.6 1 1 1 1 1 2 2 2 3 3 3 4 7 6 8 42 33 40 4.0 3.0 2.3 2 2 1 5 3 2 9 6 4 12 10 7 24 20 20 474 206 239 1) One visit refers to a person-day visit to a physician and/or one hospital. 2) The summary is based on the 3-year provincial data between April, 1995 and March 1998. 3) PV - Physician Visit, HV - Hospital Visit (hospitalization) During the 3-year period, about half of the ‘treated cases’ had two person-day visits to a physician for all respiratory disorders and asthma, and one person-day visits for COPD. About 25% of the treated cases had five visits for all respiratory disorders, three visits for asthma, and two visits for COPD. The frequency of hospitalization for these disorders is lower. The majority of individuals were hospitalized only once during this period. As noted, the frequency of hospitalization for COPD appears higher than for all respiratory disorders and asthma. After combining physician claims and hospitalization, the percentile distribution of visits for these disorders did not differ much from that of physician claims data alone. The 50% and 75% distribution of the visits for all three categories are the same, suggesting the importance of physician claims data in studies of respiratory disorders. 46 Methods Report Asthma (ICD-9-CM = 493) Asthma is a reversible airway obstruction that is characterized by hyperirritability and inflammation of the airways. It involves 7-10% of adults and 10-15% of children.76 Asthma is traditionally divided into two forms:77 1. An allergic form – It is responsible for most of childhood asthma and is immunologically medicated due to type I hypersensitivity to inhaled antigens. 2. An intrinsic form – It occurs in adults and shows no evidence of immediate hypersensitivity to specific antigens. Three case definitions for asthma were developed as shown in Table 12. Table 12: Case Definitions for Asthma Case Description Frequency of Visit Over 3 Years Interval Between the 1st and Last Visits Probable Case – Stringent Three or more 60 days or more Two or more 30 days or more Likely Case – Moderate OR Visited a Physician and was hospitalized The same or different days Possible Case – Less Stringent One visit or more N/A Chronic Obstructive Pulmonary Disease (COPD: ICD-9-CM = 490-492, 494, 496) COPD is a common disorder (11-13%)78 and is usually characterized by progressive obstruction to airflow and a history of inhalation of irritants (i.e., tobacco smoke). It includes several disease entities, such as chronic bronchitis and emphysema, in recent publications of epidemiological studies.79, 80 Bronchiectasis (ICD9=494) and other non-classified chronic airway obstruction (ICD9=496) are also included in this group. There are two classic types of COPD:81 1. Pink puffers – having predominant emphysema and show symptoms at a relatively advanced age, such as exertional dyspnea, weight loss, and little or no cough and expectoration. 2. Blue bloaters – having predominant chronic bronchitis and, at a relatively young age, experience chronic cough and expectoration, episodic dyspnea, and weight gain. About 64% of COPD is attributed to chronic bronchitis that presents a chronic cough and sputum production for at least three consecutive months in two successive years.82 The unspecified COPD (20%) and emphysema (15%) account for the rest of COPD. Three case definitions for COPD are summarized in Table 13. 47 Methods Report Table 13: Case Definitions for COPD Case Description Frequency of Visit Over 3 Years Interval Between the 1st and Last Visits Probable Case – Stringent Three or more 91 days or more Two or more 91 days or more Likely Case – Moderate OR Visited a Physician and was hospitalized The same or different days Possible Case – Less Stringent One visit or more N/A All Respiratory Disorders (ICD-9-CM = 460-519) Respiratory disorders are the most common illness. About 37% of Albertans had a record of respiratory disorders in the 1997/98 claims file. The majority of respiratory disorders, particularly in children, are attributed to upper respiratory infections, such as common cold, sinusitis, tonsillitis, etc. Three case definitions for respiratory disorders are summarized in Table 14. Table 14: Case Definitions for Respiratory Disorders Case Description Frequency of Visit Over 3 Years Interval Between the 1st and Last Visits Probable Case – Stringent Five or more 181 days or more Three or more 91 days or more Likely Case – Moderate OR Visited a Physician and was hospitalized The same or different days Possible Case – Less Stringent One visit or more N/A Terms and Definitions Alberta Resident: An active recipient of Alberta Health Care Insurance Plan (AHCIP) who lived in Alberta at the time of the registration. Invalid Alberta Postal Code: An AHCIP recipient who has a residence location code of ‘AB’ and the first letter of the residence postal code (at the time of assessment) is not “T”, but a “space”, a number, etc. Low Socioeconomic Status (SES): An AHCIP recipient is defined as the low SES if he is (1) on family and social service or (2) receiving a full subsidy of AHCIP premiums. Registered Treaty Indians: An AHCIP registrant who has a Treaty Indians Code at the time of assessment (fiscal year end). Valid Claim: A Fee-For-Service physician claim that does not have a duplicate claim for the same service rendered to an AHCIP recipient. 48 Methods Report Single (Health Care) Visit: An AHCIP recipient has contacted a physician and/or been admitted into a hospital at least once for a given diagnosis during a day, i.e., a person-day is one visit. Definition of a single day as a basic unit of health care visit (regardless of the number of claims during the day) will eliminate artificial amplification of visits due to the fact that one person can have more than one claim for the same disease during the same day. Treated Case: An individual who accessed the health care system and has a record of diagnostic code in the physician claims and/or the hospital morbidity file. Physician: A Fee-For-Service (FFS) health care practitioner. This term is interchangeably used with the term the health care practitioner in the text. Rate of Visiting a Physician and/or a Hospital (Rate-PH): The number of visits for a specific (predefined) disease occurring during a given time period in an at-risk population. It is interpreted as the number of visits for a given disease per 100 person-years at risk. Mathematically, it is expressed as: Number of visits for disease during 3-years Rate_PH = ---------------------------------------------------------------------- X 100 Total person-years (population) at risk Period Prevalence Rate (PR_%): The proportion of the pre-defined existing cases during a given time period in the population at risk. It is interpreted as the number of cases during the 3-year study period per 100 population. One individual can be counted only once between April 1995 and March 1998. Mathematically, it is expressed as: Number of pre-defined existing cases during the 3-year period PR_% = ------------------------------------------------------------------------------- X 100 Population at risk Incidence Rate (IR): The number of new cases or events that occur in a specified time period in the population at risk. It is defined as the number of the pre-defined cases in the children’s cohort per 100 person-years (children) at risk. The permanent residents of Fort McMurray or Lethbridge who were borne after March 31, 1995 were followed up to a maximum of three years. Mathematically, it is expressed as: Number of pre-defined cases in children’s cohort IR = ------------------------------------------------------------------ X 100 Total person-years (children) at risk This rate may be interpreted as the number of new cases of asthma per 100 person-years in children. Cause-Specific Rate of Mortality (CS-Rate): The number of deaths from a specific underlying cause occurring during a given time period in population at risk. It is interpreted as the number of deaths from a specific disease during the 3-year study period per 100,000 population. Mathematically, it is expressed as: Number of deaths from a given cause of disease in a given time period CS-Rate = ----------------------------------------------------------------------------------------- X 100,000 Total person-years (population) at risk 49 Methods Report End Notes 1 Pellizzari, E. D., Thomas, K. W., Clayton, C. A., Whitmore, R. W., Shores, R. C., Zelon, H. S., & Perritt, R. L. (1992). Particle Total Exposure Assessment Methodology (PTEAM): Riverside California Pilot Study. Washington, DC: United States Environmental Protection Agency. 2 Weisel, C., Yu, R., Roy, A., & Georgopoulos, P. (1996). Biomarkers of environmental benzene exposure. Environmental Health Perspectives, 104(Suppl. 6), 1141-1146. 3 Ducos, P., Gaudin, R., Bel, J., Maire, C., Francin, J. M., Robert, A., & Wild, P. (1992). Trans, transmuconic acid, a reliable biological indicator for the detection of individual benzene exposure down to the PPM level. International Archives of Occupational and Environmental Health, 64(5), 309-313. 4 Dick, R. B. & Johnson, B. L. (1986). Human experimental studies. Neurobehavioral Toxicology, 348387. 5 Winneke, G. (1982). Acute behavioural effects of exposure to some organic solvents psychophysiological aspects. Acta Neurologica Scandinavica: Supplementum, 92, 117-29. 6 Rasmussen, K., Jeppesen, H. J., & Sabroe, S. (1993). Solvent induced chronic toxic encephalopathy. American Journal of Industrial Medicine, 23, 779-792. 7 Houck, P., Nebel, D., & Milham, S. (1992). Organic solvent encephalopathy: An old hazard revisited. American Journal of Industrial Medicine, 22, 109-115. 8 Otto, D. A. (1992). Assessment of neurobehavioral response in humans to low-level volatile organic compound sources. Annals of the New York Academy of Sciences, 641, 248-260. 9 Dick, R. B., Setzer, J. V., Wait, R., Hayden, M. B., Taylor, B. J., Tolos, B., & Futz-Anderson, V. (1984). Effects of acute exposure to toluene and methyl ethyl ketone on psychomotor performance. International Archives of Occupational and Environmental Health, 54, 91-99. 10 Larsen, F. & Leira, H. L. (1988). Organic brain syndrome and long-term exposure to toluene: A clinical psychiatric study of vocationally active printing workers. Journal of Occupational Medicine, 30, 875-878. 11 Grabski, D. A. (1961). Toluene sniffing producing cerebellar degeneration. American Journal of Psychology, 8, 461-462. 12 Linn, W. (1996). Short-term air pollution exposures and responses in L.A. area schoolchildren. Journal of Exposure Analusis and Environmental Epidemiology, 6(4), 449-472. 13 Delfino, R. (1998). Emergency room visits for respiratory illnesses in the elderly in Montreal: Association with low-level ozone exposure. Environmental Research, 76(2), 67-77 14 Borja-Aburto, V. (1998). Mortality and ambient fine particles in southwest Mexico City, 1993 - 1995. Environmental Health Perspectives, 106(12), 849-855 15 Hoek, G. (1997). Effects of ambient particulate matter and ozone on daily mortality in Rotterdam, the Netherlands. Archives of Environmental Health, 52(6), 455-463. 16 International Programme on Chemical Safety. (1993). International chemical safety cards [On-line]. Available: www.cdc.gov/niosh 17 Calderon, G. (1996). DNA strand breaks in human nasal respiratory epithelium are induced upon exposure to urban pollution. Environmental Health Perspectives, 104(2), 160-168. 18 Humerfelt, S., Gulsvik, A., Skjaeven, R., Nilssen, S., Kvale, G., Sulheim, O., Ramm, E., Eilertsen, E., & Humerfelt, S. B. (1993). Decline in FEV1 and airflow limitation related to occupational exposures in men of an urban community. European Respiratory Journal, 6, 1095-1103. 19 (Anonymous, 1998). Commentary on “Methods development for epidemiologic investigations of the health effects of prolonged ozone exposure”. In Health Effects Institute Research Report Number 81. 20 Miller, A. (1986). Pulmonary function tests in clinical and occupational lung disease. Orlando, FL: Grune & Stratton. 21 Keeney, A. H. (1976). Ocular examination: Basis and technique (2nd ed.). St. Louis, MO: Mosby. 50 Methods Report 22 Leitman, M. W. (1981). Manual for eye examination and diagnosis (2nd ed.). Oradell, NJ: Medical Economics Co., Book Division. 23 Hudnell, K. H., Otto, D. A., & House, D.E. (1996). The influence of vision on computerized neurobehavioral test scores: A proposal for improving test protocols. Neurotoxicology and Teratology, 18(4), 391-400. 24 Kalmus, H. (1965). Diagnosis and genetics of defective colour vision. New York: Pergamon Press. 25 Letz, R. (1990). The neurobehavioral evaluation system: An international effort. In B. L. Johnson, W. K. Anger, A. Durao, & C. Xnintaras (Eds.), Advances in neurobehavioral toxicology (p. 189-201). Chelsea, MI: Lewis Publishers, Inc. 26 Letz, R. (1990). The neurobehavioral evaluation system: An international effort. In B. L. Johnson, W. K. Anger, A. Durao, & C. Xnintaras (Eds.), Advances in neurobehavioral toxicology (p. 189-201). Chelsea, MI: Lewis Publishers, Inc. 27 Letz, R. (1990). The neurobehavioral evaluation system: An international effort. In B. L. Johnson, W. K. Anger, A. Durao, & C. Xnintaras (Eds.), Advances in neurobehavioral toxicology (p. 189-201). Chelsea, MI: Lewis Publishers, Inc. 28 A computerized-administered Neurobehavioral Evaluation System for occupational and environmental epidemiology,” by E. L. Baker, R. Letz, and A. Fidler, 1985, Journal of Occupational Medicine, 27(3), p. 208. 29 Letz, R. (1993). NES2 User's Manual (Version 4.6). Neurobehavioral Systems, Inc. 30 Arcia, E. & Otto, D. A. (1992). Reliability of selected tests from the neurobehavioral evaluation system. Neurotoxicology and Teratology, 14(2), 103-110. 31 Hooisma, J., Emmen, H. H., Kulig, B. M., Muijser, H., & Poortvliet, D. (1990). Factor analysis of tests from the Neurobehavioral Evaluation System and the WHO Neurobehavioral Core Test Battery. In B. L. Johnson, W. K. Anger, A. Durao, & C. Xnintaras (Eds.), Advances in neurobehavioral toxicology (p. 245255). Chelsea, MI: Lewis Publishers, Inc. 32 Letz, R. (1990). The neurobehavioral evaluation system: An international effort. In B. L. Johnson, W. K. Anger, A. Durao, & C. Xnintaras (Eds.), Advances in neurobehavioral toxicology (p. 189-201). Chelsea, MI: Lewis Publishers, Inc. 33 Letz, R. (1991). Use of computerized test batteries for quantifying neurobehavioral outcomes. Environmental Health Perspectives, 90, 195-198. 34 Letz, R. (1993). NES2 User's Manual (Version 4.6). Neurobehavioral Systems, Inc. 35 Letz, R. (1993). NES2 User's Manual (Version 4.6). Neurobehavioral Systems, Inc. 36 Wechsler, D. (1945). A standardized memory scale for clinical use. Journal of Psychology, 19, 87-95. 37 Hanninen, H., Eskelinen, L., Husman, K., & Nurminen, M. (1976). Behavioral effects of long-term exposure to a mixture of organic solvents. Scandinavian Journal of Work, Environment, & Health, 2(4), 240-255. 38 O’Donnell, W. & Reynolds, D. (1982). Neuropsychological Impairment Scale Manual. Annapolis, Maryland: Annapolis Neuropsychological Services. 39 Burney, P. G., Luczynska, C., Chinn, S., & Jarvis, D. (1994). The European community respiratory health survey. European Respiratory Journal, 7(5), 954-960. 40 Lebowitz, M. D., Quackenboss, J. J., Kollander, M., Soczek, M. L., & Colome, S. (1989). The new standard environmental inventory questionnaire for estimation of indoor concentrations. Journal of Air Pollution Control Association, 39(11), 1411-1419. 41 Block, G., Coyle, L. M., Hartman, A. M., & Scoppa, S. M. (1994). Revision of dietary analysis software for the Health Habits and History Questionnaire. American Journal of Epidemiology, 139(12), 1190-1196. 42 Health Protection Branch. (1997). The Canadian Nutrient File. Ottawa: Food Directorate. 51 Methods Report 43 Goldberg, D. (1972). The detection of psychiatric illness by questionnaire. London: Oxford University Press. 44 Ware, J. J. & Sherbourne, C. D. (1992). The MOS 36-item short-form health survey (SF-36). I. Conceptual framework and item selection. Medical Care, 30(6), 473-83. 45 Freeman, N. C. G., Waldman, J. M., & Lioy, P. J. (1991). Design and evaluation of a location and activity log used for assessing personal exposure to air pollutants. Journal of Exposure Analysis and Environmental Epidemiology, 1(3), 1991. 46 Nelson, W. C., Ott, W. R., & Robinson, J. P. (1994). National Human Activity Pattern Survey (NHAPS): Use of nationwide activity data for human exposure assessment. Government Reports Announcements & Index, 21, 1994. 47 American Thoracic Society. (1987). Standardization of spirometry -- 1987 update. American Review of Respiratory Disease, 136(5), 1285-1298. 48 Koutrakis, P., Wolfson, J. M., Bunyaviroch, A., Froehlich, S. E., Hirano, K., & Mulik, J. D. (1993). Measurement of ambient ozone using a nitrite-coated filter. Analytical Chemistry, 65(3), 209-214. 49 Harper, M., & Purnell, C. J. (1987). Diffusive sampling: A review. American Industrial Hygiene Association Journal, 48(3), 214-218. 50 Tang, H., Brassard, B., Brassard, R., & Peake, E. (1997). A new passive sampling system for monitoring SO2 in the atmosphere. Field Analytical Chemistry & Technology, 1(5), 307-314. 51 Mulik, J., Lewis, R., McClenny, W., & Williams, D. (1989). Modification of a high-efficiency passive sampler to determine nitrogen dioxide or formaldehyde in air. Analytical Chemistry, 61(2), 187-189. 52 Leaderer, B. P., Koutrakis, P., Wolfson, J., & Sullivan, J. (1994). Development and evaluation of a passive sampler to collect nitrous acid and sulfur dioxide, Journal of Exposure Analysis and Environmental Epidemiology, 4(4), 503-511. 53 Myrick, R. H. (1993). Air quality monitoring report for Alberta, 1993. Edmonton, Alberta: Environmental Protection. 54 Koutrakis, P., Wolfson, J. M., Bunyaviroch, A., Froehlich, S. E., Hirano, K., & Mulik, J. D. Measurement of ambient ozone using a nitrite-coated filter. Analytical Chemistry, 65(3), 209-214. 55 Coutant, R. W. & Scott, D. R. Applcability of passive dosimeters for ambient air monitoring of toxic organic compounds. Environmental Science & Technology, 16(7), 410-413. 56 Shields, H. C. & Weschler, C. J. (1987). Analysis of ambient concentrations of organic vapors with a passive sampler. Journal of Air Pollution Control Association, 37(9), 1039-1045. 57 Otson, R. (1990). A health & welfare Canada program to develop personal exposure monitors for airborne organics at MUG-M-3. Pittsburgh, PA: United States Environmental Protection Agency. 58 Gagner, R. (1996). Validation of a passive air sampling device for measuring ambient VOCs at subzero temperatures. Edmonton, Alberta: University of Alberta. 59 Green, F. H. Y., Yoshida, K., Fick, G., Paul, J., Hugh, A., Green, W. F. (1990). Characterization of airborne mineral dusts associated with farming activities in rural Alberta, Canada. International Archives of Occupational Environmental Health, 62, 423-430, 1990. 60 Le, X. C. & Ma, M. (1998). Short-column liquid chromatography with hydride generation atomic fluorescence detection for the speciation of arsenic. Analytical Chemistry, 70, 1926-1933. 61 Ma, M. & Le, X. C. (1998). Effect of arsenosugar ingestion on urinary arsenic speciation. Clinical Chemistry, 44, 539-550. 62 Ma, M. & Le, X. C. (1998). Effect of arsenosugar ingestion on urinary arsenic speciation. Clinical Chemistry, 44, 539-550. 63 Ma, M. & Le, X. C. (1998). Effect of arsenosugar ingestion on urinary arsenic speciation. Clinical Chemistry, 44, 539-550. 52 Methods Report 64 Feldmann, J., Lai, V. W. M., Cullen, W. R., Ma, M., Lu, X., & Le, X. C. (1999). Sample preparation and storage can change arsenic speciation in human urine. Clinical Chemistry, 45, 1988-1997. 65 Feldmann, J., Lai, V. W. M., Cullen, W. R., Ma, M., Lu, X., & Le, X. C. (1999). Sample preparation and storage can change arsenic speciation in human urine. Clinical Chemistry, 45, 1988-1997. 66 Le, X. C. & Ma, M. (1997). Speciation of arsenic compounds using ion pair chromatography with atomic spectrometry and mass spectrometry detection. Journal of Chromatography, 764, 55-64. 67 Achari, R., Mayersohn, M., & Conrad, K. A. (1983). HPLC analysis of creatinine in human plasma and urine. Journal Chromatographic Science, 21, 278-281. 68 Miller, J. M., Chaffin, D. B., & Smith, R. G. (1975). Subclinical psychomotor and neuromuscular changes in workers exposed to inorganic mercury. American Industrial Hygiene Journal, 36, 725-733. 69 Baker, E. L., Letz, R., & Fidler, A. (1985). A computer-administered neurobehavioral evaluation system for occupational and environmental epidemiology. Journal of Occupational Medicine, 27(3), 206212. 70 Hanninen, H. (1979). Psychological test methods: Sensitivity to long-term chemical exposure at work. Neurobehavioral Toxicology, 1:157-161. 71 Acker, W. (1992). A computerized approach to psychological screening: The Bexley-Maudsley automated psychological screening and the Bexley-Maudsley category sorting test. International Journal of Man-Machine Studies, 18:361-369. 72 Baker, E. L., Letz, R., & Fidler, A. (1985). A computer-administered neurobehavioral evaluation system for occupational and environmental epidemiology. Journal of Occupational Medicine, 27(3), 206212 73 Schmedtje, J. F., Oman, C., Letz, R., & Baker, E. L. (1988). Effects of scopalomine and dextroamphetamine on human performance. Aviation, Space, and Environmental Medicine, 59:407-410. 74 Baker, E. L., Letz, R., & Fidler, A. (1985). A computer-administered neurobehavioral evaluation system for occupational and environmental epidemiology: Rationale, methodology, and pilot study results. Journal of Occupational Medicine, 27(3), 206-212. 75 McDonnell, W. F., Abbey, D. E., Nishino, N., & Lebowitz, M. D. (1999). Long-term ambient ozone concentration and the incidence of asthma in nonsmoking adults: the Ahsmog Study. Environmental Research, section A 80, 110-121. 76 Downey, G., Hyland, R., Eng, K., et al. (1996). Respirology. In: Michael B. Chang and Laura J. Macnow (eds.). 1996 MCCQE: Review Notes and Lecture Series (12th ed.). Toronto: Faculty of Medicine, University of Toronto, 1996. 77 Fiel, S. B. (1994). Pulmonary Diseases. In: Allen R. Myers (Eds.), The National Medical Series for Independent Study: Medicine (2nd ed., pp.61-95). Philadelphia: Harwal Publishing. 78 Fiel, S. B. (1994). Pulmonary Diseases. In: Allen R. Myers (Eds.), The National Medical Series for Independent Study: Medicine (2nd ed., pp.61-95). Philadelphia: Harwal Publishing. 79 Schouten, J. P., Vonk, J. M., & De Graaf, A. (1996). Short term effects of air pollution on emergency hospital admissions for respiratory disease: results of the APHEA project in two major cities in The Netherlands, 1977-89. Journal of Epidemiology & Community Health, 50(Suppl. 1): S22-S29. 80 Murray, J. L. & Lopez, A. D. (1996). Global Health Statistics. Cambridge, MA: Harvard School of Public Health. 81 Fiel, S. B. (1994). Pulmonary Diseases. In: Allen R. Myers (Eds.), The National Medical Series for Independent Study: Medicine (2nd ed., pp.61-95). Philadelphia: Harwal Publishing. 82 Downey, G., Hyland, R., Eng, K., et al. (1996). Respirology. In: Michael B. Chang and Laura J. Macnow (eds.). 1996 MCCQE: Review Notes and Lecture Series (12th ed.). Toronto: Faculty of Medicine, University of Toronto, 1996. 53 Methods Report Special Thanks This report would not have been possible without the valuable contributions made by: Consultants Erik Ellehoj (Ellehoj-Redmond Consulting), Dennis Prince (Water West Consulting), and Jonathan Robb (Robb Consulting). Communications support was provided by Irwin Huberman Consulting. Management Committee The Management Committee was responsible for providing overall direction to the program to ensure that the objectives and intent of the program were carried out. The participating organizations are currently represented by: Alberta Health and Wellness Community of Fort McMurray (member at large) Fort McKay First Nation Fort McMurray Environmental Association Northern Lights Regional Health Services Suncor Energy Syncrude Canada Alexander MacKenzie Debbie White Ken Shipley Ann Dort-McLean Dalton Russell Tim Gondek Dr. Ken Nickerson Operations Committee The Operations Committee was responsible for managing the affairs of the program between meetings of the Management Committee. The Operations Committee included representatives from the following organizations: Alberta Health and Wellness Community of Fort McMurray (member at large) Northern Lights Regional Health Services Alexander MacKenzie Debbie White Patricia Pelton The Management Committee and funding partners would also like to gratefully acknowledge the contributions made by: • All volunteers in Fort McMurray and Lethbridge whose participation in the program was critical to the success of the study; • All members of the Field Study Teams who helped deploy and retrieve all of the personal exposure monitors and acted as the primary contact with the study for many of the participants; • Students Peter Inglis, Jaime Pinzon, and Tricia Lowrey from the Department of Psychology’s Internship program at the University of Alberta whose commitment and dedication to the program provided much needed support; and Yvonne Walsh and Jeff Brock who provided the ongoing supervision of field staff and managed the study office in Fort McMurray. 54 Appendix A Forms and Questionnaires Consent Form Participant ID: ______________ Date: ________/_______/_______ THE ALBERTA OIL SANDS COMMUNITY EXPOSURE AND HEALTH EFFECTS ASSESSMENT PROGRAM Participant Consent Form I understand that the Northern Lights Regional Health Authority is engaged in a study of people’s exposure to certain airborne substances. I understand that this study is being conducted in order to help measure levels of exposure to the selected substances, and is limited to the purpose stated. I further understand that the study is being conducted in co-operation with and under co-sponsorship of Alberta Health, Syncrude Canada Ltd., Suncor Inc., Fort McMurray Environmental Association, and the Fort MacKay First Nations. I do hereby freely consent to participate in this study of exposure to selected chemical compounds and substances, and agree to provide the following data: answers to questions related to environmental exposure and work and living conditions, responses to neurocognitive functioning and lung functioning tests, responses to supplementary questions about activities of interest that I have undertaken, and to questions related to my health, samples of the air that I breathe collected through the use of a personal exposure monitor (PEM), samples of the air inside and outside my home collected through the use of a fixed location, microenvironmental monitor, one sample of blood and daily samples of urine taken during the time that I am being monitored, a record of my activities and locations during the time that I am being monitored, and my personal health number. I understand and agree that: a) an agent of the study will administer the questionnaires and neurocognitive tests, and will collect the resulting information; will place the monitoring equipment in my home and will undertake all other tests referred to in this document, with the exception of collection of the blood samples; b) an agent of Alberta Health will access and compile information about health care services provided to me; c) an agent of the Northern Lights Regional Health Authority will collect the blood sample; d) Alberta Health and the Northern Lights Regional Health Authority may use any and all of the information collected from or regarding me pursuant to the study referred to herein for the purposes referred to herein, including those in the first paragraph above; e) Alberta Health, Northern Lights Regional Health Authority and the other sponsors of the study referred to herein may use and disclose the information as they choose so long as my name will not be referred to in any way when compiling or evaluating the results of the study; f) participation in this study may result in no direct benefits to me; and g) I am free to withdraw at anytime, and withdrawing from the study will not have any adverse effect on my access to health care services. It has been explained to me that there are no significant risks to me from participation in this study. I further understand that while participating in this study I will be free to ask any questions concerning the study. Participant name: _______________________________________________________________________________ (Print) (Signature) Address: ________________________________________ Personal Health Number: ______________________ Witness: ______________________________________________________________________________________ (Print) (Signature) Appendix A - 1 Demographic and Exposure Questionnaire Participant ID # ______________ Date ______________ THE ALBERTA OIL SANDS COMMUNITY EXPOSURE AND HEALTH EFFECTS ASSESSMENT PROGRAM DEMOGRAPHIC AND EXPOSURE QUESTIONNAIRE As you know, the goal of the Main Study for the Alberta Oil Sands community Exposure and Health Effects Assessment Program is to assess levels of people’s actual exposure to airborne chemicals related to oil sands and other industry during normal daily activities. The information obtained by this questionnaire will be held in strict confidence and will be used solely for research into the effects of environmental factors on population health. All results will be summarized for groups of people; no information about individual persons will be released without the consent of the individual. While you are not required to respond, your cooperation is needed to make the results of this survey comprehensive, accurate, and timely. The questionnaire will take approximately one hour to complete. The purpose of this questionnaire is to obtain information about you, your residence, your occupation, and the environment in which you work. We are asking the same questions of each participant involved in the study. Please circle or check (“ü”) your response or, where necessary, write in the information required. DEMOGRAPHICS 1. Are you …… MALE FEMALE If female, are you currently pregnant? Yes No 2. What is your date of birth? _________/__________/_________ Month Day Year 3. What is the last year of school which you completed? (Please circle one only. If you are currently in school, indicate your current year.) Elementary 1 2 3 4 5 6 Jr/Sr. High 7 8 9 10 11 12 College/Tech School 1 2 3 4 5 6+ University 1 2 3 4 5 6+ Appendix A - 2 4. To what race do you belong? p p p p 5. p Asian p East Indian p Other (please specify below) __________________________ Caucasian First Nations Metis African-American What is your religious affiliation? p None (including agnostic or atheist) p Buddhist p Hindu p Jewish p Mormon 6. 7. p p p p p Muslim Protestant Roman Catholic Traditional native beliefs Other (please specify below) _______________________ a. What year did you move to this address? 19___ N/A (lived here since birth) b. What year did you move to Fort McMurray / Fort MacKay? 19___ N/A (lived here since birth) c. What year did you move to Alberta? 19___ N/A (born in Alberta) d. What year did you move to Canada? 19___ N/A (born in Canada) We would like to obtain your lifetime residential history from the present back. Beginning with your present city of residence, could you list the name of both the city and province (or if you were born out of the country, the city and country), and the years in which you resided at that place. Please use the back of this page if more spaces are required. What city did you move from? Province (State/Country) Appendix A - 3 When did you move there? 8. Some studies have shown that socio-economic status is associated with various dietary and lifestyle factors. In order to make comparisons of groups of people, information about approximate household income is important. Please estimate the total gross income of all members of the household. Which of the following categories contains your estimate? p p p p p p p p p p p p p p Less than $10,000 $10,000 - $14,999 $15,000 - $19,999 $20,000 - $24,999 $25,000 - $29,999 $30,000 - $34,999 $35,000 - $39,999 $40,000 - $44,999 $45,000 - $49,999 $50,000 - $59,999 $60,000 - $69,999 $70,000 – $79,999 $80,000 or greater Don’t Know HOUSEHOLD CHARACTERISTICS AND PRACTICES 9. Which best describes your home? p A mobile home or trailer p A building for 5 to 9 families p p A building for 10 to 19 families p A building for 20 or more families p A one-family house detached from any other house A one-family house attached to one or more houses A building for 2 families p A boat, tent, van, etc. p A building for 3 or 4 families p Other (please specify below) _______________________ p 10. Is there an unpaved driveway on your property? p 11. No p Yes Is there a garden on your property? p No p Yes Appendix A - 4 12. Approximately when was your home originally built? Please consider when it was originally built, not when it was remodeled, added to or converted. p p p p p 13. p p p p p 1995 – Present 1990 – 1994 1985 – 1989 1980 – 1984 1975 – 1979 1970 – 1974 1960 – 1969 1950 – 1959 1949 or earlier Don’t Know How many square feet (or square metres) of living space is there in your home? _________ square feet, or __________ square metres 14. Do you have carpets in your home? p No (skip to question #16) p Yes; In which rooms? (see below) üor 7 Room Living Room Foyer or Front Hall Bedroom1 Bedroom 2 Bedroom 3 Bedroom 4 Kitchen Bathroom Hallways Basement Other (specify) 15. p Check box if estimated? Can you estimate the size of the carpeted area? m2 or ft2 m2 or ft2 2 m or ft2 m2 or ft2 2 m or ft2 m2 or ft2 m2 or ft2 2 m or ft2 m2 or ft2 2 m or ft2 m2 or ft2 During the past week, did you have any new carpet installed or placed in your home? p No p Yes; In which room(s) and when? Check all. p p p p Basement Bedroom Den/Family Room Foyer or Front Hall Appendix A - 5 p p p Living Room Hallway Other (please specify) _________________ 16. During the past week, did you have any drapes, carpeting, or furniture in your house professionally cleaned? p p No Yes; In which room(s) and when? Check all. p p p p 17. p p p Basement Bedroom Den/Family Room Foyer or Front Hall Living Room Hallway Other (please specify) _________________ What is the main type of heating system and fuel used to heat your home? Type of heating system Type of fuel Natural Gas Fuel Oil Electricity Kerosene Coal Wood Forced Air Wall Furnace or Heather Radiant Gravity Portable Fireplace Wood Stove Other (specify) 18. Do you have a cold air return on your heating system? That is, does the heating system take the air from the outside of the home for heating and circulation? p No 19. p Yes p Don’t Know Do you keep your home humidified? p p p No (skip to question #20) Don’t Know (skip to question #20) Yes; At what relative humidity? ______________% RH At what temperature? ______________ 0C How do you add humidity? p Attachment on furnace p Free-standing humidifier p Other Method Appendix A - 6 Other 20. Do you have: a. an unvented clothes dryer located in the house or an attached structure, such as a garage? p No p Yes; Where? ______________________________ b. an unvented kerosene heater in the house or an attached structure? p No p Yes; Where? ______________________________ c. a fireplace in the house or an attached structure? p No p Yes; Gas or Wood-burning? (Please circle one) Where? ___________________________________ Is the damper usually open? p No p Yes d. a wood stove in the house or an attached structure? p No p Yes; Where? ______________________________ e. central air conditioning? p No p Yes; Where? ______________________________ f. window air conditioner(s)? p No p Yes; Where? ______________________________ g. ceiling exhaust fan(s)? p No p Yes; Where? ______________________________ h. portable or ceiling circulating fan(s)? p No p Yes; Where? ______________________________ i. central vacuum system (built-in)? p No (skip to question #21) p If yes, how frequently do you vacuum? ___ 21. times daily ___ times weekly ___ Yes times monthly ___ times yearly Did or does your home contain Urea Formaldehyde insulation? p No p Yes Appendix A - 7 p Don’t Know ___ Never 22. Are there any pets in your household? p p No (skip to question #23) Yes If yes, what kind of pet(s) do you have? p Dog p Cat p Other ____________________ 8Does this pet live mainly indoors? p Yes 23. p No Please indicate if you store any of the following items in any structure that is attached to or part of your home. Place a ü in the column that indicates where the item is usually stored and indicate if you ever smell odours by circling either “Y” or “N”. Not Stored Item Garage Basement Hobby Room Storage Room Other Location Kerosene Gasoline Gasoline powered tools (including lawn mowers) Automobiles Motorcycles, snowmobiles, dirt bikes Chemicals, pesticides Varnishes and paints 24. Where do you store your cleaning supplies, such as bleaches and detergents? Please check all that apply. p p p p p Kitchen Utility Room Laundry Room Bathroom Basement p p p p Appendix A - 8 Garage Hobby Room Attic Other (please specify below) _________________ Do you ever smell odours in adjacent rooms? Y N Y N Y N Y Y N N Y Y N N 25. Have you ever had a hobby that caused you to work daily for more than a month with glues, solvents, or chemicals? p 26. No p Yes; please specify _______________________________________ ______________________________________________________ ______________________________________________________ ______________________________________________________ Have you ever worked with any of the following chemicals daily for more than a month? (If Yes, describe in the space below the nature of the work, dates, including whether you are currently exposed, and any symptoms you may have experienced when exposed.) a. Organic solvents (toluene, xylene, methylene chloride, methyl chloroform, trichloroethylene, perchloroethylene, styrene, n-hexane) . . . . p No p Yes b. If yes, specify: _________________________________________________ Lead . . . . . . . . . . . . . . . . . . . . . . . . . . . . . . . . . . . . . . . . . . . . . p No p Yes c. Mercury . . . . . . . . . . . . . . . . . . . . . . . . . . . . . . . . . . . . . . . . . . p No p Yes d. Other Metals (If yes, specify:) ________________________ p No p Yes e. Pesticides (If yes, specify:) ___________________________ p No p Yes f. Other chemicals that make you feel ill . . . . . . . . . . . . . . . . . . . p No p Yes If yes, specify: __________________________________________________ Explanation for any of above: 27. Have you ever used mothballs or moth crystals in your home? p p No (skip to question #28) Yes If yes, are you currently using mothballs or moth crystals in your home? p p No (skip to question #28) Yes If yes, in which room(s) are you currently using mothballs or moth crystals? p Living Room p Attic p Den p Family Room p Dining Room p Basement p Bedroom p Other (please specify below) p Kitchen p _______________________ Appendix A - 9 28. Do you use indoor air fresheners of any type? Please be sure to include any sprays, liquid or solid air fresheners. p p No Yes If yes, in which room(s) and how frequently? (Fill in the number of times daily, weekly, or monthly in each room, or if “Rarely”, check (ü) column.) Times Daily Times Monthly Times Weekly Rarely Living Room Dining Room Kitchen Family Room Den Bedroom Bathroom Other 29. a. How frequently do you have an outdoor barbecue or fire? ____ Times Daily ____ Times Weekly ____ Times Monthly ____ Times Yearly ____ Never b. Do you have these mainly in the (You may check more than one answer for this question. If “never” in part (a), skip to question #30.) p 30. 31. p Summer p Fall p Winter p Year-round What is the source of your tap water? p City or Municipality p Surface Water (i.e., dug out) p Well p Other (specify) __________ Is your tap water hard or soft? p 32. Spring Hard p p Soft Don’t Know Do you use tap water for drinking and drink mixes (that is, for coffee, tea, mixing juice concentrate, etc.)? p No (skip to question #34) Appendix A - 10 p Yes 33. When you drink water from the tap, do you run the water for a period of time before filling your glass? p No 34. p Yes Do you have a filter on your water tap or any other type of filter that purifies the water? p No 35. p Sometimes p Yes; What type? _________________________ Do you use bottled water? p No (skip to question #36) p Yes p Sometimes 4If yes or sometimes, for what purposes do you use bottled water? Check (ü) all that apply. p All drinking p Cooking p Drink at work/school p Other (specify) p Drink when travelling __________________________________ 36. Approximately how much liquid do you drink each day? ________________________ 37. During the past week, have you used any pesticides (e.g. Raid, ant/roach traps, plant pesticides, etc.) inside your home? p No (skip to question #38) p Yes 4If yes, in which room(s) were these pesticides used? ______________________________________________________________ 4If yes, specify when these where used and check box if they are currently in use _______________________________________________ p Currently in use 38. During the past week, did you use pesticides anywhere outside your home? That is, on your garden, lawn, or elsewhere on the property outside your home? p No 39. Do you ever use any insect repellants (e.g. Deep Woods, Deet, etc)? p No 40. p Yes p Yes (specify type) ___________________ While you are awake, in which area of your home do you spend MOST of your time? p Bedroom p Kitchen p Den p Living Room p Dining Room p Other (please specify below) p Family Room __________________ Appendix A - 11 41. Is smoking permitted in your home? p No p Yes; Do people usually smoke when you are an occupant? p No 42. Is smoking permitted in your vehicle? p No p Yes; Do people usually smoke when you are an occupant? p No 43. p Yes p Yes Have you ever smoked as much as one cigarette a day for as long as one year? p No (skip to question #44) p Yes; How much did/do you smoke per day? p 1 to 10 Daily cigarette equivalent: p 11 to20 1 oz tobacco = 25 cigarettes p 21 to 30 1 small cigar = 2 cigarettes p 31 to 40 1 large cigar = 5 cigarettes p > 40 4How many years did/have you smoke/smoked? _________________________ 4If you have quit, how long has it been since you quit? (Years and months if known) _______________________________________ 44. How many of your friends smoke? p None 45. p A few p About half p Most p All How much time, on a typical day, are you exposed to second-hand cigarette smoke? ____________________________________________________________________ Appendix A - 12 46. In a survey of Fort McMurray carried out earlier, residents made the following statements. We would like to know how strongly you agree or disagree with them. On a scale of 1 (Strongly Disagree) to 7 (Strongly Agree), please state how much you agree with each statement. Please circle one of the seven numbers for each statement. Strongly Disagree Strongly Agree Overall, political-economic control of your town rests in the hands of a few prominent business people. 1 2 3 4 5 6 7 The provincial government has really helped your town’s development. 1 2 3 4 5 6 7 The municipal government is interested in my needs and cares about my opinion. 1 2 3 4 5 6 7 If I have a concern with municipal bylaws, I can call and get action. 1 2 3 4 5 6 7 Local officials are easily accessible in my town. 1 2 3 4 5 6 7 Social class is important in my town. 1 2 3 4 5 6 7 Family breakdown is common in my town. 1 2 3 4 5 6 7 The oil industries (e.g. Suncor, Syncrude) are responsible for a lot of pollution in my town. 1 2 3 4 5 6 7 Pollution is better controlled than it used to be. 1 2 3 4 5 6 7 The oil industries have reduced their pollution emissions in the past few years. 1 2 3 4 5 6 7 The oil industries care about environmental damage and are actively working to reduce long-term impacts. 1 2 3 4 5 6 7 The Regional Health Authority (RHA) Board is interested in my health/welfare. 1 2 3 4 5 6 7 47. How many people live in your household? __________ Appendix A - 13 48. Please list all the people who regularly live in this household, and indicate their age, relationship to you, and some additional information. This data is requested as it is often the case that these people are exposed to the same air quality and contaminants as you are. Person 1 Person 2 Person 3 Name: Name: Name: Date of Birth: _____/_____/_____ Date of Birth: _____/_____/_____ Date of Birth: _____/_____/_____ Month / Day / Year Month / Day / Year Month / Day / Year Gender: p M p F Gender: p M p F Gender: p M p F Relationship to you: Relationship to you: Relationship to you: Is this person employed or attending school full time? Is this person employed or attending school full time? Is this person employed or attending school full time? p No p No p No p Yes, school p Yes, school p Yes, school p Yes, full time employment p Yes, full time employment p Yes, full time employment Occupation? __________________ Occupation? __________________ Occupation? __________________ Does this person smoke daily, occasionally, or not at all? Does this person smoke daily, occasionally, or not at all? Does this person smoke daily, occasionally, or not at all? p Daily p Daily p Daily p Occasionally p Occasionally p Occasionally p Not at all p Not at all p Not at all If this person smokes daily or occasionally, what do they smoke, and how frequently? If this person smokes daily or occasionally, what do they smoke, and how frequently? If this person smokes daily or occasionally, what do they smoke, and how frequently? p Cigarettes, ____ per day or week p Cigarettes, ____ per day or week p Cigarettes, ____ per day or week p Pipe, _____ per day or week p Pipe, _____ per day or week p Pipe, _____ per day or week p Cigars, _____ per day or week p Cigars, _____ per day or week p Cigars, _____ per day or week p Other, _____ per day or week p Other, _____ per day or week p Other, _____ per day or week Appendix A - 14 Person 4 Person 5 Person 6 Name: Name: Name: Date of Birth: _____/_____/_____ Date of Birth: _____/_____/_____ Date of Birth: _____/_____/_____ Month / Day / Year Month / Day / Year Month / Day / Year Gender: p M p F Gender: p M p F Gender: p M p F Relationship to you: Relationship to you: Relationship to you: Is this person employed or attending school full time? Is this person employed or attending school full time? Is this person employed or attending school full time? p No p No p No p Yes, school p Yes, school p Yes, school p Yes, full time employment p Yes, full time employment p Yes, full time employment Occupation? __________________ Occupation? __________________ Occupation? __________________ Does this person smoke daily, occasionally, or not at all? Does this person smoke daily, occasionally, or not at all? Does this person smoke daily, occasionally, or not at all? p Daily p Daily p Daily p Occasionally p Occasionally p Occasionally p Not at all p Not at all p Not at all If this person smokes daily or occasionally, what do they smoke, and how frequently? If this person smokes daily or occasionally, what do they smoke, and how frequently? If this person smokes daily or occasionally, what do they smoke, and how frequently? p Cigarettes, ____ per day or week p Cigarettes, ____ per day or week p Cigarettes, ____ per day or week p Pipe, _____ per day or week p Pipe, _____ per day or week p Pipe, _____ per day or week p Cigars, _____ per day or week p Cigars, _____ per day or week p Cigars, _____ per day or week p Other, _____ per day or week p Other, _____ per day or week p Other, _____ per day or week Appendix A - 15 Person 7 Person 8 Person 9 Name: Name: Name: Date of Birth: _____/_____/_____ Date of Birth: _____/_____/_____ Date of Birth: _____/_____/_____ Month / Day / Year Month / Day / Year Month / Day / Year Gender: p M p F Gender: p M p F Gender: p M p F Relationship to you: Relationship to you: Relationship to you: Is this person employed or attending school full time? Is this person employed or attending school full time? Is this person employed or attending school full time? p No p No p No p Yes, school p Yes, school p Yes, school p Yes, full time employment p Yes, full time employment p Yes, full time employment Occupation? __________________ Occupation? __________________ Occupation? __________________ Does this person smoke daily, occasionally, or not at all? Does this person smoke daily, occasionally, or not at all? Does this person smoke daily, occasionally, or not at all? p Daily p Daily p Daily p Occasionally p Occasionally p Occasionally p Not at all p Not at all p Not at all If this person smokes daily or occasionally, what do they smoke, and how frequently? If this person smokes daily or occasionally, what do they smoke, and how frequently? If this person smokes daily or occasionally, what do they smoke, and how frequently? p Cigarettes, ____ per day or week p Cigarettes, ____ per day or week p Cigarettes, ____ per day or week p Pipe, _____ per day or week p Pipe, _____ per day or week p Pipe, _____ per day or week p Cigars, _____ per day or week p Cigars, _____ per day or week p Cigars, _____ per day or week p Other, _____ per day or week p Other, _____ per day or week p Other, _____ per day or week Appendix A - 16 WORK ENVIRONMENT 49. Do you have a paid job outside of the home? p Yes p No, self-employed in the home p No, full-time student p No, full-time homemaker (skip to question #56) p No, out of work just now, but usually employed (skip to question #56) p No, retired, or disabled (skip to question #56) p No, other (please specify): ____________________________ (skip to question #56) 50. Where do you work or attend school? ________________________________________ 51. At the present time, is your primary job or school attendance full- or part-time? p Full-time p Part-time 52. What is your occupation or if you are a student, what program or training are you currently taking? ________________________________________________________ 53. Thinking back over the past 3 months, which of the following best describes your usual daily activities or work habits? p Usually sit during day and do not walk about very much p Stand or walk about quite a lot but do not have to carry or lift things very often p Usually lift or carry light loads, or have to climb stairs or hills often p Do heavy work or carry very heavy loads 54. a. Do you work in a non-smoking environment? b. How many of your co-workers smoke? p None 55. p A few p About half p No p Yes p Most p All Do you work with office equipment such as a computer, printer, or photocopier? p No p Yes; What type? (Please indicate all that apply) p Computer p Photocopier p Printer p Other(s) p Fax machine ________________________ Appendix A - 17 56. It is implied that some symptoms are the result of certain environmental conditions in the home, workplace, or commuting microenvironments, and are not caused by other factors such as infections, food poisoning, sunstroke, etc. Please indicate if you have experienced any of the following symptoms during the past year be checking (ü) the appropriate box. If you did not experience these symptoms, please leave the appropriate line blank. Home Office Commuting Other Places (where) Eye irritation Nose irritation Throat irritation Dry mucous membranes Dry skin Erythema Mental fatigue Physical fatigue Headaches Unspecific airway infections Scratchy throats or coughs Colds or flu Nausea Dizziness Dry, itching, or tearing eyes Strained eyes or focusing Chest tightness Unspecific hypersensitivity Feeling heavy-headed Difficulty concentrating Dry facial skin Aching joints Muscle twitching Back pain 57. Have you seen a doctor for any or all of these symptoms? p No 58. p Yes When do you experience relief from these symptoms? ____________________________ ________________________________________________________________________ Appendix A - 18 59. Do you have another job, or if employed, do you go to school part-time? p Yes 60. p No (skip to question #63) At the present time, is your second job or school attendance full-time or part-time? p Full-time p Part-time 61. Where do you work or attend school? ________________________________________ 62. What is your occupation for your second job? (If you are a student: What program or training are you taking?) ___________________________________________________ 63. If you have any questions, comments or concerns about the study please write these down in the space provided below. ___________________________________________________________________________ ___________________________________________________________________________ ___________________________________________________________________________ ___________________________________________________________________________ ___________________________________________________________________________ ___________________________________________________________________________ ___________________________________________________________________________ ___________________________________________________________________________ Appendix A - 19 Health Habits and Diet Survey Participant ID # __________ Date __________ THE ALBERTA OIL SANDS COMMUNITY EXPOSURE AND HEALTH EFFECTS ASSESSMENT PROGRAM HEALTH HABITS AND DIET SURVEY As you are probably already aware, the goal of the Alberta Oil Sands Community Exposure and Health Effects Assessment Program is to assess levels of people’s actual exposure to airborne chemicals related to oil sands and other activities during normal daily activities. The purpose of this questionnaire is to obtain information about your dietary habits, physical activity, and health. The information recorded in this questionnaire will be held in strict confidence and will be used solely for research into the effects of environmental factors on population health. We are asking the same questions of each participant in the study. All results will be summarized for groups of people; no information about individual persons will be released without the consent of the individual. While you are not required to respond, your cooperation is needed to make the results of this study comprehensive, accurate, and timely. This questionnaire will take approximately one to two hours to complete. Please answer all questions as accurately as possible and feel free to ask any questions you have about this questionnaire or express any other concerns about the study. 1. How tall are you? 2. How much do you weigh? 3. Have you gained or lost more than ten pounds (4.5 kilograms) in the past year? (Check ü) If yes, please check the appropriate box and fill in one of the blanks to indicate how much. p No (go to question #4) p Yes, I gained approximately _______ lbs. (or _______ kg) in the past year p Yes, I lost approximately _______ lbs. (or _______ kg) in the past year If yes, were there any specific reasons why your weight changed? 4. __________ feet __________ inches / __________centimeters __________ pounds / _________ kilograms Do you regularly take any vitamins or minerals? p No (go to question #5) p Yes If yes, what are you currently taking? See example. Brand Name Dosage Frequency (#/day, week, etc.) Centrum Vit. A – 400 IU, Vit. B1 – 2.25mg, Vit B2 – 2.6mg, Niacinamide-20mg, Folic Acid – 0.1mg, Vit. B6 – 3mg, etc. 1/day Note: Please check the label of the bottle or refer to the side of the box for this information. Appendix A - 20 5. Do you regularly take any herbal preparations? p No (go to question #6) p Yes If yes, what are you currently taking? Herbs Used & Brand Name Dosage Frequency (#/day, week, etc.) 6. During the past year have you taken any prescription medications? p No (go to question #7) p Yes(see below) If yes, please list all that you have taken below. Please note if you are currently taking this prescription medication by checking (ü) the “Current” column. Prescription Name Dosage Frequency (#/day, week, etc.) Current 7. During the past year have you taken any other medications, including painkillers (e.g. tylenol, aspirin), antacids (e.g. tums, rolaids, pepto bismol), or antihistamines (e.g. sudafed)? p No (go to question #8) p Yes(see below) If yes, please list all that you have taken below. Please note if you are currently taking this prescription medication by checking (ü) the “Current” column. Brand Name Dosage Frequency (#/day, week, etc.) Appendix A - 21 Current 8. Instructions for Completing Nutritional Component This section is about your usual eating habits. Please think back over the last year when you answer these questions. Identify the foods you can recall eating during the last year and estimate the amount you usually eat. Remember to include foods eaten in mixtures, such as the carrots in stew, or the cheese or meat toppings on a pizza. Include only those foods that you eat, not what is served to your family. First, indicate (by checking the appropriate box) whether your usual serving size of a particular food is small (S), medium (M) or large (L). Each food contains an example of a medium serving size. If you portion is similar to that listed, place a check mark (ü) in the medium (M) column. If you typically eat or drink larger servings, place a check mark (ü) in the large (L) column. If you eat or drink less than the medium serving size shown, place a check mark (ü) in the small column. Then, put a NUMBER in the most appropriate column to indicate HOW OFTEN, on the average, you eat the food. For example, you may eat bananas twice a wee, in which case you would put a “2” in the “Week” column. If you never eat bananas, you would place a check mark (ü) in the appropriate box in the “Rarely/Never” column. Please DO NOT SKIP foods, and please BE CAREFUL which column you put your answer in. It will make a big difference if you indicate “Hamburger once a day” when you mean “Hamburger once a week”! Each food category contains “other” spaces for you to add foods that are not listed. Write the amount you normally eat beside the food in the “medium serving” column. Please note that the “Meats and Alternatives” and the “Beverages” components have additional, slightly modified instructions. Please look at the example below: Medium Serving Cantaloupe Grapefruit Sweet Potatoes, yams Ice Cream Squash, Yellow ¼ melon (½ cup) ½ Your Serving Size S M L ü ü ü How often? Day Week Month Year ½ cup (125 ml) 1 cup (250 ml) ½ cup (125 ml) This person: 1) eats a medium serving of cantaloupe once a week; 2) has ½ grapefruit about twice a month; 3) has a small serving of sweet potatoes about three times a year; 4) has a bowl of ice cream about three times a week; and 5) never eats squash. Appendix A - 22 Rarely /Never FRUITS AND VEGETABLES: FRUITS EXAMPLE: Apples or Applesauce Apples or Applesauce Apricots (not dried) Banana Berries (saskatoons, raspberries, strawberries, etc.) Cantaloupe Cherries Grapefruit Grapes Nectarines Oranges Peaches Pears Pineapple Plums Pumpkin Rhubarb Tangerines Watermelon Dried fruit (e.g. raisins, prunes, apricots, etc.) Fruit Juices – all types (not crystals or fruit flavoured drinks (e.g., not Kool-Aid or Crystal Light) Other Fruits: Your Serving Size Medium Serving S 1 or ½ cup M ü 1 or ½ cup 2-3 1 med. ( ½ cup) ½ cup (125 ml) ¼ melon ½ cup (125 ml) ½ or ½ cup ½ cup (125 ml) 1 medium 1 med. (½ cup) 1 med. (½ cup) 1 med. (½ cup) ½ cup (125 ml) 2-3 medium ½ cup (125 ml) ½ cup (125 ml) 1 medium 1 medium wedge 2 Tbsp. ½ cup (125 ml) Appendix A - 23 How often? L Day Week 4 Month Year Rarely /Never FRUITS AND VEGETABLES: VEGETABLES Beans, green or yellow Beets Broccoli Brussel sprouts Cabbage, cole slaw, sauerkraut Carrots Cauliflower Celery Corn Cucumber Garlic, fresh Kohlrabi, parsnips, and turnips Lettuce salad Mushrooms Mustard greens, turnip greens, collards Onions Peas Peppers sweet (e.g., green, yellow, red); not hot Potatoes (boiled, baked, potato salad, mashed) Potatoes (fried, french fries, hash browns) Spinach, Swiss chard Squash, yellow Sweet potatoes, yams Tomato, raw Tomato sauce Tomato, canned Zucchini Mixed, assorted, or frozen vegetables Vegetable soups, such as tomato Vegetable drinks(e.g. tomato juice,Clamto,V-8) Other vegetables: Medium Serving Your Serving Size S M L ½ cup (125 ml) ½ cup (125 ml) 2 stalks or ½ cup (125 ml) ½ cup (125 ml) ½ cup (125 ml) ½ cup (125 ml) ½ cup (125 ml) ½ cup (125 ml) ½ cup (125 ml) ½ cup (125 ml) 1 tsp. (minced or crushed) ½ cup (125 ml) 1 cup (250 ml) ½ cup (125 ml) ½ cup (125 ml) ¼ cup (75 ml) ½ cup (125 ml) ½ cup (125 ml) 1 med. or ½ cup (125 ml) ¾ cup ½ cup (125 ml) ½ cup (125 ml) ½ cup (125 ml) 1 med. (½ cup) ¼ - ½ cup (75 –125 ml) ½ cup (125 ml) ½ cup (125 ml) ½ cup (125 ml) 1 cup (250 ml) ½ cup (125 ml) Appendix A - 24 How often? Day Week Month Year Rarely /Never Your Serving Size Medium Serving S GRAIN PRODUCTS Bread, rolls, white Bread, rolls, whole grain or dark Bagel, hamburger or hot dog bun, white Bagel, hamburger or hot dog bun, whole grain Bannock Corn bread, corn muffins or corn tortillas Crackers (all types) Cereals, cooked (e.g., oatmeal, porridge) Cereals, cold: higher fiber (e.g., bran, shreddies, granola, shredded wheat) Cereals, cold: lower fiber (e.g., corn flakes, rice krispies, sugary cereals) Rice, cooked: White Brown or Wild Pasta – all types, cooked Other grain products: M 1 slice or roll 1 slice or roll ½ ½ 1 small piece 1 medium piece 4–6 ½ cup (125 ml) 1 cup (30 g) 1 cup (30 g) ½ cup (125 ml) ½ cup (125 ml) ½ cup (125 ml) Appendix A - 25 How often? L Day Week Month Year Rarely /Never Your Serving Size Medium Serving S MILK PRODUCTS Fluid milk: (including in coffee, tea, or on cereal) Homogenized or whole 2% 1% Skim Dry skim milk powder Evaporated milk: Whole 2% Skim Cheese, hard, all types: Regular “Light” or fat reduced Cheese, processed or slices: Regular “Light” or fat reduced Cottage Cheese: 4% MF “Light” or fat reduced Cheese spreads (e.g., cream cheese and cheese whiz) Regular “Light” or fat reduced Yogurt: Fat-free All other yogurts Ice-cream Pudding, soups, and other products made from milk Other milk products: M 1 cup (250 ml) 1 cup (250 ml) 1 cup (250 ml) 1 cup (250 ml) 1-2 Tbsp ½ cup (125 ml) ½ cup (125 ml) ½ cup (125 ml) 50 g (3”x1”x1”) 50 g (3”x1”x1”) 50 g (2 slices) 50 g (2 slices) 1 cup (250 ml) 1 cup (250 ml) 2 Tbsp. 2 Tbsp. 1 cup (250 ml) 1 cup (250 ml) 1 cup (250 ml) 1 cup (250 ml) Appendix A - 26 How often? L Day Week Month Year Rarely /Never BAKED GOODS, SWEETS, SNACK FOODS Baked goods (e.g., muffins, loaves, pies, cake, cookies, pastries, donuts) Candy: Chocolate Hard or soft candy Sugar, white and brown (including in tea, coffee, or on cereal) Syrup, all types Honey Jams and jellies Popcorn (1 microwave bag = 3 cup) Potato chips, pretzels, cheesies, etc. Other sweets or snack foods: Medium Serving Your Serving Size S M L How often? Day Week Month Year Rarely/ Never 2-3 cookies, 1 donut or pastry, 1 med. pc. 1 bar (40 – 60 g) 1 handful 1 tsp. 1 Tbsp. 1 Tbsp. 1 Tbsp. 3 cups or 1 bag 1 cup (250 ml) Medium Serving Your Serving Size How often? S M L Day Week Month Year FATS AND OILS TIP: For estimating fat used in cooking: 1 cup (250 ml) contains 16 Tbsp. ½ cup (125 ml) contains 8 Tbsp. Butter (not for cooking) 1 tsp. Hard margarine (not for cooking) 1 tsp. Soft tub margarine (not for cooking) 1 tsp. Salad dressing: Regular 1 Tbsp. “Light” or fat reduced 1 Tbsp. Cream 1 Tbsp. Mayonnaise: (including on sandwiches) Regular 1 Tbsp. “Light” or fat reduced 1 Tbsp. Sour Cream: Regular 1 Tbsp. “Light” or fat reduced 1 Tbsp. Cooking fats/oils: Lard or shortening 1 Tbsp. Canola oil 1 Tbsp. Olive oil 1 Tbsp. Peanut oil 1 Tbsp. Other vegetable oils 1 Tbsp. Meat drippings 1 Tbsp. Butter or margarine 1 Tbsp. Other fats and oils: Appendix A - 27 Rarely/ Never Instructions for meat and alternates component: Please indicate your serving size of meats according to the following guidelines. One deck of cards is equal to approximately 3 oz. (100 g) of meat, which is equal to a medium serving (check the “M” column if you eat about this amount per meal.) A small serving size would be about half a deck of cards (check the “S” column if you eat about this amount). A large serving size would be about two decks of cards (check the “L” column if you eat this amount). If you usually eat a portion size less than half a deck of cards or more than two decks of cards, indicate this by placing a number in the “S” or “L” column that corresponds to the number of cards you eat in an average meal. The first row is filled in as an example. This person has indicated that they eat a steak that is equivalent to four decks of cards (or about 12 oz.) twice a week. Medium Serving S MEAT AND ALTERNATES Beef, all types (steaks, roasts) Beef, all types (steaks, roasts); not ground Beef, ground (all burgers, meat loaf) Beef, stew or pot pie with vegetables Beef, salt Pork, all types (e.g., chops, roasts) Poultry (e.g., chicken or turkey): Roasted, stewed, broiled, baked, stir fried Fried Fish: Fresh or frozen (broiled, baked) Fried fish or fish sandwich Canned (e.g., tuna, salmon, etc.) Shellfish (shrimp, lobster, crab, mussels) Liver (including chicken livers) Lamb Wild meat (e.g., deer, moose, rabbit) Wild birds (e.g., goose, duck, etc.) Cured meats (e.g., bacon, ham, etc.) Processed meats (e.g., luncheon meats, sausages, wieners) Canned meat Eggs Tofu Dry beans, peas, or lentils (e.g., chick or split peas; kidney or baked (“pork and beans”)) Nuts (shelled) Peanut butter Other meats and alternates: Your Serving Size M 50-100 g (2-3 oz) 50-100 g (2-3 oz) 50-100 g (2-3 oz) 1 cup (250 ml) 50-100 g (2-3 oz) 50-100 g (2-3 oz) 50-100 g (2-3 oz) 50-100 g (2-3 oz) 50-100 g (2-3 oz) 50-100 g (2-3 oz) 1 /3 – ½ can (50–100g) 50-100 g (2-3 oz) 50-100 g (2-3 oz) 50-100 g (2-3 oz) 50-100 g (2-3 oz) 50-100 g (2-3 oz) 50-100 g (2-3 oz) or 4-8 strips bacon 50-100 g (2-3 oz) (1-2 wieners or 1-2 slices of lunch meat) 50-100 g (2-3 oz) 1 large or 2 small 1 /3 cup (100 g) ½ - 1 cup (125 - 250 ml) cooked 2 Tbsp. 2 Tbsp. Appendix A - 28 L 4 How often? Day Week 2 Month Year Rarely/ Never Instructions for beverage component: Please indicate how often you drink the following beverages by placing the appropriate number in the appropriate box. In the example below, this person has indicated that they drink nine (9) cups of coffee per day. How often? Medium Serving BEVERAGES Example:Coffee, regular (not decaffeinated) Coffee, regular (not decaffeinated) Tea (not herbal) Cola type drinks (all pops, except diet) Cola type drinks (diet only) Powdered drinks (sweetened) (e.g., Kool-Aid, Crystal Lite, etc.) Beer Wine Other Liquor Day 1 cup (250 ml) 1 cup (250 ml) 1 cup (250 ml) 1 can (355 ml) 1 can (355 ml) 1 cup (250 ml) (reconstituted) 1 can (350 ml) 4 oz (125 ml) 1oz,1shot (30 ml) Week Month Year Rarely/ Never 9 Other beverages (not fruit or vegetable drinks): Seldom/Never r r r r r Sometimes r r r r r Often/Always r r r r r 9. How often do you eat the skin on chicken? How often do you eat the fat on meat? How often do you use salt in your cooking? How often do you add table salt to your food? How often do you add pepper to your food? 10. Do you ever eat any locally- or home-grown fruits or vegetables? r No (go to question #11) r Yes If yes, in an average year, how often would you eat these fruits and vegetables? ____ Times Daily ____ Times Weekly ____ Times Monthly ____ Times Yearly Would you say that you eat these fruits and/or vegetables seasonally (i.e., in the summer and fall only) or do you consume them at about the same rates year-round? r Seasonally r Year-round Appendix A - 29 11. Do you ever eat any local wild fruits or berries? r No r Yes If yes, what type of wild fruit or berries do you eat? (Check all that apply.) r Blueberries r Raspberries r Chokecherries r Rose hips r Crabapples r Saskatoons r Cranberries r Soapberries r Currants r Strawberries r Gooseberries r Other(s) _______________________ If yes, in an average year, how often would you eat wild fruits or berries? ____ 12. Times Daily ____ Times Weekly ____ Times Monthly ____ Times Yearly If you eat any other local wild plants, herbs, vegetables, weeds, seeds or nuts, indicate theses in the space provided. ________________________________________________________________________ 13. Do you ever eat locally caught wild meat? r No r Yes If yes, what type of wild meat do you eat? (Check all that apply.) r Bear r Gopher (Richardson Ground Squirrel) r Beaver r Grouse r Caribou r Moose r Deer r Pheasant r Duck r Ptarmigan r Eggs (wild bird) r Rabbit/Hare r Goose r Other(s) ______________________ 14. Do you ever eat locally caught fish? r No r Yes If yes, what type of fish do you eat? (Check all that apply.) r Arctic grayling r Sturgeon r Burbot r Trout r Fish eggs r Walleye (Pickerel) r Goldeye r Whitefish r Perch r Other(s) r Pike ____________________________ Appendix A - 30 15. How often do you eat meals from these sources? Please place one number (or check “ü” if never) in each row. For example, if your average week consisted of going out for breakfast or lunch daily to a fast food chain, going out for dinner once a week to a nonfast food restaurant, and you never ate cafeteria style meals, you would indicate this by placing a “1” in the “Day” column of the “Fast foods” row, a “1” in the “Week” column of the “Restaurants” row and a “ü” in the “Never” column of the “Cafeteria style meals” row. It is not necessary to describe amounts only how often you eat these meals. DINING OUT Fast foods Take out foods Cafeteria style meals Home delivery Restaurants Deli foods Other 16. Day Week Month Year Never Please list your five most common choices when you eat fast or take out foods, cafeteria meals, home delivery foods, restaurant dishes, or deli foods. For example, they might include caesar salad, clam chowder, steak sandwich, pizza, and french fries. 1. ____________________________________________________________________ 2. ____________________________________________________________________ 3. ____________________________________________________________________ 4. ____________________________________________________________________ 5. ____________________________________________________________________ Appendix A - 31 17. We would also like to know if you have had any medical complaints and how your health has been, in general, over the past few weeks. Please answer all the questions below by circling the answer which you think most nearly applies to you. Remember that we want to know about present and recent complaints, not those that you had in the past. It is important that you try to answer all of the questions. Have you recently . . . Better than usual Same as usual Less than usual Much less than usual Not at all No more than usual Rather more than usual Much more than usual Been feeling mentally alert and wide awake? Better than usual Same as usual Less alert than usual Much less alert Been feeling full of energy? Better than usual Same as usual Less than usual Much less energetic Been having restless, disturbed nights? Not at all No more than usual Rather more than usual Much more than usual Been managing to keep yourself busy and occupied? More than usual Same as usual Less than usual Much less than usual Been getting out of the house as much as usual? More than usual Same as usual Less than usual Much less than usual Been managing as well as most people would in your shoes? Better than most About the same Rather less well Much less well Felt on the whole you were doing things well? Better than usual About the same Less well than usual Much less well Been able to feel warmth and affection for those near to you? Better than usual About the same Less well than usual Much less well Been finding it easy to get along with other people? Better than usual About the same as usual Less well than usual Much less well Felt that you are playing a useful part in things? More than usual Same as usual Less useful than usual Much less useful Felt capable of making decisions about things? More than usual Same as usual Less than usual Much less capable Felt constantly under strain? Not at all No more than usual Rather more than usual Much more than usual Been able to concentrate on whatever you are doing? Lost much sleep over worrying? Appendix A - 32 Have you recently . . . Felt you couldn’t overcome your difficulties? Not at all No more than usual Rather more than usual Much more than usual Been finding life a struggle all the time? Not at all No more than usual Rather more than usual Much more than usual Been able to enjoy your normal day-today activities? More than usual Same as usual Less than usual Much less than usual Been taking things hard? Not at all No more than usual Rather more than usual Much more than usual Been getting scared or panicky for no good reason? Not at all No more than usual Rather more than usual Much more than usual Been able to face up to your problems? More than usual Same as usual Less able than usual Much less able Found everything getting on top of you? Not at all No more than usual Rather more than usual Much more than usual Been feeling unhappy and depressed? Not at all No more than usual Rather more than usual Much more than usual Been losing confidence in yourself? Not at all No more than usual Rather more than usual Much more than usual Been thinking yourself a worthless person? Not at all No more than usual Rather more than usual Much more than usual Felt that life is entirely hopeless? Not at all No more than usual Rather more than usual Much more than usual Been feeling hopeful about your own future? Not at all No more than usual Rather more than usual Much more than usual Been feeling reasonably happy, all things considered? More than usual About the same as usual Less than usual Much less than usual Been feeling nervous and strung-up all the time? Not at all No more than usual Rather more than usual Much more than usual Felt that life isn’t worth living? Not at all No more than usual Rather more than usual Much more than usual Found at times that your couldn’t do anything because your nerves were too bad? Not at all No more than usual Rather more than usual Much more than usual Appendix A - 33 18. We would like to know if you any long-term health conditions (that is, conditions that have lasted or are expected to last 6 months or more) that have been diagnosed by a health care professional. Below is a list of chronic health conditions. Please indicate by checking (ü) the appropriate box if you have ever been diagnosed by a health care professional for any of the following conditions. Have you ever been diagnosed with: r r r r r r r r r r r r r r r r r r r r r r r r r r r r Food allergies Other allergies Asthma – If yes, have you had an attack in the past 12 months? r No r Yes Have you had any whistling or wheezing in the chest at any time in the past 12 months? r No r Yes Chronic bronchitis or emphysema Sinusitis Arthritis Back problems, excluding arthritis Diabetes Epilepsy High blood pressure Heart Disease Effects of stroke Cancer – what type of cancer? _________________________________________ Alcoholism Urinary incontinence Kidney failure or kidney disease Acne requiring prescription medication Cataracts Glaucoma Migraine headaches Head injury Alzheimer’s disease or other dementia Dementia (please specify) _____________________________________________ Emotional illness (please specify) _______________________________________ Mental health condition (please specify) _________________________________ Any disease affecting your nerves or brain (please specify) __________________________________________________________________ Any other long term condition (please specify) __________________________________________________________________ None Appendix A - 34 19. Here is a list that describes some of the ways people feel at different times. During the past few weeks, how often have you felt …(please circle answer). Angry Never Rarely Sometimes Often Excited Never Rarely Sometimes Often Disgusted Never Rarely Sometimes Often Proud Never Rarely Sometimes Often Afraid Never Rarely Sometimes Often Sad Never Rarely Sometimes Often Interested Never Rarely Sometimes Often Surprised Never Rarely Sometimes Often Sorry Never Rarely Sometimes Often Happy Never Rarely Sometimes Often Embarrassed Never Rarely Sometimes Often 20. Would you describe your life as . . . r r r r 21. Would you describe yourself as usually . . . r r r r 22. very stressful somewhat stressful not very stressful not stressful at all happy and interested in life somewhat happy somewhat unhappy very unhappy How would you describe your usual ability to remember things? Are you . . . r r r r able to remember most things somewhat forgetful very forgetful unable to remember anything at all Appendix A - 35 23. Listed below are some general statements. We would like to know how strongly you agree or disagree with them. On a scale of 1 (Strongly Disagree) to 7 (Strongly Agree), please state how much you agree with each statement. Please circle one of the seven numbers for each statement. Strongly Disagree Strongly Agree The people running this country don’t really care what happens to you. 1 2 3 4 5 6 7 The rich get richer and the poor get poorer. 1 2 3 4 5 6 7 What you think doesn’t count very much anymore. 1 2 3 4 5 6 7 You’re left out of things going on around you. 1 2 3 4 5 6 7 Most people with power try to take advantage of people like yourself. 1 2 3 4 5 6 7 The people in Ottawa are out of touch with the rest of the country. 1 2 3 4 5 6 7 Next to health, money is the most important thing in life. 1 2 3 4 5 6 7 You sometimes can’t help wondering whether anything is worthwhile anymore. 1 2 3 4 5 6 7 1 2 3 4 5 6 7 1 2 3 4 5 6 7 1 2 3 4 5 6 7 1 2 3 4 5 6 7 1 2 3 4 5 6 7 These days a person doesn’t really know whom can be counted on. 1 2 3 4 5 6 7 Most people don’t really care what happens to anyone else. 1 2 3 4 5 6 7 To make money, there are no right and wrong ways, only easy and hard ways. Nowadays, a person has to live pretty much for today and let tomorrow take care of itself. In spite of what some people say, the lot (situation/condition) of the average person is getting worse, not better. It’s hardly fair to bring a child into the world with the way things look in the future. Most public officials (people in public office) are not really interested in the problems of the average person. Appendix A - 36 24. Have you done any of the following in the past 3 months? (Mark ALL that apply) Type of Activity ü or 7 How many times did you do this activity in the past 3 months? About how much time did you usually spend on each occasion? r r r r r r r r r r r r r r r r r r r r r r r r r r r r r r r r r r r r r r r r Walking for exercise (indoor or outdoor) Hiking or snowshoeing Jogging/running (indoor or outdoor) Biking (any type, including stationary) Ice hockey Skating Cross-country skiing Downhill skiing Weight training Exercise class/ aerobics Appendix A - 37 1 to 15 minutes 16 to 30 minutes 31 to 60 minutes more than one hour 1 to 15 minutes 16 to 30 minutes 31 to 60 minutes more than one hour 1 to 15 minutes 16 to 30 minutes 31 to 60 minutes more than one hour 1 to 15 minutes 16 to 30 minutes 31 to 60 minutes more than one hour 1 to 15 minutes 16 to 30 minutes 31 to 60 minutes more than one hour 1 to 15 minutes 16 to 30 minutes 31 to 60 minutes more than one hour 1 to 15 minutes 16 to 30 minutes 31 to 60 minutes more than one hour 1 to 15 minutes 16 to 30 minutes 31 to 60 minutes more than one hour 1 to 15 minutes 16 to 30 minutes 31 to 60 minutes more than one hour 1 to 15 minutes 16 to 30 minutes 31 to 60 minutes more than one hour Type of Activity ü or 7 How many times did you do this activity in the past 3 months? About how much time did you usually spend on each occasion? r r r r r r r r r r r r r r r r r r r r r r r r r r r r r r r r r r r r r r r r Baseball/softball Basketball Bowling Football Golfing Tennis, racquetball, squash Volleyball Popular or social dancing Swimming (in pool or open water) Yoga or Tai-chi Appendix A - 38 1 to 15 minutes 16 to 30 minutes 31 to 60 minutes more than one hour 1 to 15 minutes 16 to 30 minutes 31 to 60 minutes more than one hour 1 to 15 minutes 16 to 30 minutes 31 to 60 minutes more than one hour 1 to 15 minutes 16 to 30 minutes 31 to 60 minutes more than one hour 1 to 15 minutes 16 to 30 minutes 31 to 60 minutes more than one hour 1 to 15 minutes 16 to 30 minutes 31 to 60 minutes more than one hour 1 to 15 minutes 16 to 30 minutes 31 to 60 minutes more than one hour 1 to 15 minutes 16 to 30 minutes 31 to 60 minutes more than one hour 1 to 15 minutes 16 to 30 minutes 31 to 60 minutes more than one hour 1 to 15 minutes 16 to 30 minutes 31 to 60 minutes more than one hour Type of Activity ü or 7 How many times did you do this activity in the past 3 months? About how much time did you usually spend on each occasion? r r r r r r r r r r r r r r r r r r r r Fishing or hunting Gardening, cutting grass, other yard work Other (specify) Other (specify) Other (specify) 1 to 15 minutes 16 to 30 minutes 31 to 60 minutes more than one hour 1 to 15 minutes 16 to 30 minutes 31 to 60 minutes more than one hour 1 to 15 minutes 16 to 30 minutes 31 to 60 minutes more than one hour 1 to 15 minutes 16 to 30 minutes 31 to 60 minutes more than one hour 1 to 15 minutes 16 to 30 minutes 31 to 60 minutes more than one hour None 25. In general, would you say your health is: r r r r r 26. Excellent Very Good Good Fair Poor Compared to one year ago, how would you rate your health in general now? r r r r r Much better now than one year ago Somewhat better now than one year ago About the same now as one year ago Somewhat worse now than one year ago Much worse now than one year ago Appendix A - 39 27. The following ten items are about activities you might do during a typical day. Does your health now limit you in these activities? If so, how much? Yes, limited Yes, limited No, not a lot a little limited at all Activities a. Vigorous activities, such as running, lifting heavy objects, participating in strenuous sports r r r b. Moderate activities, such as moving a table, pushing a vacuum cleaner, bowling or playing golf r r r c. Lifting or carrying groceries r r r d. Climbing several flights of stairs r r r e. Climbing one flight of stairs r r r f. Bending, kneeling, or stooping r r r g. Walking more than one mile r r r h. Walking several blocks r r r i. Walking one block r r r j. Bathing or dressing yourself r r r 28. During the past 4 weeks, have you had any of the following problems with your work or other regular daily activities as a result of your physical health? a. Cut down on the amount of time you spent on work or other activities r Yes b. Accomplished less than you would like r Yes c. r No Were limited in the kind of work or other activities r Yes d. r No r No Had difficulty performing the work or other activities (for example, it took extra effort) r Yes r No Appendix A - 40 29. During the past 4 weeks, have you had any of the following problems with your work or other regular activities as a result of any emotional problems (such as feeling depressed or anxious)? a. Cut down on the amount of time you spent on work or other activities r Yes b. Accomplished less than you would like r Yes c. Not at all Slightly Moderately Quite a bit Extremely How much bodily pain have you experienced during the past 4 weeks? r r r r r r 32. r No During the past 4 weeks, to what extent has your physical health or emotional problems interfered with your normal social activities with family, friends, neighbors, or groups? r r r r r 31. r No Did not do work or other activities as carefully as usual r Yes 30. r No None Very mild Mild Moderate Severe Very severe During the past 4 weeks, how much did pain interfere with your normal work (including both work outside the home and housework)? r r r r r Not at all Slightly Moderately Quite a bit Extremely Appendix A - 41 33. These questions are about how you feel and how things have been with you during the past 4 weeks. For each question, please check (ü) the one answer that comes closest to the way you have been feeling. How much of the time during the past 4 weeks: All of the time Most of the time A good bit of the time Some of the time A little of the time None of the time Did you feel pep? r r r r r r Have you been a very nervous person? Have you felt so down in the dumps that nothing would cheer you up? Have you felt calm and peaceful? Did you have a lot of energy? Have you felt downhearted and blue? r r r r r r r r r r r r r r r r r r r r r r r r r r r r r r g. Did you feel worn out? r r r r r r h. Have you been a happy person? r r r r r r i. Did you feel tired? r r r r r r a. b. c. d. e. f. 34. During the past 4 weeks, how much of the time has your physical health or emotional problems interfered with your social activities (like visiting friends, relatives, etc.)? r r r r r 35. All of the time Most of the time Some of the time A little of the time None of the time How TRUE or FALSE is each of the following statements for you? Mark an 7in the appropriate box. Definitely true Mostly Don’t true know Mostly false Definitely false a. I seem to get sick a little easier than other people r r r r r b. I am as healthy as anybody I know r r r r r c. I expect my health to get worse r r r r r d. My health is excellent r r r r r Appendix A - 42 36. The following five questions are about your neighbourhood and the people around there. Please indicate by circling your answer. 1) How often do you get together with any neighbours just for a chat? Almost never Never Less than once a month Once a month Several times Several times a month a week Almost daily Daily 2) How often do you visit with friends in Fort McMurray/Fort MacKay? Almost Less than Once a Several times Several times Almost Daily never once a month month a month a week daily 3) How often do you visit with relatives in Fort McMurray/Fort MacKay either in your home or theirs (includes all relatives)? Almost Less than Once a Several times Several times Almost Daily Never never once a month month a month a week daily 4) How often are you in contact with friends outside Fort McMurray/Fort MacKay, including letters, phone calls, and visits? Almost Less than Once a Several times Several times Almost Never Daily never once a month month a month a week daily 5) How often are you in contact with relatives outside Fort McMurray/Fort MacKay, including letters, phone calls, and visits? Almost Less than Once a Several times Several times Almost Never Daily never once a month month a month a week daily Never 37. We would like to know about some of the major events that may have happened to you in the last 12 months. Check (ü) all boxes that apply to you. r Lost a job or been unemployed r Been on strike or laid off r Had other work-related difficulties r Had financial problems r r r Got married You and your spouse separated or got divorced Quit or retired from full-time work r Serious illness or injury r r Death of someone close r Arrival of baby at home Someone moved in or out of your home Started working or changed jobs Serious illness or injury of someone close Changed residence r Serious trouble with spouse r Promotion at work r Improvement in finances r r r 38. Aside from any paid vacation and holidays, how many days of scheduled work have you missed for any reason in the past year? ________ day(s) 39. How many times have you seen a medical doctor in the past year? ________ time(s) Appendix A - 43 40. The following five items concern specific areas of life. Please rate yourself on a scale of 1 (very dissatisfied) to 7 (very satisfied) as to how satisfied you are with the following aspects of you life. Please circle one of the seven numbers for each line. Very Dissatisfied Very Satisfied Your non-working activities – hobbies and so on 1 2 3 4 5 6 7 Your family life 1 2 3 4 5 6 7 Your friendships 1 2 3 4 5 6 7 Your standard of living = the things you have (e.g. housing, car, furniture, recreation, etc.) 1 2 3 4 5 6 7 Your neighbourhood 1 2 3 4 5 6 7 41. Would you say that you (and you family) are better off or worse off or just the same financially as you were a year ago? Please circle your answer. BETTER OFF 42. SAME WORSE OFF Now looking ahead – do you think that a year from now you (and your family), will be better off financially, or worse off, or just about the same as now? Please circle your answer. BETTER OFF SAME Appendix A - 44 WORSE OFF 43. Due to the fact that others within your household are generally exposed to the same quality of air and environment, it is desired to match information about household exposure levels with other information about each individual’s past contacts with the health care system. In order to accomplish this, we require the personal Alberta health care number of each individual who lives with you, and signed consent. Each individual who is older than 18 must consent to allow us to use this information, and signed consent from the parent or guardian must be provided for each child younger than 18 years of age. As indicated before, all responses will be kept strictly confidential, and you may refuse to provide this information. Person 1 Person 2 Person 3 Name: Name: Name: Alberta Health Care Number: Alberta Health Care Number: Alberta Health Care Number: I do hereby freely consent to allow agents of the study to match the information collected for this study with other information about my past or future contacts with the health care system. I understand that my name will not be voluntarily disclosed, and that my name will not be referred to in anyway when compiling and evaluation the results of the study. I do hereby freely consent to allow agents of the study to match the information collected for this study with other information about my past or future contacts with the health care system. I understand that my name will not be voluntarily disclosed, and that my name will not be referred to in anyway when compiling and evaluation the results of the study. I do hereby freely consent to allow agents of the study to match the information collected for this study with other information about my past or future contacts with the health care system. I understand that my name will not be voluntarily disclosed, and that my name will not be referred to in anyway when compiling and evaluation the results of the study. Signed: Signed: Signed: Appendix A - 45 Person 4 Person 5 Person 6 Name: Name: Name: Alberta Health Care Number: Alberta Health Care Number: Alberta Health Care Number: I do hereby freely consent to allow agents of the study to match the information collected for this study with other information about my past or future contacts with the health care system. I understand that my name will not be voluntarily disclosed, and that my name will not be referred to in anyway when compiling and evaluation the results of the study. I do hereby freely consent to allow agents of the study to match the information collected for this study with other information about my past or future contacts with the health care system. I understand that my name will not be voluntarily disclosed, and that my name will not be referred to in anyway when compiling and evaluation the results of the study. I do hereby freely consent to allow agents of the study to match the information collected for this study with other information about my past or future contacts with the health care system. I understand that my name will not be voluntarily disclosed, and that my name will not be referred to in anyway when compiling and evaluation the results of the study. Signed: Signed: Signed: Thank-you for taking the time to provide this information. The study team will pick up the completed questionnaire at the next appointment time. If you have any concerns or comments please take the time to express these in the space provided below. ______________________________________________________________________________ ______________________________________________________________________________ ______________________________________________________________________________ ______________________________________________________________________________ ______________________________________________________________________________ ______________________________________________________________________________ ______________________________________________________________________________ ______________________________________________________________________________ ______________________________________________________________________________ ______________________________________________________________________________ ______________________________________________________________________________ ______________________________________________________________________________ ______________________________________________________________________________ Appendix A - 46 Time Activity Diary Instructions The Time Activity Diary is designed to enable the participant to keep track of his or her activities while wearing the personal samplers. A carefully recorded activity diary will show where the participant is at all times while wearing the sampler, identify when the participant is outside, or potentially exposed to some other source of chemical contaminant. It is very important that the participant maintains a careful record of his or her activities, and this will be time-consuming and difficult to do. You will have introduced the Time Activity Diary to the participant during the first appointment, so the second appointment will only require a review of the purpose and discussion of the amount of detail required. The interviewer's role will be to ensure that the participant has recorded his or her activities completely and accurately. The interviewer will be required to review each event recorded to ensure that the participant has not left out any critical steps. You will have to use your imagination as you follow the participant's daily activities, and identify when a participant has left anything out. For example, if you see that a participant has written that they were at work until 4:45 p.m., and then the next entry shows that they were at home, the interviewer must identify how they got home, whether by they walked or drove, and whether the participant stopped on the way home at the grocery store, dry cleaners, etc. Each activity of the day must be accounted for, but the activity list does not need to be so comprehensive that the participant needs to indicate that they got up to use the bathroom, or get a snack while watching TV. The most important concern is that they identify that they were relatively sedentary and did not leave the home. Appendix A - 47 Respiratory Health Survey AREA NUMBER __________________________________ PERSONAL NUMBER _____________________________ DATE ____________ Day ____________ Month ____________ Year I AM GOING TO ASK YOU SOME QUESTIONS. AT FIRST THESE WILL BE MOSTLY ABOUT YOUR BREATHING. WHENEVER POSSIBLE, I WOULD LIKE YOU TO ANSWER ‘Yes’ OR ‘NO’. WHEEZE AND TIGHTNESS IN THE CHEST 1. Have you had wheezing or whistling in your chest at any time in the last 12 months? NO 2. YES 1.1 Have you been at all breathless when the wheezing noise was present? 1.2 Have you had this wheezing or whistling when you did not have a cold? Have you woken up with a feeling of tightness in your chest chest at any time in the last 12 months? No Yes No Yes No Yes No Yes SHORTNESS OF BREATH 3. Have you had an attack of shortness of breath that came on during the day when you were at rest at any time in the last 12 months No Yes 4. Have you had an attack on shortness of breath that came on FOLLOWING strenuous activity at any time in the last 12 months? No Yes 5. Have you been woken by an attack of shortness of breath at any time in the last 12 months? No Yes No Yes No Yes COUGH AND PHLEGM FROM THE CHEST 6. Have you been woken by an attack of coughing at any time in the last 12 months? 7. Do you usually cough first thing in the morning in the winter? (IF DOUBTFUL USE QUESTION 8.1 TO CONFIRM) Appendix A - 48 No NO 8. YES 7.1 Do you cough like this most days for as much as 3 months each year? Do you usually cough during the day, or at night, in the winter? NO YES 8.1 Do you cough like this most days for as much as 3 months each year? No Yes No Yes No Yes 9. Do you usually bring up any phlegm from your chest first thing in the morning in the winter? (IF DOUBTFUL, USE QUESTION 10.1 TO CONFIRM) No Yes 10. Do you usually bring up any phlegm from your chest during the day, or at night, in the winter? No Yes No Yes No Yes NO YES 10.1 Do you bring up phlegm like this on most days for as much as 3 months each year? BREATHING 11. Do you ever have trouble with your breathing? NO 12. YES 11.1 Do you have this trouble A) continuously so that your breathing is never quite right? B) Repeatedly, but it always gets completely better? C) only rarely? Are you disabled from walking by a condition other than heart or lung disease? Appendix A - 49 TICK ONE BOX ONLY No Yes YES: 12.0 STATE CONDITION: NO 12.1 NO YES NO YES Are you troubled by shortness of breath when hurrying on level ground or walking up a slight hill? 12.1.1 12.1.1.1 No Yes Do you get short of breath walking with other people of your own age on ground level? No Yes Do you have to stop for breath when walking at your own pace on ground level? No Yes ASTHMA 13. Have you ever had asthma? NO YES No 13.1 Was this confirmed by a doctor Yes No Yes 13.2 How old were you when you had your first attack of asthma? YEARS 13.3 How old were you when you had your most recent attack of asthma? YEARS 13.4 How old were you when your asthma symptoms first started? YEARS 13.4 (1-6) Which month of the year do you usually have attacks of asthma? 13.4.1 January / February 13.4.2 March / April 13.4.3 May / June 13.4.4 July / August 13.4.5 September / October 13.4.6 November / December 13.5 Have you had an attack of asthma in the last 12 months Appendix A - 50 No Yes NO YES NUMBER 13.5.1 How many attacks of asthma have you had in the last 12 months? No 13.6 Yes Are you currently taking any medicines, including inhalers, aerosols or tablets, for asthma? OTHER CONDITIONS 14. Do you have any nasal allergies including ‘hay fever’? 15. Have you ever had eczema or any kind of skin allergy? 16. No Yes No Yes No Yes Are you allergic to insects stings or bites? NO YES 16.1 Which insect? _______________ 16. (2-3) What kind of reaction do you have? 17. 16.2.1 breathing difficulty, feeling faint, nausea or fever 16.2.2 redness, itching or swelling at the side of the sting 16.2.3 other: __________________________ Have you ever had any difficulty with your breathing after taking medicines? NO YES 17.1 Which medicine (s)? ___________________________________ ___________________________________ Appendix A - 51 No Yes No Yes YOUR PARENTS’ SMOKING 18 19. Did your father ever smoke regularly during your childhood? No Did your mother ever smoke regularly during your childhood or before you were born? NO or DON’T KNOW YES DON’T Yes KNOW DON’T Yes KNOW No 19.1 When your mother was pregnant in particular with you, did she TICK ONE BOX ONLY A) stop smoking during pregnancy? B) cut down or stop smoking during pregnancy? C) smoke as usual during pregnancy? D) started smoking during pregnancy E) don’t know MORE ABOUT YOURSELF 20. When were you born? DAY MONTH 21. What country were you born in? ____________________________ 22. Are you male or female? MALE YEAR FEMALE NUMBER 23. How many brothers do or did you have? (code type of interview: 1=at test center, 2=at home, 3=over telephone) Appendix A - 52 NONE NUMBER OTHERWISE 23.1 How many older brothers? 23.2 How many younger brothers? 23.3 How many of your brothers ever had asthma? 23.4 How many of your (other) brothers ever has eczema, skin or nasal allergy or ‘hay fever’? (who didn’t have asthma) NUMBER NUMBER 24. How many sisters do or did you have? NONE OTHERWISE 24.1 How may older sisters? 24.2 How many younger sisters? 24.3 How many of your sisters ever had asthma? 24.4 How many of your (other) sisters ever had eczema, skin or nasal allergy or ‘hay fever’? (who didn’t have asthma) NUMBER No 25. Did your mother ever have asthma? 26. Did your mother ever have eczema, skin or nasal allergy or ‘hay fever’? 27. Did your father ever have asthma? 28. 29. Did your father ever have eczema, skin nasal allergy or ‘hay fever’? Did you regularly share your bedroom with any older children before the age of 5 years? Appendix A - 53 DON’T Yes KNOW No DON’T Yes KNOW No DON’T Yes KNOW No DON’T Yes KNOW No DON’T KNOW Yes 30. Did you go to a school, playschool, nursery school, daycare or kindergarten with other children before the age of 5 years? DON’T No Yes KNOW 31. Did you have a serious respiratory infection before the age of 5 years? DON’T No Yes KNOW 32.1 32.2 Does being at work either make your chest tight or wheezy? No Yes No Yes Have you ever had to change or leave your job because it affected your breathing? NO YES 32.2.1 What was this job? What did this job involve? What kind of business or industry did you work for? ___________________________ ___________________________ YOUR HOME YEARS 33. How many years have you lived in your present home? 34. How many years have you in this neighborhood or community? Appendix A - 54 YEARS 35. What type of a mattress do you sleep on? 35.1 spring 35.2 water 35.3 foam 35.4 air 35.5 futon (cotton stuffed mattress) 35.6 kapok 35.7 other 42.6.8 do not use any of the above No Yes No 36. Do you sleep with the windows open at night during the winter? NO 37. YES 36.1 Do you sleep with the window open TICK ONE BOX ONLY A) all of the time? B) sometimes? C) only occasionally? D) never? Has there ever been any water damage in the building or its contents, for example, from broken pipes, leaks or floods? NO OR DON’T KNOW 38. Yes YES No DON’T Yes KNOW No DON’T Yes KNOW No Yes 37.1 Has there been any water damage in the last 12 months? Do you have a basement or cellar? Appendix A - 55 NO YES NO OR DON’T KNOW 39. YES 38.1 Does water ever collect on the basement floor? No DON’T Yes KNOW 38.2 Has this happened in the last 12 months? No Yes No DON’T Yes KNOW Has there ever been mould or mildew on any surface, other than food, inside the house? NO OR DON’T KNOW 39.1 (1-6) Which rooms have been affected? YES No Yes 39.1.1 bathroom(s) 39.1.2 bedrooms(s) 39.1.3 living room area(s) 39.1.4 kitchen 39.1.5 basement or attic 39.1.6 other: ________________ 39.2 Has there been mould or mildew on surfaces inside the home in the last 12 months? ANIMAL, DUST AND FEATHERS 40. (1-12) When you were a child did anyone in your household have any of the following pets? No 40.1 cats 40.2 dogs 40.3 horses 40.4 birds 40.5 guinea pigs 40.6 hamsters 40.7 mice (continued next page) Appendix A - 56 Yes No DON’T Yes KNOW No 40.8 rats 40.9 rabbits Yes 40.10 gerbils 40.11 ferrets 40.12 other: ____________________________________ 41. (1 – 6) When you are near animals, such as cats, dogs or horses, near feathers, including pillows, quilts or duvets, or in a dusty part of the house, do you ever… No 41.1 start to cough? 41.2 start to wheeze? 41.3 get a feeling of tightness in your chest? 41.4 start to feel short of breath? 41.5 get a runny or stuffy nose or start to sneeze? 41.6 get itchy or watering eyes? Yes TREES, GRASS, PLANTS, FLOWERS AND POLLEN 42. (1-6) When you are near trees, grass or flowers, or when there is a lot of pollen about, do you ever… No 42.1 start to cough? 42.2 start to wheeze? 42.3 get a feeling of tightness in your chest? 42.4 start to feel short of breath? 42.5 get a runny or a stuffy nose or start to sneeze? 42.6 get itchy or watering eyes? Appendix A - 57 Yes YES NO 42.6.1 42.6.1 Which time of year does this happen? No 1. winter 2. spring 3. summer 4. autumn Yes DIET No Yes 43. Have you ever had an illness or trouble caused by eating a particular food or foods? NO YES 43.1 What type of food is this? _____________________________________________ _____________________________________________ 43.2 Do you almost always have the same illness or trouble after eating this type of food? NO No Yes YES 43.3 (1-6) Did your illness or trouble include… No 43.3.1 43.3.2 43.3.3 43.3.4 43.3.5 43.3.6 a rash or itchy skin diarrhea or vomiting runny or stuffy nose severe headaches? breathlessness? other: _________________ Appendix A - 58 Yes SMOKING 44. No Yes Have you ever smoked for as long as a year? (“yes” means at least 20 packs of cigarettes or 12 oz (360 grams) of tobacco in a lifetime, or at least one cigarette per day or one cigar a week for one year) YEARS NO YES 44.1 How old were you when you started smoking? No Yes 44.2 Do you now smoke, as of one month ago? NO YES 44.2.1 How much do you now smoke on average? NUMBERS A) cigarettes a day B) cigarillos a day C) cigars a week D) pipe tobacco week/ounces E) pipe tobacco weeks/grams No 44.3 NO Yes Have you stopped or cut down smoking? YEARS YES 44.3.1 How old were you when you stopped or cut down smoking? 44.3.2 44.4 On average of the entire time you smoked or cut down, how much did you smoke? A) cigarettes a day B) cigarillos a day C) cigars a week D) pipe tobacco week/ounces E) pipe tobacco weeks/grams Do you or did you inhale the smoke? Appendix A - 59 NUMBERS No Yes MEDICINES AND INHALERS 45. Have you used any inhaled medicines to help your breathing at any time in the last 12 months? NO YES ______________________________________________ ______________________________________________ ______________________________________________ ______________________________________________ ______________________________________________ Have you used any pills, capsules, tablets or medications other than inhaled medicines, to help your breathing at any time in the last 12 months? NO YES No _________________________________________________ _________________________________________________ _________________________________________________ _________________________________________________ _________________________________________________ Have you received allergy shots at any time in your life? No NO 48. Yes 46.1 List these pill, capsules, tablets or medicines: 1. 2. 3. 4. 5. 47. Yes 45.1 List the names of the inhaled medicines: 1. 2. 3. 4. 5. 46. No YES 47.1 Have you received allergy shots in last 12 months? Have you had any other injections to help your breathing at any time in the last 12 months? NO YES Yes DON’T KNOW No Yes No Yes 48.1 What injection(s)? 1. 2. ______________________________________________ ______________________________________________ Appendix A - 60 49. Have you used any suppositories to help your breathing at any time in the last 12 months? NO 50. YES 50.1 1. 2. YES 51.1 1. 2. YES 52.1 1. 2. No Yes What remedies? ______________________________________________ ______________________________________________ No Yes Which drugs? ______________________________________________ ______________________________________________ Do you take any drugs only for attacks of breathlessness? NO Yes What suppositories? ______________________________________________ ______________________________________________ Do you take drugs every day to help your breathing even if you don’t feel short of breath? NO 52. 49.1 1. 2. Have you used any other remedies to help your breathing at any time in the last 12 months? NO 51. YES No No Yes Which drugs? ______________________________________________ ______________________________________________ 52.2 Do you take these drugs? A) at the onset of the attack? B) only when the attack becomes more severe? Appendix A - 61 TICK ONE BOX ONLY 53. NO Has your doctor ever prescribed medicines, including inhalers for your breathing? YES 53.1 If you are prescribed medicines for your breathing, do you normally take A) all of the medicine? B) most of the medicine? C) some of the medicine? D) none of the medicine? 53.2 When your breathing gets worst, and you are prescribed medicines for your breathing do you normally take A) all of the medicine? B) most of the medicine? C) some of the medicine? D) none of the medicine? No Yes TICK ONE BOX ONLY TICK ONE BOX ONLY 53.3 Do you think it is bad for you to take medicine all the time to help you breath? No Yes 53.4 Do you think you should take as much medicine as you need to get rid of all your breathing problems? No Yes 54. Have you ever visited the nursing station after hours because of breathing problems? No Yes 55. Have you ever spent a night in the hospital because of breathing problems? No Yes NO YES 55.1 How many times in the last 12 months? Appendix A - 62 TIMES 56. Have you ever been seen by a doctor, because of breathing problems or shortness of breath? NO YES No 56.1 When was the last time you were seen by a doctor because of breathing problems or because of shortness of breath? TICK ONE BOX ONLY A) within the last 7 days? B) more than 7 days ago but within the last 4 weeks? C) more than 4 weeks ago but within the last 12 months? 56.2 Where were you seen? A) by a GP at home B) by a GP in his office C) by a specialist at home D) by a specialist in his office or hospital outpatient department E) in an emergency room F) admitted to hospital TICK ONE BOX ONLY THE END THANK YOU VERY MUCH FOR YOUR PARTICIPATION Appendix A - 63 Yes Spirometry Instructions 1. Plug in computer, plug in adapter as well. 2. Turn computer power on, (left-hand side of laptop, push button in and hold for 2 secs.) 3. Once in DOS, plug cord into hand held spirometer. 4. Type “cd dx” and press “Enter”. This should take you to C:/dx. 5. Type "dx" and wait until program loads. 6. Once inside computer check to see if green light is on (located in the top right hand corner). Green light indicates that the spirometer and computer are communicating. If a red light appears reboot computer because the com ports are not responding. 7. Go to F7 and select “calibrate the sensor” (located at bottom of list). 8. Once the unit is calibrated successfully, go to F1 and select “Get Patient Data File”. 9. Once the patient is loaded, go to F2 and select “FVC test” and hit “Enter”. 10. Once a test is complete, follow instructions to get out of the data file. 11. Once you have returned to the main screen go to Fl and select “save patient data file”. 12. Repeat steps 9-11 until the 5-6 spirometry trials are complete. 13. Before exiting, go to F5 and copy data to disc. Choose “COPY FROM DEFAULT DRIVE/DIRECTORY TO FLOPPY A:” 14. To exit go to “EXIT TO DOS”. Once you have returned to DOS, you may turn off power. Appendix A - 64 Lung Function Testing Form Participant ID # __________ Session # Date Time Start Time Finish Field Worker Date Time Start Time Finish Field Worker Date Time Start Time Finish Field Worker Date Time Start Time Finish Field Worker Date Time Start Time Finish Field Worker Comments Session # Comments Session # Comments Session # Comments Session # Comments Appendix A - 65 Urine and Blood Instructions The urine sample is a continual 12 hour sample, and must begin on the night the bottle is received and stopped when the 12 hour period is complete (e.g., 7:00pm begin, 7am stop) Between contributions we ask if you can keep the bottle in the refrigerator. Before the scheduled blood appointment, please fill out the circled information on the provided blood requisition form. When going for the blood appointment we ask if you can please take the urine bottle along with the blood requisition form provided to the lab at the Northern Lights Regional Health Authority (Hospital). ***Note: Females are asked to give a urine sample prior to or following menstruation*** Thank you for your cooperation, your participation is greatly appreciated! Field Study Coordinator Appendix A - 66 Instructions for Trace Elements in Urine Appendix A - 67 Instructions for Trace Elements in Blood Appendix A - 68 Confirmation of Biological Sampling Log Sheet Sample # PID# Name Suggested Blood Appointment Date Appendix A - 69 Blood Appointment Date Urine Received (Check if yes) Source Date Confirmed by (initials) Data Control Form Participant ID#: _____________ Neurocognitive Testing Date Completed Date Issued Interviewer Date Received Comments Glasses / Contacts: o Near-sighted o Far-sighted o Currently wearing Team Member(s) Received By Comments Demographic Questionnaire Health & Nutrition Field Appt. # 1 2 Data Instrument Original Deployment TAD Date Completed Date Received N/A Team Member(s) Received By Passives Particulates Lung Function 3 TAD Passives Particulates Lung Function 4 TAD Passives Particulates Lung Function 5 TAD Passives Particulates Lung Function Water (Routine) Water (TM) Urine Biological Sample # Suggested Appt. Date Confirmed Appt. Date Confirmation for receipt of urine (initial if yes) Appendix A - 70 Confirmation Source (name) Confirmation Date Confirmed By Procedures for Field Monitoring Teams Initial Appointment: 1) Arrive at study office to pick-up prepared packages. 2) Travel to first participant's home. 3) Introduce team members to participant. 4) Survey participant's house and yard. 5) Sketch map of house, yard, and indicate placement of all samplers: • Indoor: note location of kitchen, living room, dining room, doors, windows, sofa, chair, stove, table, etc. • Outdoor: note which direction the front of the home faces and sketch in the road(s), trees, garden, shed, garage, etc. • mark all sampler locations with an "X" 6) Place personal samplers according to protocols. 7) Place indoor samplers according to protocols. 7) Place outdoor samplers according to protocols. 8) Explain to the participant instructions for collecting urine sample. 9) Explain to the participant how to complete the Time Activity Diary. 10) After all appointments are completed return to study office with completed study materials. 11) Return tubs with empty sampling containers to drop-off location. 12) Key log sheets into database. Remaining Visits: 1) Arrive at study office to pick-up prepared packages. 2) Travel to first participant's home. 3) Greet participant. 4) Gather all exposed samplers. 5) Place exposed samplers into corresponding containers according to protocols. 6) Place containers into empty tub and set aside. 7) Place new samplers as described in initial visit procedure. 8) Retrieve urine sample. 9) Retrieve Time Activity Diary. 10) Retrieve questionnaires. 11) Thank participant and repeat steps 10 through 12 in initial visit procedure. Appendix A - 71 Floor Plan Participant ID #: __________ Date: __________ Appendix A - 72 Passive Sampling Field Data Log Sheet Participant ID #: Start Date: Submitted by Field Team Members: End Date: Personal Sampler ID #: Received by: NO2 SO2 O3 VOCs place sticker here place sticker here place sticker here place sticker here place sticker here place sticker here place sticker here place sticker here place sticker here place sticker here place sticker here place sticker here place sticker here place sticker here place sticker here place sticker here Start Time: End Time: Comments: Indoor Sampler ID #: Start Time: End Time: Comments: Outdoor Sampler ID #: Start Time: End Time: Comments: Blank Sampler ID #: Comments: Appendix A - 73 Air Particulate Sampling Field Data Log Sheet Participant ID #: Start Date: Field Team: Filter ID Location place sticker here Personal place sticker here Personal place sticker here place sticker here Indoor Indoor place sticker here Outdoor place sticker here Outdoor place sticker here Blank* End Date: PM 2.5 PM 10 2.5 Black 10 Yellow 2.5 10 2.5 Red 10 Gold Start Time hh:mm Target Flow Rate, L/min Start Flow Rate, L/min End Flow Rate, L/min End Time hh:mm 4.15±0.1 4.15±0.1 5.18±0.1 5.18±0.1 10.37±0.1 10.37±0.1 place sticker here place sticker here * Indicate sampler type of Blank (MP, MPP, MV, or DC) and whether it is a PM 2.5 or PM 10 sampler. Sampler Types: MP: Marple Outdoor Sampler (37 mm filter) MPP: Marple Personal Sampler (37 mm filter) MV: Minivol Indoor Sampler (47 mm filter) Received by: DC: Dichotomous Sampler (37 mm filter) Appendix A - 74 Comments Particulate Sampling Instructions & Tips • blank particulate head to be sent out every second day (two blanks per person throughout a four day sampling period); doesn't matter what type of blank (i.e., personal or minivol) or what particulate size (i.e., 2.5 or 10), but the type (i.e., personal, indoor, outdoor), colour, and particulate size should be recorded on the field data log sheet. Requirements: Indoor/Outdoor Monitors: • two carrying containers (blue coolers) • one containing empty particulate containers with appropriate packing material and data sheet • one containing new particulate head, blank particulate head (if required), and new data sheet; large elastics kept in flow meter carrying case to fasten blank • two recharged minivol batteries • flow meter (see below for further instructions on flow meter); should be recharged • extension cord will be required to complete outdoor particulate sampling Personal Monitors: • personal pump c/w carrying case, two straps (waist and shoulder) • two batteries (new ones required every 48 hrs.) • flow meter (see below for further instructions on flow meter) • screwdriver for adjusting flow (kept in flow meter carrying case) NOTE: Personal pump counters should be reset each time, thus the “start time on counter” box on log sheets should be 0 min. (Note: Paper clip or pin works best to reset.) NOTE: Masking tape or some other method will have to be used to ensure that the personal pump switch remains in an “on” position. NOTE: After any particulate sampling is complete, all personal pump heads should be placed in a face-up (i.e., holes facing top-side) position, wrapped in it's plastic bag; after being wrapped appropriately in the plastic bags provided, indoor particulate heads should be placed with the white rain cap top-side, in a secure position, held in place with packaging materials (air-filled ziploc bags seem to fill empty cooler space well). It is important to keep the particulate heads and filters in upright positions at all times! Appendix A - 75 Troubleshooting Low Flow Rates: A) If you are obtaining low flow rates with the Minivol (indoor) units, here are a few things to look for: 1) The Minivol (indoor) particulate units have three settings: ON, AUTO, and OFF. Ensure that the unit is in the ON (not AUTO) mode. Also ensure when tearing down the particulates that the unit is turned to OFF mode and then taken off the batteries. 2) Check all attachments, tubes (i.e., kinks), and ensure that batteries have been exchanged with the recharged ones. All tubing used should be checked periodically for permanent kinks, cracks, or looseness. Make note of these and have the study office replace these immediately. 3) Detach the indoor particulate head and attempt to rotate the base of the head (i.e., turn the clear plastic portion counter-clockwise if held in upright position). This may tighten up the unit, which may result in a slightly higher flow. The study office has attempted to pre-tighten the heads but it is a good to double-check that this has been done. 4) The Minivol (indoor) particulate units have a black button on the right-hand side that is labelled “RESET” (in blue lettering below the indented button). Press this button if receiving abnormal or no flow. It may (or may not) resolve the problem. B) If you are obtaining low flow rates with the outdoor particulate units, here are a few things to look for: 1) Check all attachments, tubes (i.e., for kinks and twisting), and ensure that BOTH motors are running properly. Feel the motor (NOTE: Not for too long though ... they get extremely hot!). The vibrations should be quite evident. Also ensure a secure connection between the particulate tubing and the particulate filter -- some extra tubing should be provided in the flow meter kit to make any alterations that are necessary. 2) If the motors do not appear to be running at all try the reset breaker button. Also check the extension cord connection(s). When turning the knob to adjust the flow ensure that the bottom is not turning -- not only will the flow not get any higher (of course), but the tubing may twist and deform or kink. Battery Recharging: • • • minivol (large, white) batteries to be charged every 24 hours for at least 3 hours (no maximum recharge time, so can stay on recharger when now in use) AA batteries inside minivol samplers may need to be replaced occasionally (one/unit) personal pump batteries (sticks) to be replaced every 48 hours (used ones to be marked and set aside) Appendix A - 76 Flow Meter: • • • • • • use flow meter to check the flow of all particulate and personal pump units can be kept on charger when not in use (no maximum recharge time) do not reset pump meter every time until target flow is reached; once target flow is reached, reset flow meter (i.e., by holding reset button until old data cleared), then take 5-10 readings and take the average reading if all readings are appropriate (i.e., no double bubbles, no popping half way up, etc.) to obtain best results with flow meter gently press button and hold; initial bubble should start; once bubble reaches top gently release button and another bubble should immediately start if problems obtaining bubbles, gently nudge the base of the flow meter; if problem persists, ensure that enough bubble solution exists (Note: Too much solution may also cause problems - double bubbles.) ensure that bubble solution does not collect excessively in top compartment of flow meter; due to the fact that the flow meter is running and the particulate head is attached while checking flow, there is a slight possibility that some of the solution may be sucked up Appendix A - 77 Ambient Station Log Sheet Start Date: _____________________ Field Team Members: ________________ End Date: _____________________ Received By: NO2, SO2, O3, and VOC Field Data Log Sheet: Ambient Station Sampler ID #: NO2 SO2 O3 VOCs place sticker here place sticker here place sticker here place sticker here Start Time: End Time: Comments: Dichotomous Sampler Field Data Log Sheet: Ambient Station Filter ID # PM 2.5 PM 10 Start Time on Counter Target Flow Rate, L/min 2.5 - White 17.32 10 - Yellow 1.73 Start Flow Rate, L/min End Flow Rate, L/min Appendix A - 78 End Time on Counter Comments Cascade Impacter Field Data Log Sheet Submitted by :____________________ Received by:____________________ Start Date: _______________ Start Time: _______________ Target Flow: 28.3 L/min Start Flow: _______________ COMMENTS: Submitted by :____________________ Received by:____________________ End Date: _______________ End Time: _______________ Target Flow: 28.3 L/min End Flow: _______________ COMMENTS: Appendix A - 79 Appendix B A Collocation Study to Evaluate Samplers Used for Collecting Airborne Particulate Matter Prepared for Alberta Health & Wellness by: Shaole Wu and Xinbang Feng Analytical Chemistry Alberta Research Council Bag 4000 Vegreville, Alberta Canada T9C 1T4 & Dennis Prince Water West Consulting November 2, 1998 Summary A collocation study to evaluate the performance of samplers for collecting airborne particulate matter (PM) was carried out in December 1996. These samplers, including MINIVOL Portable Samplers (Airmetrics) and the Personal Environmental Monitors (PEMTM, MSP Corporation), were used in a pilot study of the Alberta Oil Sands Community Exposure and Health Effects Assessment Program conducted in September and October of 1996. Either PM2.5 or PM10 airborne PM samples were collected to evaluate the effect of relative humidity used for filter conditioning on PM mass measurements. PM masses were determined after sample conditioning for 24 hours at relative humidity of 50, 35, 25 and 15%, respectively. The analytical results showed that the PM mass decreased about 8% when the relative humidity changed from 50% to 15%, while 3% portion of the mass could not be recovered when relative humidity increased back to 50% from 15%. By using an electronic micro-balance (CAHN C-30), the precision of PM mass measurement was evaluated in this study. The PM mass measurement could be affected by a maximum of 2% for the samples if the relative humidity for conditioning is controlled within 5% in the range of 30-40%. The instrument detection limit for the mass measurement is 5 µg, while the method detection limit is 20 µg. The MINIVOL and PEMTM samplers were compared each other for PM2.5 and PM10 measurement, and the results were highly correlated. The MINIVOL and PEMTM samplers were also comparable to the dichotomous reference sampler for PM10 measurement. Introduction Airborne particulate matter (PM) is one of the air quality parameters monitored in the Alberta Oil Sands Community Exposure and Health Effects Assessment Program. In the pilot study of this program conducted in September and October of 1996, the MINIVOL Portable Samplers (Airmetrics) and the Personal Environmental Monitors (PEMTM, MSP Corporation) were used to collect PM2.5 and PM10 samples for evaluating personal exposure and/or indoor and outdoor air quality. Later in December 1996, a simple collocation study was carried out to evaluate the performance of these samplers for PM measurement. This report documents the results of the study. The objectives of the collocation study were: i) To evaluate the effect of relative humidity used for filter conditioning on PM mass measurements. ii) To assess the precision of PM mass measurement. iii) To evaluate the comparability of the MINIVOL and PEMTM samplers used in the pilot study to the reference or equivalent method devices, such as the dichotomous sampler or other samplers. Experimental Samplers Samplers used in the collocation study were MINIVOL portable samplers, PEMTM samplers, a dichotomous sampler, a size-selective-inlet (SSI) high volume sampler and a TEOM sampler. Only the first two sampler types were used in the pilot study. The TEOM sampler is the U.S. EPA equivalent sampling device for PM10. The SSI high volume and the TEOM samplers are the U.S. EPA reference sampling devices for PM10. The MINIVOL Portable Sampler The MINIVOL portable samplers used were made by Airmetrics (Springfield, OR, USA). This active sampler is operated by the principle of inertial impaction using a single stage impactor with an after-filter. Appendix B - 1 Figure 1. Schematic view of the MINIVOL sampler head. In this device, a pump is used to maintain a constant air flow at a design rate through the impactor and filter, the particle-laden air is accelerated through one nozzle and the exiting jet impinges upon a plate. The large particles cross the air streamlines and impact on the plate due to their inertia, while the small particles are carried along the air streamline and are collected on the after-filter. The mass collected on the preweighed filter is then determined by the gravimetric method in the laboratory. The inlet impactor is capable of removing particles larger than the cut points of either 10 µm or 2.5 µm in aerodynamic diameter (50% effective). The method used in this sampling device is a modification of the standard PM10 reference method outlined in the Code of Federal Regulations (40 CFR 50, Appendix J). The sampler meets the specifications in the Code on the air-inlet system, flow control device, flow rate measurement means and timing control device. However, it is operated at a constant volumetric flow rate of 5 L/min at ambient conditions, which is generally less than the flow rates used by a reference method device. Due to its low flow rate of 5 L/min and the low noise from its pump, MINIVOL samplers with both the PM10 and PM2.5 inlet impactors were used in the pilot study to measure the indoor (inside the residence) PM10 and PM2.5 concentrations, respectively. The PEM™ Sampler The Personal Environmental Monitors (PEMTM, Model 200) used were made by MSP Corporation (Minneapolis, MN, USA). This miniature active sampler is also operated by the principle of inertial impaction, using a single stage impactor with an after-filter (Fig. 2). The impactor used in the PEMTM sampler consists of 10 round nozzles located in a circle near the outer edge of the cover and a doughnutshaped impaction surface. The sampler can be operated at an evacuating volumetric flow rate of 2.0, 4.0 or 10.0 L/min at ambient conditions, each with an impactor at a PM cut point of either 10 µm or 2.5 µm aerodynamic diameter. The mass collected on the pre-weighed filter is then measured by the gravimetric method in the laboratory. The PEMTM sampler is not a reference or equivalent method device. The flow rates used are much less than those used in reference method devices and the sampler is not equipped with a mean of flow rate measurement or a timing control device. However, it was claimed that results for PM10 were comparable to those obtained with the reference methods (Bukley, et al., 1991; Lioy, et al., 1988). Appendix B - 2 Figure 2. Schematic view of the Personal Environmental Monitor (PEMTM). The PEMTM samplers with the evacuating volumetric flow rate of 10 L/min with either PM10 or PM2.5 inlet impactors were used in the pilot study to collect the outdoor (outside the residence house) and the ambient (at the local ambient air quality monitoring stations) PM samples. The PEM TM samplers with the evacuating volumetric flow rate of 4 L/min with either PM10 or PM2.5 inlet impactors were used to collect the personal PM exposure samples. Appendix B - 3 The Dichotomous Sampler The dichotomous sampler, Series 244, made by Graseby-Anderson (Smyrna, GA, USA), was used in this collocation study. The sampler collects simultaneously the fine size fraction, i.e.PM2.5 with an aerodynamic diameter up to 2.5 µm, and the coarse size fraction, i.e. PM2.5-10 with an aerodynamic diameter greater than 2.5 µm and up to 10 µm. This sampler was designated by U.S. EPA as the reference method for PM10 measurements (Federal Register, 1989). Figure 3. Schematic diagrams of a dichotomous sampler: (a) PM10 inlet, (b) PM2.5 virtual impactor assembly. The dichotomous sampler consists of a PM10 inlet (Fig. 3a), a PM2.5 virtual impactor assembly (Fig. 3b) and a control module. Particulate matter in the ambient air enters the inlet at a total evacuating volumetric flow rate of 16.7 L/min. This flow rate provides a force balance so that the upward velocity is equal to the settling velocity of a 10 µm particle. Only particles with an aerodynamic diameter equal to or less than 10 µm are drawn into the virtual impactor. Through the accelerating nozzle, the coarse particles (i.e. PM.2.5-10) together with one tenth of the fine particles (i.e. PM.2.5) are collected onto one pre-weighed filter at an evacuating flow rate of 1.67 L/min. And nine parts of the fine particles are collected on another pre-weighed filter at an evacuating flow rate of 15 L/min. The PM10 mass concentration is calculated as: ([mass of coarse PM] + [mass of fine PM])/ ([total flow rate] * [collection time]), and the PM2.5 mass concentration is calculated as: [mass of fine PM] / ([flow rate for fine PM] * [collection time]). Appendix B - 4 The Size Selective Inlet (SSI) High Volume Sampler Figure 3: Schematic illustration of a high volume sampler with a size selective inlet (SSI). The PM mass concentrations collected by the sizeselective-inlet (SSI) high volume sampler, Model 1200, was made by Graseby-Andersen (Smyrna, GA, USA). This sampler was designated by U.S. EPA as the reference method for PM10 measurement (Federal Register, 1987) and has been operated at Alberta Environmental Protection’s (AEP) Edmonton Northwest Monitoring Unit (ERMU) for many years. The SSI sampler was designed to provide a wind direction and wind speed insensitive (up to 20 km/hr) PM cut point of 10 µm. In this sampler, particulate matter in the air entering the buffer chamber is evacuated at a volumetric flow rate of 1130 L/min (±10%) through the acceleration nozzles. Particles greater than 10 µm in aerodynamic diameter strike the impaction plate, and smaller particles are deposited onto the pre-weighed filters (Fig. 4). The TEOM Sampler The PM mass concentrations was also measured by a TEOM Series 1400 sampler equipped with the PM10 inlet made by Rupprecht & Patashnick Co. Inc. (Albany, NY, USA). This sampler was designated by U.S. EPA as an equivalent Method for PM10 measurement (Federal Register, 1990) and has been operated at AEP’s Edmonton Northwest Monitoring Unit (ERMU) since November 1993. The measurement principle of the TEOM sampler is based on the patented Tapered Element Oscillating Microbalance. In the sampler (Fig.5), a sample air stream at the volumetric flow rate of 16.7 L/min is drawn through the PM10 inlet. Then, a part of the PM10 stream, at the volumetric flow rate of 3 L/min, is passed through a TEOM filter mounted on the end of a hollow tapered tube. As particulate mass accumulates on the filter, the tapered tube’s natural frequency of oscillation decreases. The change in frequency is monitored every two seconds and the total mass of particles deposited is determined. Figure 3: Schematic diagram of the TEOM sampler. To ensure temperature stability and that the dew point of the ambient air is always exceeded and the sample stream consists of “dry” air, the mass transducer section of the TEOM® sampler is usually maintained at a fixed temperature environment of 30 or 50 °C, or a pre-selected temperature. The realtime mass change is combined with the precisely controlled sample flow rate to yield an accurate and continuous measurement of the particulate mass concentration. At AEP’s Edmonton Northwest Monitoring Unit, hourly PM10 mass concentrations were continuously measured by the TEOM® sampler. During this study, the mass transducer section was maintained at 50 °C and the instrumental setting for ambient temperature was set at 15 °C. Appendix B - 5 Filter Media The filters used in the dichotomous, PEMTM and MINIVOL samplers were 37 and 47 mm diameter Teflo filters (polymethylpentene ring supported Teflon membrane) with 2 µm pore size, made by Gelman Science Inc. (Montreal, Canada). The 37 mm (R2PJ037) filters were used for the dichotomous and PEMTM samplers and the 47 mm (R2PJ047) filters were used for the MINIVOL samplers. The filters used in the SSI sampler are 8x10 inch Teflon-coated glass fiber filters, Emfab TX40HI20WW from Pallflex (Putnam, CT, USA). The filter medium layer is composed of pure borosilicate microglass fibers. Extra fine woven glass cloth is added for reinforcement. The two materials were bonded together by Teflon, which is cured at over 700 °F, simultaneously being cleaned by heat. The material is then flushed a number of times with deionized water to remove any water-soluble residue. The filter medium layer of the TEOM® filter cartridge is also made from the Teflon-coated borosilicate microglass fiber filters, Emfab TX40HI20WW from Pallflex. The filter cartridge support is made of aluminum foil. Sample Collection This study was performed during December 11-16 of 1996 at AEP’s Edmonton Northwest Monitoring Unit (ERMU) located at 127 street and 133 avenue. Six PEMTM (10 L/min), two personal PEMTM (4 L/min), six MINIVOL samplers and one dichotomous sampler were set up on the roof of the station (Fig. 6) beside AEP’s regular monitoring samplers: one TEOM® (PM10) sampler and one SSI (PM10) high-volume sampler. Figure 4: Field operation of the collocation study. The number of samples collected using each type of sampler in this study is listed in Table 1. This study was targeted at a minimum sample set of 5 for a simple statistical evaluation, which was however not achieved for PEMTM with a flow rate of 4 L/min. It was decided that if the variations in the results were too large due to small sample sizes, supplemental data would be collected later. The first two days were also aimed to collect data for the evaluation of gravimetric measurement precision and the effect of relative humidity applied for filter conditioning on mass measurement. The replicate samples collected with Appendix B - 6 MINIVOL and PEMTM samplers were used to compare the chemical compositions analyzed by ED-XRF and ICP-MS, which will be reported elsewhere. The sample collection duration ranged from 15 to 26 hours, with the majority of samples collected in about 24-hour periods (Appendix 1). Table 1: Samples collected Dichot Date/Day 11/12 (Tue) 12/12 (Wed) 13/12 (Thu) 14/12 (Fri) 15/12 (Sat) Total (16.7 L/min) SSI MINIVOL PEMTM PEMTM TEOM (5 L/min) (10L/min) (4 L/min) (3 L/min) (1130 L/min) PM10 1 1 1 1 1 5 PM10 1 1 1 1 1 5 PM10 PM2.5 PM10 PM2.5 PM10 PM2.5 PM10 PM2.5 1 1 3 6 1 1 6 6 1 1 1 3 3 6 1 1 1 1 3 3 3 3 1 1 1 1 3 3 3 3 1 1 5 5 15 12 18 12 4 3 Total 13 17 18 18 18 84 Flow Rate and Flow Rate Measurements Except for the PEMTM samplers, all samplers have their own flow rate control and measurement device. The volumetric flow rates for the PEMTM samplers were measured with a bubble meter, Gilian Gilibrator-2 calibration system made by Sensidyne (Clearwater, FL, USA). The volumetric flow rates of the MINIVOL samplers were also measured with this device. The actual flow rates applied were adjusted to standard conditions (at 298 K and 1 atmosphere) according to the daily average temperature and barometric pressure at the Municipal Airport in Edmonton, provided by Environment Canada. Mass Measurement As mentioned previously, the PM masses collected by the TEOM® sampler were measured by the internally installed Tapered Element Oscillating Microbalance at a constant temperature of 50°C. The unloaded and loaded Teflo filters used for the PEMTM, MINIVOL and dichotomous samplers were weighed by an electronic micro-balance, CAHN C-30 from CAHN Instrument Company (Paramount, CA, USA), with the mass range of 0.001-200 mg and the minimum readability of 1 µg. The balance was located inside a chamber with constant humidity (45±1%) and temperature (23±3 °C), and a polonium 210 (210Po) radioactive source was located within the balance housing to remove electrostatic energy from filters. Prior to the measurements, the unloaded or loaded Teflo filters were conditioned (i.e. equilibrated) for 24 hours at a constant temperature of 23±3 °C and a constant humidity of 45±1%, unless specified otherwise. The unloaded and loaded SSI filters were weighed using a top-loading balance with the mass range of 0.1-10 g and the minimum readability of 0.1 mg. Prior to the measurements, the unloaded or loaded filters were conditioned for 24 hours at a constant temperature of 23±3 °C in a desiccator. In the gravimetric methods, standard weights and control blanks were weighed periodically to verify precision and accuracy of the microbalance. To study the effect of the relative humidity levels used during filter-conditioning on the PM mass measurement, six unloaded Teflo filters were weighed after conditioning at a constant temperature of 23±3 °C and relative humidity of 50, 40, 30, 25, and 15%, respectively, for 24 hr. The loaded filters were re-weighed after conditioning at the corresponding relative humidity for 24 hr. The order of relative humidity used prior to weighing was 50, 40, 30, 25, 15 and 50%. Appendix B - 7 Mass Concentration Calculations For this study, the measured volumetric flow rate was used to calculate the mass concentration, except for samples collected by the TEOM sampler. The TEOM sampler automatically calculates hourly and 24hour averaged mass concentrations, based on the volumetric flow rate at standard conditions (i.e. at 298 K and 1 atmosphere). Results and Discussion The PM masses and mass concentrations together with the sample collection parameters are listed in Appendix 1. Several data are flagged due to contamination of the loaded filters, and were not included for the evaluation. Effect on Mass Measurement of Relative Humidity Used for Filter Conditioning One of the requirements in the guideline for PM10 sampling and analysis applicable to receptor modeling (U.S. EPA, 1994) is to condition the filter for 24 hours at a constant relative humidity (RH) within ±5% between 20 and 45%, prior to mass measurement. In the National Air Pollution Surveillance (NAPS) program conducted by Environment Canada, filters were conditioned at a constant RH of 43±5% (Danta, T., 1994). In the West Central Airshed Zone monitoring program, filters have been conditioned at a RH value of 50% (Peake, E., personal communication, 1996). The average ambient RH in the past 10 years at Fort McMurray, where the pilot study was carried out, was about 55% (Environment Canada, 1996). Based on the above information, an RH value of 45% was selected for conditioning the Teflo filters in the pilot study. With an in-house-made device, the variation of the RH value was controlled within 1%. Figure 5: The Effect of Relative Humidity Applied during the 24-hr Filter Equilibrium Period on the Mass of Airborne Particulate Matter (n=11 for PM2.5 and n=9 for PM10) In order to understand the comparability of the PM mass data obtained at different relative humidity 1 values used for conditioning the filter, collocated 100 PM filter samples were measured for masses, after conditioning at several relative humidity 98 5 values ranging from 50% to 15%, each for a 242 96 hour period. The normalized (to the mass 3 measured at 50% RH) average data vs. RH are 94 plotted in Figure 7, where the error bars represent 4 92 the uncertainties at the 95% confidence level. These error bars for the PM10 measurement are 90 much smaller than those for PM2.5 measurement. 10 15 20 25 30 35 40 45 50 55 Figure 7 shows that when the RH decreased from Relative Humidity (% ) 50% to 15%, the PM masses decreased by about 8% on average. However, when the RH value PM10 PM2.5 PM10 re-equilibrium PM2.5 re-equilibrium increased back to 50% from 15%, 5% of the mass, which was previously lost, were recovered, most likely, by water vapor. The other 3% of the mass lost could not be recovered. Percentage of Normalized Mass (%) 102 In the recent U.S. EPA final rule for the ambient PM2.5 reference method (Federal Register, 1997), filters must be conditioned at constant relative humidity within 5% between 30 and 40% RH. The corresponding mass variations obtained from Fig. 7 were within 2%. Measurement Precision for PM Masses and Mass Concentrations Factors affecting the precision for the measurements of mass concentrations include variations in collection efficiencies among samplers, uncertainties in gravimetric measurement, possible filter contamination, variation in flow rates, differences in PM cut points due to deviation of the flow rates from Appendix B - 8 the designed value, etc. The U.S. EPA reference method for PM10 requires that the measurement precision determined by repeated collocated sampling should be within ±5 µg/m3 for concentrations less than 80 µg/m3 or ±7% of measured PM10 for concentrations exceeding 80 µg/m3 for a 24-hour period (Chow, 1995). The measurement precision with MINIVOL and PEMTM samplers, expressed as the percentage relative standard deviation (%RSD), is presented in Table 2 and plotted in Fig. 8. The %RSD values of the flow rates among the collocated samplers are also listed in Table 2. Because %RSD values of the flow rates are generally much lower than the corresponding %RSD values of the PM concentrations, variations in flow rates were not considered to be the major contributor for the observed mass concentration variations. The %RSD of the mass concentrations increased rapidly as the masses or the mass concentrations decreased to or below the detection limit of the corresponding sampler (Fig. 8). In all cases, the measured PM10 or PM2.5 concentrations were less than 80 µg/m3 and the precision at the 95% confidence level was within ±5 µg/m3. Table 2: Percentage relative standard deviation of mass concentrations measured Sampler PM Size (µm) n Mean Mass (mg) Flow Rate Mean (L/min) %RSD MINIVOL 2.5 3 0.274 5.13 2.7 MINIVOL 2.5 2 0.116 4.86 0.3 MINIVOL 2.5 3 0.045 4.73 0.7 MINIVOL 2.5 3 0.032 4.64 1.1 MINIVOL 10 6 0.233 4.82 0.5 MINIVOL 10 3 0.117 4.89 1.1 MINIVOL 10 3 0.052 4.80 2.2 MINIVOL 10 3 0.015 * 4.64 3.2 PEMTM 2.5 6 0.530 10.22 2.2 PEMTM 2.5 2 0.046 10.19 5.8 PEMTM 10 6 0.536 9.45 2.8 PEMTM 10 6 0.210 9.08 4.1 PEMTM 10 3 0.123 9.63 1.5 PEMTM 10 3 0.034 10.13 1.2 * Above the instrument detection limit, but below the method detection limit. Mass Concentration Mean (µg/m3) 36.0 21.8 8.7 5.1 33.2 25.6 10.0 2.4 * 34.9 3.3 36.6 24.7 12.0 2.5 %RSD 7.4 12.8 5.1 32.7 2.9 3.9 8.4 109.2 1.7 15.4 2.1 8.4 4.0 20.2 The instrumental detection limit (DL) for the mass measurement of Teflo filters (37 mm or 47 mm in diameter) was 5 µg, derived from three times the standard deviation for the measurement of a blank filter (n=10). The method detection limit (MDL) for the mass measurement of Teflo filters (37 or 47 mm in diameter) was 20 µg (Table 5), which was derived from the pilot study from three times the standard deviation of the measurement for field blank filters (n=10). The field blanks were loaded and exposed for up to the maximum of 60 min without drawing air through the sampler. The MDLs for the masses or mass concentrations may also be estimated from Fig. 8a and 8b, respectively. To do so, the PM10 and PM2.5 data for the same samplers were first combined together to increase the data sizes. Then, power curves were fitted to the corresponding data for MINIVOL and PEMTM samplers, respectively. The MDL value is the mass value or the mass concentration corresponding to the RSD value of 33.3%. In spite of the small data sizes, MDL values for mass measurement derived from Fig. 8a (column B of Table 3) are in good agreement with those obtained from gravimetric measurements (column A of Table 3). Similarly, MDL values for mass concentrations derived from Fig. 8b (column E of Table 3) are in good agreement with those calculated from gravimetric measurements (column C of Table 3). Appendix B - 9 Figure 6: Precision of PM mass concentration measurement: (a) as a function of PM masses, (b) as a function of PM mass concentrations. 110 110 (a) 90 80 70 60 MINIVOL 50 y = 0.9664x-0.9278 R2 = 0.6119 40 30 PEMTM y = 1.227x-0.8168 R2 = 0.8632 20 10 0 0.00 0.05 0.10 0.15 0.20 0.25 0.30 0.35 0.40 0.45 0.50 0.55 PM Mass / mg MINIVOL PM2.5 PEM PM10 Table 3. MINIVOL PM10 Pow er (MINIVol) (b) 100 % RSD of PM Mass Concentrations % RSD of PM Mass Concentrations 100 90 80 70 MINIVOL y = 146.41x-1.0262 R2 = 0.6976 60 50 40 PEMTM y = 39.818x-0.774 R2 = 0.7775 30 20 10 0 PEM PM2.5 Pow er (PEM) 0 5 MINIVOL PM2.5 PEM PM10 10 15 20 25 30 3 PM Mass Concentration / µg/m MINIVOL PM10 Pow er (MINIVol) 35 PEM PM2.5 Pow er (PEM) Method detection limits (MDL) for the measurements of PM mass and mass concentrations MDL of Mass Measurement MDL of Mass Concentration (mg) (µg/m3) A B C D E Gravimetric Estimated Calculated Calculated Estimated Sampler Flow rate measurement of from from from from (L/min) field blanks Fig. 8a column A * column B * Fig. 8b MINIVOL 5 0.02 0.022 2.8 3.1 4.3 PEMTM 10 0.02 0.018 1.4 1.3 1.3 PEMTM 4 0.02 0.018 3.5 3.2 3.3 Dichotomous 16.7 0.02 ** NA 0.8 NA NA SSI 1130 2 ** NA 1.2 NA NA * [MDL of mass concentration] = [MDL of mass] / ([Collection time] * [Flow rate]) ** Estimation Appendix B - 10 40 Comparisons of Mass Concentrations Collected from Different Samplers To decide if a type of sampler is “equivalent” to reference methods, three samplers need to be collocated with 3 reference samplers for 10 to 15 days at two different test sites. If differences are within the larger of ±5 µg/m3 or ±7% of the measured value and correlation coefficients among sample pairs exceed 0.97, the samplers can be designated as “equivalent” to the reference methods (Chow, 1995). Although the experimental design of this study did not fully satisfy the above requirements, the evaluation criteria listed above were used for comparisons among different types of samplers. The comparisons were first made between the MINIVOL and the PEMTM samplers used in the pilot study. Then, comparisons were made between each type of sampler with the dichotomous sampler. The reason for selecting the dichotomous sampler for comparing measurement accuracy is that it was the only method allowing the determination of PM10 and PM2.5 simultaneously, while being the U.S. EPA reference method for PM10 only. Before the comparison, the sampling flow rate, its deviation from the designed flow rates of a given sampler and the consequences of the deviations on PM cut point and mass concentration measurements were evaluated first. Effect of the Deviation of Sampling Flow Rates from the Cut-Point Flow Rate For a sampler whose PM cut point is based on the principle of inertial or virtual impaction, its specified volumetric flow rate at the given environment should be maintained to achieve the cut point (Federal Register, 1997). When this flow changes, the PM cut point will change with the inverse square root of the ratio of the actual flow to the cut-point flow (Chow, J. C., 1996). In the reference method for PM10, the sample volume used to calculate the mass concentration has to be adjusted to that at standard conditions of 298 K and 1 atmosphere (i.e. 760 mm Hg column at sea level). Often, the volumetric flow rate of the pump at a given environment is calibrated to that value which corresponds to the cut-point flow rate at standard conditions. For example, in the dichotomous reference method, the cut-point flow of 16.7 L/min should be used at ambient conditions to obtain PM10 concentrations. At a barometric pressure of 700 mm Hg, a water vapor pressure of 16 mm Hg and an average temperature of 15 °C, the overall volumetric flow rate of a dichotomous sampler would be set at 17.9 L/min using a bubble meter. This value is calculated from 16.7 L/min x (273+15)/298 x 760/(700–16) = 16.7 L/min x 1.074 = 17.9 L/min, thus converting the flow rate of 16.7 L/min to that at standard conditions. By doing so, the actual PM cut point of the sampler would have been decreased from 10 µm to 9.65 µm, by a factor of 1/(square root of 1.074). Because the flow rate of 16.7 L/min, instead of 17.9 L/min, would be used in calculation, the PM mass concentration at ambient conditions would have been altered (increased). Since the reduced cut point would decrease the measured PM level, the increase in the above example would be within 7.4%. In the recently ruled reference method for PM2.5 (Federal Register, 1997), it specifies that the cut-point volumetric flow rate should be maintained at the ambient condition and the actual PM concentration at ambient conditions should be measured. Yet, the reference method for PM10 has not been changed. Except for TEOM samples, all the PM data reported for this study were that at actual ambient conditions. Because the volumetric flow rates applied deviated from the cut-point flow rate, the actual cut points did change slightly from the design values as shown in Table 4. However, since the degree of the deviation of the flow from the cut-point flow for different samplers were similar, the actual cut-points among different samplers were similar except for three cases. One exception was the TEOM sampler, where the flow was automatically adjusted to standard conditions according to the manually pre-set ambient temperature. This might result in the cut point being 5-7% smaller than that of a dichotomous sampler. The second Appendix B - 11 exception was that on the first day of sampling the PM2.5 cut point of the dichotomous sampler was ~4% lower than the others. The third one was that on the last sampling day, the cut points for PM 2.5 and PM10 of the MINIVOL sampler were about 5-6% higher than the corresponding ones of other samplers. In addition to the wide daily temperature variations, the theoretical relationship among the cut point, flow rate, barometric pressure and temperature for a PM impactor sampler is complicated beyond the scope of this report. Table 4. Corrected PM cut sizes used 12/11/96 (WED) PM Cut Size (µm) Sampler 12/12/96 (THU) 12/13/96 (FRI) 12/14/96 (SAT) 12/15/96 (SUN) Mean ±95% % Mean ±95% % Mean ±95% % Mean ±95% % Mean ±95% % (µm) Conf. Diff (µm) Conf. Diff (µm) Conf. Diff (µm) Conf. Diff (µm) Conf. Diff Dichotomous 2.5 MINIVOL TM PEM (10 L/min) PEMTM (4 L/min) Dichotomous 10 MINIVOL PEMTM (10 L/min) 2.38 - 0 2.52 - 0 2.51 - 2.47 0.04 3.8 - - - 2.54 0.010 1.0 2.57 2.47 - 0.02 - 3.9 - - - - 2.52 2.60 2.63 9.55 - - 0 - 10.09 0 10.08 10.19 0.020 1.0 10.11 0.07 0 10.16 0.4 10.21 0.13 0 0.5 - 0 2.63 0.1 - 0 2.45 - 0 0.02 -2.2 2.60 0.02 6.0 0.02 -1.2 2.47 0.0 2.48 0.06 - 0.9 1.4 9.81 10.4 0.2 0 5.9 9.93 0.07 1.3 - -0.5 -0.7 - - - 10.29 0.12 2.0 10.50 0.18 4.2 10.19 0.09 0.3 TM PEM (4 L/min) TEOM 9.54 - 0 10.20 9.59 - 1.1 10.10 -4.9 9.52 0.2 10.44 -5.5 9.56 2.8 9.76 -5.9 9.74 Mean Temp (ºC) Bor. Pressure (mm Hg) -11 702 -8 698.2 - -12 705.5 - - -10 710.2 0 695.8 Comparison between the MINIVOL and the PEMTM Samplers Both the corresponding mass concentrations for PM10 and PM2.5 collected by the MINIVOL and PEMTM samplers compared very well, as shown in Fig. 9. The data measured by the two samplers were highly correlated. For PM10, the R2 value was 0.966 and the slope was 0.933. For PM2.5, the R2 value was 0.9896 and the slope was 0.982. Figure 7: Comparisons between MINIVOL and PEMTM (with a flow rate of 10 L/min) for PM10 and PM2.5 measurements. PM10 PM2.5 40 MINIVOL PM 2.5 / µ g/m 3 35 MINIVOL PM 10 /µ g/m 3 40 30 25 1:1 line 20 y = 0.9326x + 0.0218 2 R = 0.966 15 10 35 30 25 y = 0.9822x + 1.5986 2 R = 0.9896 20 1:1 line 15 10 5 5 0 0 0 5 10 15 TM PEM 20 25 3 PM10 / µ g/m 30 35 40 0 Appendix B - 12 5 10 15 20 25 PEM TM PM 2.5 / µ g/m3 30 35 40 Comparison of the MINIVOL and Dichotomous Samplers In spite of small data sizes, Fig.10 demonstrates that the data collected by the two samplers were highly correlated for both PM10 (R2=0.991) and PM2.5 (R2=0.961). The slopes were all close to the “1:1” lines. However, the PM2.5 data collected from the dichotomous sampler on the first sampling day was about 6.9 µg/m3 lower, which exceeded the criteria of 5 µg/m3 slightly, Table 5. This may be explained by the flow of the dichotomous sampler used in the first sampling day, which deviated from the cut-point flow and resulted in 4% smaller cut point than that of the MINIVOL. Figure 8: Comparisons between MINIVOL and dichotomous samplers for PM10 and PM2.5 measurements. PM2.5 PM10 40 35 35 MINIVOL PM10 / µ g/m3 MINIVOL PM 2.5 / µ g/m 3 40 30 25 y = 1.1665x + 0.2726 2 R = 0.9611 20 1:1 line 15 10 5 30 25 1:1 line 20 y = 1.1173x - 5.0008 R2 = 0.9908 15 10 5 0 0 0 5 10 15 20 25 30 35 40 0 5 10 Dichotomous PM 2.5 / µ g/m 3 Table 5. 15 20 25 30 Dichotomous PM10 / µ g/m3 35 40 Summary of PM mass concentrations 12/11/96 (WED) 12/12/96 (THU) PM Cut Size (µm) Sampler Dichotomous 2.5 MINIVOL PEMTM (10 L/min) TM PEM (4 L/min) Dichotomous MINIVOL 10 PEMTM (10 L/min) PEMTM (4 L/min) SSI HV TEOM 12/14/96 (SAT) Mean ±95% n Mean ±95% n (µg/m3) Conf. (µg/m3) Conf. 12/15/96 (SUN) Mean ±95 (µg/m3) % Conf . 1 29.1 3 36.0 3.1 6 34.9 0.5 1 - 26.1 - - 1 3 - 21.3 18.3 - 7.5 - 1 3 1 9.1 8.7 9.0 0.5 - 1 3 2 2.9 5.1 3.3 1.9 0.7 - - - - - - 1 25.1 - 1 10.8 - 1 1.3 - 1 - 37.5 - - 1 6 6 34.4 33.2 36.6 0.8 0.6 1 3 6 26.7 25.6 24.7 1.7 1 3 3 12.3 10.0 12.0 1.0 0.6 1 3 3 6.8 2.4 2.5 3.0 0.6 1 1 38.5 15.1 - 1 1 1 34.7 24.0 10.3 - 1 1 1 25.4 48.0 13.7 - 1 1 1 7.8 28.5 8.9 - 1 1 1 2.5 11.2 4.8 - n n 12/13/96 (FRI) Appendix B - 13 Mean ±95% n Mean ±95% (µg/m3) Conf. (µg/m3) Conf. Comparison of the PEMTM and Dichotomous Samplers The mass concentrations of PM10 and PM2.5 collected by PEMTM samplers at a flow rate of 10 L/min (Fig. 11) or 4 L/min (Fig. 12) were strongly correlated with the dichotomous data (R2>0.975). The slopes were close to the “1:1” lines. The differences in all data pairs were within ±5 µg/m3 (Table 5). These observations agree well with the literature reported observations that the Marple (i.e. PEMTM) PM10 inlet correlated strongly (R2>0.970) with the dichotomous sampler (Buckley et al., 1991; Lioy et al., 1988). Figure 9: Comparisons between PEMTM (with a flow rate of 10 L/min) and dichotomous samplers for PM10 and PM2.5 measurements. PM10 PM2.5 µ g/m 3 30 25 1:1 line 20 15 30 TM 5 20 5 10 15 20 25 30 Dichotomous PM10 / µ g/m 35 1:1 line 15 10 5 0 0 0 y = 1.2253x - 0.8204 R2 = 0.9977 25 PEM PEM y = 1.1645x - 4.5698 2 R = 0.9755 10 35 3 35 / µ g/m PM2.5 (10 L/min) 40 TM PM 10 (10 L/min) / 40 0 40 5 10 15 20 25 30 35 40 Dichotomous PM2.5 / µ g/m3 3 Figure 10: Comparisons between PEMTM (with a flow rate of 4 L/min) and dichotomous samplers for PM10 and PM2.5 measurements PM2.5 35 35 15 y = 1.1771x - 5.9676 2 R = 0.999 10 3 TM 1:1 line 20 1:1 line 30 PEM µ g/m 25 µ g/m PM2.5 (4 L/min) / 40 30 3 PEMTM PM10 (4 L/min) / PM10 40 5 25 20 y = 1.2832x - 1.8932 2 R = 0.9941 15 10 5 0 0 0 5 10 15 20 25 30 35 40 Dichotomous PM10 / µ g/m 3 0 5 10 15 20 25 30 Dichotomous PM2.5 / µ g/m Appendix B - 14 35 3 40 PM10 Mass Concentrations Collected by the SSI High Volume Sampler and the TEOM® Sampler The purpose to collocate the MINIVOL and PEMTM samplers with the SSI high volume and TEOM samplers, in addition to the dichotomous sampler, was simply to collect more data from a reference method (SSI high volume sampler) or an equivalent method (TEOM). These two samplers were already in use at the ambient air monitoring station. However, only 5 sets of PM10 data were collected. The data sizes were too small to warrant proper comparisons. Nevertheless, the data, as compared to the dichotomous measurements, are presented in Figs.13-14 for reference. Figure 10: Comparison between a TEOM sampler and a dichotomous sampler for PM10 measurements. Figure 10: Comparison between a SSI high volume sampler and a dichotomous sampler for PM10 measurements. PM10 3 35 45 40 y = 0.6038x + 15.841 2 R = 0.3375 35 30 25 20 15 TEOM PM 10 / µ g /m 3 SSI HV PM 10 / µ g/m PM10 40 50 1:1 line 10 5 0 30 1:1 line 25 20 15 10 y = 0.2535x + 4.5505 2 R = 0.714 5 0 0 5 10 15 20 25 30 35 40 0 5 10 15 20 25 30 Dichotomous PM10 / µ g/m Dichotomous PM10 / µ g/m 3 35 40 3 Figure 13 shows that the PM10 mass concentrations measured by SSI correlated with that measured by dichotomous samplers (R2=0.337). Data comparisons of PM10 mass concentrations at several sites of the National Air Pollution Surveillance (NAPS) program (including a site at Edmonton) collected from the SSI and dichotomous samplers in 1984-1994 have been reported (Dann, 1994). It was found that there was a strong correlation at the Edmonton site between the two samplers, with R2=0.84 (n=326) and the ratio of the dichotomous data to the SSI data being 0.93±0.27 (mean±SD, n=326). Figure 14 shows that there was a strong correlation between the data collected from the TEOM® and the dichotomous samplers (R2=0.7055), the former as the 24-hour average and the latter as the 18- to 24hour average. However, the slope was only about 0.25. The TEOM® data at relatively high PM10 concentrations were about 40% lower than the dichotomous data. Previously, Alberta Environmental Protection had compared the PM10 concentrations as a 24-hour average measured by the SSI and TEOM samplers over a one year period (Byrne, 1996). It was found that there was a strong correlation between the two measurement devices (R2=0.89, n=82). However, the TEOM data were consistently lower than the SSI data by 25%. Some researchers also reported that the TEOM sampler tended to give lower recordings than the reference devices (Patachnick and Ruppercht, 1991) and explained this tendency being due to the differences in filter conditioning. While the “dry” air was measured by the TEOM at 50 °C during this study, the Teflo filters of the dichotomous sampler were conditioned for 24 hours at 45±1% RH and 23±3 °C. This study was carried out during winter at the average ambient temperature of about 10 °C and relatively high concentration ratios of PM2.5 to PM10 (about 80%). Under such circumstances and at the TEOM operation conditions used, the loss of the volatile component of PM10 could be very significant, in addition to the smaller cut point, which contributed to the reduced PM mass concentrations. Appendix B - 15 Conclusions The relative humidity used for filter conditioning affects the mass measurement. The extent of the effect depends on the nature of the PM collected. For the samples collected in this study, the mass concentration data decreased about 8% when the relative humidity changed from 50% to 15%. A 3% portion of the mass could not be recovered when relative humidity increased back to 50% from 15%. If the relative humidity is controlled within ±5% in the range of 30-40%, the mass measurement could be affected by a maximum of 2% for the samples in this study. The method detection limits of PM mass concentration measured directly were in agreement with those calculated from the method detection limits of PM mass measurement. The method detection limits for PM10 and PM2.5 mass measurement collected on Teflo filters (37 or 47 mm in diameter) were 20 µg, regardless of the samplers used. The MINIVOL and PEMTM samplers were basically comparable to each other for PM10 and PM2.5 measurement, and to the dichotomous reference sampler for PM10 measurement. However, if resources are available, more data should be collected, especially for PM2.5 measurement, for which an EPA reference method is now available. Appendix B - 16 References Bates D.L. (1996). Inhalable particulate matter in Edmonton and Calgary from 1984 to 1993. Air Issues and Monitoring Branch, Alberta Environmental Protection. ISBN: 0-7732-5052-2. Bukley, T. J.; Waldman, J. M.; Freeman, N. C., G.; Lioy, P. J.; Marple, V. A.; Turner, W. A. (1991). Calibration, intersampler comparison, and field application of a new PM-10 personal air-sampling impactor. Aerosol Sci. Technol. 14:380-387. Chow, J. C. (1995). Measurement Methods to Determine Compliance with Ambient Air Quality Standards for Suspended Particles. Journal of the Air and Waste Management Association, 45, 320-382. Dann, T (1994). PM10 and PM2.5 concentrations at Canadian sites: 1984-1993, Report Series No. PMD 94-3. Environmental Technology Centre, Pollution Measurement Division, Environment Canada. Unpublished Lioy, P. J.; Wainman, T.; Turner, W. A.; Marple, V. A. (1988). An intercomparison of the indoor air sampling impactor and the dichotomous sampler for a 10-µm cut size. JAPCA 38:668-670. Patachnick and Ruppercht, (1991) U.S. EPA. (1994). Guidelines for PM-10 Sampling and Analysis Applicable to Receptor Modeling. Office of Air Quality Planning and Standards, U.S. Environmental Protection Agency, Research Triangle Park, NC 27711. EPA/-452/R-94-009. Code of Federal Regulations, 40 CFR 50, Appendix J. Federal Register, 40 CFR 50, Appendix L. July 18 (1997) Federal Register, September 18 (1990). Vol. 55, 43406. Federal Register, July 27 (1989). Vol. 54, 31247. Federal Register, December 1 (1987). Vol. 52, 45684. Appendix B - 17 Appendix A-1: Data for field collection parameters and measured PM masses and mass concentrations NO. Sampler 1 PEMTM (10 L/min) TM PM Unit Size Number (µm) Filter ID Initial Time Final Time Collecting Time (hours) Mean Mean PM Mass Flow Air Mass Conc. Rate Volume (mg) (µg/m3) (L/min) (m3) AH#1 2.5 96N09B 12/11/96 12:47 12/12/96 13:33 24:46 10.55 15.68 0.554 35.3 2 3 PEM (10 L/min) PEMTM (10 L/min) AH#3 AH#2 2.5 2.5 96N08B 96N07B 12/11/96 12:47 12/11/96 12:47 12/12/96 13:33 12/12/96 13:33 24:46 24:46 10.15 10.36 15.08 15.39 0.513 0.540 34.0 35.1 4 PEMTM (10 L/min) AH#4 2.5 96N06B 12/11/96 12:47 12/12/96 13:33 24:46 9.92 14.73 0.505 34.3 5 PEM (10 L/min) 6 PEMTM (10 L/min) 7 Dichotomous 8 Dichotomous 9 MINIVOL 10 MINIVOL 11 MINIVOL 12 SSI HV AH#5 AH#6 DC#1 DC#1 SN1489 SN1453 SN1488 HV 2.5 2.5 2.5 10 2.5 2.5 2.5 10 96N05B 96N04B 96R11C 96R10C 96L06D 96L07D 96L08D 12/11/96 12:47 12/11/96 12:47 12/11/96 13:10 12/11/96 13:10 12/11/96 12:45 12/11/96 12:45 12/11/96 12:45 12/11/96 12:00 12/12/96 13:33 12/12/96 13:33 12/12/96 13:25 12/12/96 13:25 12/12/96 13:35 12/12/96 13:35 12/12/96 13:35 12/12/96 12:00 24:46 24:46 24:15 24:15 24:50 24:50 24:50 24:00 10.06 10.27 16.55 18.31 5.15 5.26 4.98 1130 14.94 15.26 24.08 26.65 7.67 7.83 7.42 1627 0.528 0.538 0.700 0.998 0.283 0.258 0.282 62.70 35.3 35.3 29.1 37.5 36.9 33.0 38.0 38.5 13 PEMTM (10 L/min) 14 PEMTM (10 L/min) AH#1 AH#2 10 10 96N02B 96N01B 12/12/96 19:15 12/12/96 18:52 12/13/96 20:35 12/13/96 20:27 25:20 25:35 9.59 9.40 14.58 14.43 0.529 0.535 36.3 37.1 15 PEMTM (10 L/min) AH#3 10 96N03B 12/12/96 18:27 12/13/96 20:45 26:18 9.72 15.33 0.549 35.8 AH#4 AH#5 10 10 96M04B 96M07B 12/12/96 18:33 12/12/96 18:20 12/13/96 20:40 12/13/96 20:43 26:07 26:23 9.06 9.25 14.20 14.64 0.536 0.537 37.8 36.7 TM TM 16 PEM (10 L/min) 17 PEMTM (10 L/min) 18 PEMTM (10 L/min) AH#6 10 96M06B 12/12/96 19:00 12/13/96 20:23 25:23 9.69 14.76 0.529 35.8 TM SKC-04 DC#1 DC#1 SN1487 SN1489 SN1486 SN1453 SN1485 10 2.5 10 10 10 10 10 10 96N26B 96R09C 96R08C 96L09D 96L10D 96Q10E 96K05D 96K04D 12/12/96 19:22 12/12/96 20:17 12/12/96 20:17 12/12/96 19:45 12/12/96 19:40 12/12/96 19:47 12/12/96 19:43 12/12/96 19:35 12/13/96 20:37 12/13/96 19:19 12/13/96 19:19 12/13/96 20:11 12/13/96 19:40 12/13/96 20:15 12/13/96 19:47 12/13/96 20:18 25:15 23:02 23:02 24:26 24:00 24:28 24:04 24:43 3.84 14.74 16.39 4.80 4.79 4.82 4.84 4.82 5.82 20.36 22.65 7.03 6.89 7.07 6.98 7.15 0.202 0.531 0.780 0.228 0.238 0.234 0.222 0.241 34.7 26.1 34.4 32.4 34.5 33.1 31.8 33.7 19 20 21 22 23 24 25 26 PEM (4 L/min) Dichotomous Dichotomous MINIVOL MINIVOL MINIVOL MINIVOL MINIVOL Appendix B - 18 Comment Flag NO. Sampler PM Unit Size Number (µm) Mean Mean PM Mass Flow Air Mass Conc. Rate Volume (mg) (µg/m3) (L/min) (m3) Filter ID Initial Time Final Time Collecting Time (hours) 12/13/96 19:57 12/13/96 9:15 12/14/96 13:32 12/14/96 13:42 24:02 22:30 15:28 15:32 4.85 1057 9.42 8.48 6.99 1427 8.74 7.90 0.235 34.20 0.225 0.180 33.6 24.0 25.7 22.8 27 MINIVOL SN1488 28 SSI HV HV 29 PEMTM (10 L/min) AH#1 30 PEMTM (10 L/min) AH#2 10 10 10 10 96M11E 96N22B 96N23B 12/12/96 19:55 12/12/96 10:45 12/13/96 22:04 12/13/96 22:10 31 PEMTM (10 L/min) AH#3 10 96N21B 12/13/96 21:49 12/14/96 13:26 15:37 9.13 8.56 0.187 21.9 (10 L/min) AH#4 10 96N20B 12/13/96 22:00 12/14/96 13:50 15:50 8.78 8.34 0.229 27.5 33 PEMTM (10 L/min) 34 PEMTM (10 L/min) AH#5 AH#6 10 10 96N25B 96N24B 12/13/96 21:55 12/13/96 22:06 12/14/96 13:15 12/14/96 13:34 15:20 15:28 9.27 9.40 8.53 8.72 0.212 0.224 24.9 25.7 10 96N13B 12/13/96 22:20 12/14/96 14:02 15:42 3.92 3.69 0.094 25.4 SKC-32 DC#1 DC#1 SN1485 SN1486 SN1487 SN1489 SN1453 SN1488 HV AH#1 2.5 2.5 10 10 10 10 2.5 2.5 2.5 10 2.5 96N14B 96R12C 96R07C 96M09E 96M08E 96M10E 96Q08E 96Q09E 96Q07E 96N19B 12/13/96 19:07 12/13/96 19:36 12/13/96 19:36 12/13/96 22:15 12/13/96 22:45 12/13/96 22:15 12/13/96 19:43 12/13/96 19:54 12/13/96 20:07 12/13/96 21:15 12/14/96 15:33 12/14/96 13:58 12/14/96 14:22 12/14/96 14:22 12/14/96 14:04 12/14/96 14:04 12/14/96 14:04 12/14/96 14:04 12/14/96 14:04 12/14/96 14:04 12/14/96 13:20 12/15/96 9:23 18:51 18:46 18:46 15:49 15:19 15:49 18:21 18:10 17:57 16:05 17:50 3.95 14.84 16.45 4.84 4.95 4.87 4.85 4.84 4.87 1057 9.34 4.47 16.71 18.52 4.60 4.55 4.62 5.34 5.28 5.25 1020 9.99 0.112 0.356 0.494 0.113 0.121 0.118 0.106 0.059 0.125 49.00 0.090 25.1 21.3 26.7 24.6 26.6 25.5 19.9 11.2 23.8 48.0 9.0 (10 L/min) AH#2 2.5 96N17B 12/14/96 15:31 12/15/96 9:27 17:56 9.19 9.89 3.360 48 PEMTM (10 L/min) AH#3 2.5 96N18B 12/14/96 15:37 12/15/96 9:17 17:40 9.27 9.83 1.760 (10 L/min) AH#4 10 96N12B 12/14/96 15:35 12/15/96 9:28 17:53 9.78 10.49 0.130 12.4 50 PEMTM (10 L/min) 51 PEMTM (10 L/min) AH#5 AH#6 10 10 96N10B 96N11B 12/14/96 15:36 12/14/96 15:32 12/15/96 9:13 12/15/96 9:20 17:37 17:48 9.64 9.49 10.18 10.14 0.123 0.116 12.1 11.4 TM 32 PEM 35 PEMTM (4 L/min) SKC-04 TM 36 PEM (4 L/min) 37 Dichotomous 38 Dichotomous 39 MINIVOL 40 MINIVOL 41 MINIVOL 42 MINIVOL 43 MINIVOL 44 MINIVOL 45 SSI HV 46 PEMTM (10 L/min) TM 47 PEM TM 49 PEM 52 53 Y 340 Oil/soap on filter Y 179 Oil/soap on filter Y (4 L/min) SKC-04 2.5 96N15B 12/14/96 15:38 12/15/96 9:33 17:55 3.62 3.89 0.042 10.8 TM (4 L/min) SKC-32 10 96N16B 12/14/96 15:38 12/15/96 9:36 17:58 3.67 3.95 0.031 7.8 PEM Appendix B - 19 Flag Damaged filter TM PEM Comment NO. Sampler 54 Dichotomous 55 Dichotomous 56 MINIVOL 57 MINIVOL 58 MINIVOL 59 MINIVOL 60 MINIVOL 61 MINIVOL 62 SSI HV 63 PEMTM (10 L/min) PM Unit Size Number (µm) Mean Mean PM Mass Flow Air Mass Conc. Rate Volume (mg) (µg/m3) (L/min) (m3) Filter ID Initial Time Final Time Collecting Time (hours) 96R05C 96R06C 96Q06E 96Q02E 96Q03E 96Q04E 96Q01E 96Q05E 12/15/96 9:39 12/15/96 9:39 12/15/96 9:48 12/15/96 9:48 12/15/96 9:48 12/15/96 9:48 12/15/96 9:48 12/15/96 9:48 12/15/96 20:00 12/16/96 9:18 18:06 17:58 18:07 18:20 18:18 18:18 18:19 18:18 18:35 22:18 14.62 16.18 4.72 4.91 4.76 4.74 4.69 4.75 1039 9.77 15.87 17.45 5.13 5.40 5.22 5.21 5.15 5.22 1158 13.07 0.144 0.214 0.052 0.049 0.056 0.048 0.043 0.045 33.00 0.039 9.1 12.3 10.1 9.1 10.7 9.2 8.3 8.6 28.5 3.0 DC#1 DC#1 SN1485 SN1486 SN1487 SN1489 SN1453 SN1488 HV AH#1 2.5 10 10 10 10 2.5 2.5 2.5 10 2.5 96M02B 12/14/96 15:33 12/14/96 15:41 12/14/96 15:41 12/14/96 15:28 12/14/96 15:30 12/14/96 15:30 12/14/96 15:29 12/14/96 15:30 12/14/96 1:25 12/15/96 11:00 AH#2 AH#3 2.5 2.5 96L16B 96J04B 12/15/96 10:59 12/15/96 11:02 12/16/96 9:22 12/16/96 9:12 22:23 22:10 10.61 10.41 14.24 13.85 0.053 3.480 3.7 251 (10 L/min) AH#4 10 96J05B 12/15/96 10:57 12/16/96 9:23 22:26 10.04 13.51 0.031 2.3 67 PEMTM (10 L/min) 68 PEMTM (10 L/min) AH#5 AH#6 10 10 96L17B 96L18B 12/15/96 11:02 12/15/96 10:58 12/16/96 9:10 12/16/96 9:20 22:08 22:22 10.10 10.27 13.41 13.79 0.029 0.043 2.2 3.1 TM 64 PEM (10 L/min) 65 PEMTM (10 L/min) TM 66 PEM Comment A tinier hole on filter A tinier hole on filter A tinier hole on filter A tinier hole on filter Oil/soap on filter 69 PEMTM (4 L/min) SKC-04 2.5 96L19B 12/15/96 11:03 12/16/96 9:26 22:23 4.06 5.45 0.007 1.3 < method detection limit 70 71 72 73 74 75 76 77 PEMTM (4 L/min) Dichotomous Dichotomous MINIVOL MINIVOL MINIVOL MINIVOL MINIVOL 10 2.5 10 10 10 10 2.5 2.5 96L20B 96R04C 96R03C 96L05D 96L04D 96L02D 96S17E 96S13E 12/15/96 11:03 12/15/96 11:05 12/15/96 11:05 12/15/96 10:56 12/15/96 10:56 12/15/96 10:56 12/15/96 10:56 12/15/96 10:56 12/16/96 9:29 12/16/96 9:41 12/16/96 9:41 12/16/96 9:30 12/16/96 9:30 12/16/96 9:30 12/16/96 9:30 12/16/96 9:30 22:26 22:36 22:36 22:34 22:34 22:34 22:34 22:34 4.20 15.65 17.36 4.61 4.80 4.51 4.69 4.59 5.66 21.21 23.54 6.24 6.50 6.10 6.35 6.22 0.014 0.061 0.160 0.003 0.008 0.032 0.024 0.043 2.5 2.9 6.8 0.5 1.3 5.3 3.8 6.9 < method detection limit Small hole in Filter Small hole in Filter < method detection limit < method detection limit SKC-32 DC#1 DC#1 SN1485 SN1486 SN1487 SN1489 SN1453 Appendix B - 20 Flag Y NO. Sampler 78 79 80 81 82 83 MINIVOL 84 PM Unit Size Number (µm) SSI HV TEOM TEOM TEOM TEOM SN1488 HV TEOM TEOM TEOM TEOM 2.5 10 10 10 10 10 TEOM TEOM 10 Filter ID Initial Time Final Time Collecting Time (hours) 96L01D 12/15/96 10:56 12/15/96 20:00 12/11/96 12/12/96 12/13/96 12/14/96 12/16/96 9:30 12/16/96 18:05 22:34 22:05 12/15/96 Mean Mean PM Mass Flow Air Mass Conc. Rate Volume (mg) (µg/m3) (L/min) (m3) 4.64 1055 6.28 1398 0.028 15.70 4.5 11.2 15.1 10.3 13.7 8.9 4.8 Appendix B - 21 Comment Flag All TEOM data were multiplied by 1.09 to account for the difference between the pre-set and the actual average ambient temperature.


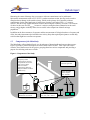
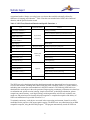

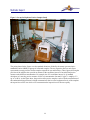
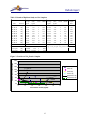
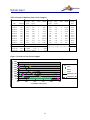
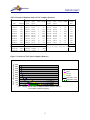
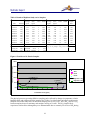
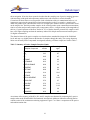
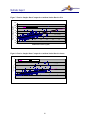


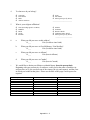
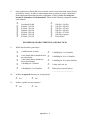

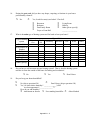
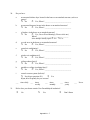
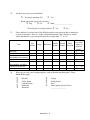

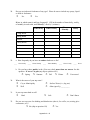
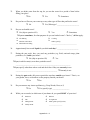

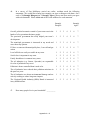

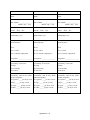

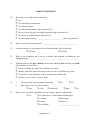

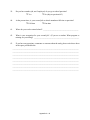


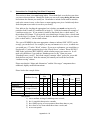


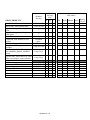
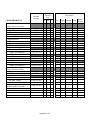
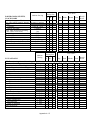


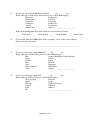


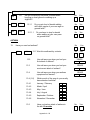

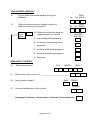
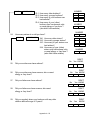
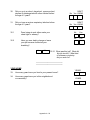

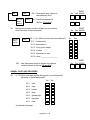
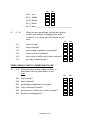
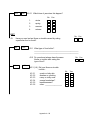
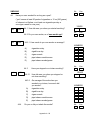


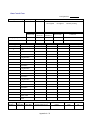

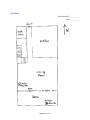


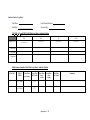


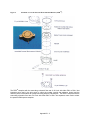

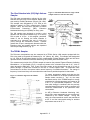


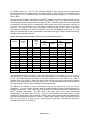
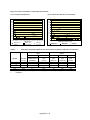


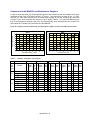

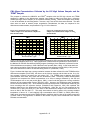

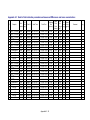
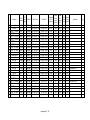

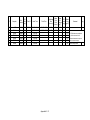


![TR4W User Manual [English Version]](http://vs1.manualzilla.com/store/data/005798737_1-5ae60a1fb1429eafa2ca68266ac47e3b-150x150.png)

![TR4W User Manual [English Version]](http://vs1.manualzilla.com/store/data/005728234_1-e27c4fea1c6d513d6e0fdc1451ef66f1-150x150.png)