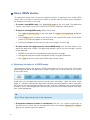
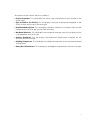
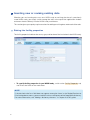
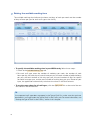
1
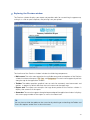
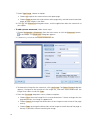
WISN WORKLOAD INDICATORS OF STAFFING NEED > Start WISN study > Open an existing study > Build summary report > Build institution report > Administrator tasks WHO home page Help About SOFTWARE MANUAL WHO Library Cataloguing-in-Publication Data Workload indicators of staffing need. 2 v. Contents: User’s manual. -- Software manual. 1.Health manpower. 2.Personnel staffing and scheduling - methods. 3.Personnel staffing and scheduling - handbooks. 4.Workload. 5.Manuals. I.World Health Organization. ISBN 978 92 4 150019 7 (NLM classification: W 76) © World Health Organization 2010 All rights reserved. Publications of the World Health Organization can be obtained from WHO Press, World Health Organization, 20 Avenue Appia, 1211 Geneva 27, Switzerland (tel.: +41 22 791 3264; fax: +41 22 791 4857; e-mail: [email protected]). Requests for permission to reproduce or translate WHO publications – whether for sale or for noncommercial distribution – should be addressed to WHO Press, at the above address (fax: +41 22 791 4806; e-mail: [email protected]). The designations employed and the presentation of the material in this publication do not imply the expression of any opinion whatsoever on the part of the World Health Organization concerning the legal status of any country, territory, city or area or of its authorities, or concerning the delimitation of its frontiers or boundaries. Dotted lines on maps represent approximate border lines for which there may not yet be full agreement. The mention of specific companies or of certain manufacturers’ products does not imply that they are endorsed or recommended by the World Health Organization in preference to others of a similar nature that are not mentioned. Errors and omissions excepted, the names of proprietary products are distinguished by initial capital letters. All reasonable precautions have been taken by the World Health Organization to verify the information contained in this publication. However, the published material is being distributed without warranty of any kind, either expressed or implied. The responsibility for the interpretation and use of the material lies with the reader. In no event shall the World Health Organization be liable for damages arising from its use. Designed by Atelier Rasmussen / Geneva 2010 Printed in France Table of contents 1. Using the WISN application About the WISN application - System requirements Exploring the start page Getting additional help 1 2 2 3 4 2. Working with WISN studies About WISN studies - Exploring the tabs of a WISN study Inserting new or revising existing data - Setting the facility properties - Setting the type of staff at the facility - Setting the available working time - Setting the workload statistics - Setting the activity standards - Setting the staffing comparison - Viewing the salary cost calculations Saving the WISN study 5 6 6 8 8 9 10 11 12 14 15 16 3. Working with reports About reports - Creating a report - Exploring the Preview window - Navigating the report - Saving and opening a report Changing the view of the report Changing the appearance of report pages - Changing the background color of report pages - Adding a watermark Searching the text of the report Printing, exporting, and distributing the report - Setting up the page - Setting the scale of the report - Printing the report - Exporting and distributing the report 17 18 18 19 20 20 21 22 22 22 25 26 26 26 27 28 4. Working with dictionaries About the Dictionary Manager Adding a dictionary element - Adding an element to the Geographic dictionary - Adding an element to the Staff Types dictionary Editing a dictionary element Deleting a dictionary element 30 31 32 32 33 33 34 Acknowledgements WHO expresses its gratitude to Vladimir Eskin and Bart Bankowski of PROGNOZ for the production of the WISN software and manual. Mario Dal Poz, Gülin Gedik, Teena Kunjumen, and Norbert Dreesch of the Department of Human Resources for Health of the World Health Organization, Geneva, provided content analysis to guide development of the software and manual. Jörg Hetzke of the Office of the Assistant Director-General, Health Systems and Services steered the software development process. 1. Using the WISN application In this chapter About the WISN application - System requirements 2 2 Exploring the start page 3 Getting additional help 4 1 About the WISN application The WISN application is a software tool for recording, analyzing, and reporting data related to staffing status and needs at health facilities. Learning to use this software is easy, but it assumes that you are familiar with the terms, concepts, and methodologies presented in Workload Indicators of Staffing Need (WISN): User’s Manual. You should review the aforementioned document thoroughly before you make use of the software. This user guide presents an overview of the application’s features and gives step-by-step instructions for completing a variety of tasks. System requirements Please ensure that your computer meets or exceeds the following system requirements before installing the WISN application. CPU Intel Celeron 800 MHz (Intel Core 2 Duo 2 GHz recommended) RAM 256 MB (2 GB recommended) Available disk space 200 MB Operating system Windows 7, Windows Vista, or Windows XP • To launch the WISN application, double-click its desktop icon, or choose Start > All Programs > WISN > WISN from the Start menu. 2 Exploring the start page The start page provides a convenient hub to the different parts of the WISN application. • To start a new WISN study, click Start WISN study (see Chapter 2). • To open a previously saved WISN study, click Open an existing study (see Chapter 2). • To compare multiple WISN studies in report form, click Build summary report (see Chapter 3). • To present the details of a single WISN study in report form, click Build an institution report (see Chapter 3). • To display the Dictionary Manager, click Administrator tasks (see Chapter 4). 3 Getting additional help The WISN application runs on a customized subset of the PROGNOZ 5 platform for business intelligence (BI) and business performance management (BPM) solutions. • To receive technical support and software assistance, please contact [email protected]. • For questions regarding WISN policies and procedures, please refer to Workload Indicators of Staffing Needs (WISN): A User’s Manual. 4 2. Working with WISN studies In this chapter About WISN studies - Exploring the tabs of a WISN study Inserting new or revising existing data - Setting the facility properties - Setting the type of staff at the facility - Setting the available working time - Setting the workload statistics - Setting the activity standards - Setting the staffing comparison - Viewing the salary cost calculations Saving the WISN study 6 6 8 8 9 10 11 12 14 15 16 5 About WISN studies The application keeps track of data for separate facilities in document files called WISN studies. You can create as many WISN studies as you like and save them to your computer for reference or revision at any time. • To create a new WISN study, click Start WISN study on the start page. The application creates a new WISN study and switches to its Facility Properties tab by default. • To open an existing WISN study, follow these steps: 1. Click Open an existing study on the start page. The Open an Existing Study dialog box appears. 2. In the Folders pane, navigate to the location of the saved WISN study. All the WISN studies at this location appear in the lower pane. 3. Check the checkbox of the study that you want to open, and click OK. • To return to the start page from the current WISN study, click the Back button at the top of the application window. The application prompts you to save your changes. Do one of the following: • Click Yes to save the WISN study before returning to the start page. • Click No to discard your changes and go back to the start page immediately. • Click Cancel to remain in the current WISN study without saving. Exploring the tabs of a WISN study The application displays the data of a WISN study under a series of seven tabs. These tabs appear along the top of the application window. Simply click a tab to switch to this section of the WISN study. Under each tab, the application presents one or more worksheets, which are similar to the pages in a common spreadsheet application. Position the mouse pointer inside a worksheet cell, and click the mouse button to select this cell. If the cell is editable, you can then enter or change its value, and the application automatically recalculates the values of other worksheet cells where appropriate. TIP Press TAB to select the next cell in the worksheet. • To expand or collapse list items in a worksheet, click the + or − button, respectively, to the left of the list name. You can also right-click the list and choose Expand All or Collapse All from the context menu that appears. 6 The contents of the various tabs are as follows: • Facility Properties. This tab displays the name, type, and location of the institution in the WISN study. • Type of Staff at the Facility. This tab displays the kinds of personnel employed at the facility and the annual salary for each type. • Available Working Time. This tab displays the hours and days of work per week and the number of days of leave per year for each staff type. • Workload Statistics. This tab displays the number of times per year that any given activity is completed by each staff type. • Activity Standards. This tab displays the benchmark performance standards for the activities of each staff type. • Staffing Comparison. This tab displays the difference between actual and recommended staffing levels. • Salary Cost Calculations. This tab displays the budgetary requirements for each staff type. 7 Inserting new or revising existing data Whether you are inserting data to a new WISN study or revising the data of a previously saved WISN study, you simply switch among the tabs at the top of the application window and enter the data directly into the WISN study worksheets. This section gives you step-by-step instructions for adding or revising data under each of the tabs. Setting the facility properties The facility properties indicate the name, type, and location of the institution in the WISN study. • To specify facility properties in your WISN study, switch to the Facility Properties tab, and fill out the fields of the worksheet. NOTE If the desired value for a field does not appear among the items in the Region/Province or District drop-down menus, you must add this value as an element of the Geographic dictionary. For more information, see “Adding a dictionary element” in Chapter 4 of this guide. 8 Setting the type of staff at the facility The type of staff at the facility indicates the kinds of personnel employed at the facility as well as the annual salary for each job. • To specify the type of staff at the facility in your WISN study, follow these steps: 1.Switch to the Type of Staff at the Facility tab. 2.In the Type of Staff column, click the checkboxes to the left of the staff types that are employed at the facility. Leave unchecked those staff types that are not currently represented. 3.In the Annual Salary (Local Currency) column, enter the annual salary for each job that you checked in Step 2. Be sure to enter numbers only. You should not include currency symbols or thousands separators. NOTE If the desired staff type does not appear in the Type of Staff list, you must add this staff type as an element of the Staff Types dictionary. For more information, see “Adding a dictionary element” in Chapter 4 of this guide. 9 Setting the available working time The available working time indicates the hours and days of work per week and the number of days of leave per year for each staff type at the facility. • To specify the available working time in your WISN study, follow these steps: 1.Switch to the Available Working Time tab. 2.For each staff type, enter the number of workdays per week, the number of work hours per day, the total days of annual leave per year, the total number of public holidays per year, the total number of sick days per year, the total number of days for special no-notice leave per year, and the total number of training days per year. Based on your input, the application automatically calculates the values in the Total columns. • To use the same values for all staff types, click the Apply to all link at the end of the row that contains the desired data. TIP If an expected staff type does not appear in the Type of Staff list, make sure that you have checked this staff type under the Type of Staff at the Facility tab. For more information, see “Setting the Type of Staff at the Facility” earlier in this chapter. 10 Setting the workload components and statistics There are three types of workload components: health service activities, support activities and individual activities. The application present a pre-defined list of health service activities for different staff types. You can choose from this list on the Workload Statistics tab or add custom service activities to this list. (Support and individual activities are listed later on the Activity Standards tab.) • To add a custom service activity for the current staff type, follow these steps: 1.Click the Add new activity link corresponding to the staff type in question, or select the name of the desired staff type from the Type of Staff and Activities list. Click the Create new activity button in the toolbar above this list. The Add new activity dialog box appears. 2.Enter a name for the service activity in the Activity name field, and choose the units of the activity from the Unit drop-down menu. 3.Click Add. • To edit a custom service activity, select the custom activity from the Type of Staff and Activities list. Click the Edit activity button in the toolbar above this list. The Edit activity dialog box appears. Change the name or the units of the activity as you require, and click OK. • To delete a custom service activity, select the custom activity from the Type of Staff and Activities list. Click the Delete activity button in the toolbar above this list. The application displays a confirmation message. Click OK to delete the custom activity or Cancel to keep the custom activity. 11 The workload statistics indicate the number of times that any given service activity is completed per year for each staff type at the facility. • Specify the workload statistics in your WISN study on the Workload Statistics tab. For each service activity under the given staff type, enter the number of times per year that the staff type performs this activity. TIP If an expected staff type does not appear in the Type of Staff and Activities list, make sure that you have checked this staff type under the Type of Staff at the Facility tab. For more information, see “Setting the type of staff at the facility” earlier in this chapter. Setting the activity standards The activity standards indicate the benchmark performance standards for the activities of each staff type at the facility. Based on these standards, the application computes the necessary staff requirements. • To specify the activity standards in your WISN study, follow these steps: 1.Switch to the Activity Standards tab. 2.Select a staff type from the Type of Staff list on the left, and then go to the Activities Related With Service Statistics worksheet. 12 3.In the Activity Standard column, enter the benchmark performance value for each activity of the selected staff type. Based on your input, the application automatically determines the standard workload and calculated requirement for this activity. • To add a category allowance for activities not related with service statistics, follow these steps: 1.Click the Add new activity standard button in the toolbar above the Category Allowance worksheet under Activities Not Related With Service Statistics. The application adds a new row to the worksheet. 2.Enter the activity name and value, and choose the appropriate units from the drop-down menu. Based on your input, the application automatically determines the activity standard for this activity. • To delete a category allowance for activities not related with service statistics, select the category allowance that you want to delete in the Category Allowance worksheet, and in the toolbar above this worksheet. click the Delete the activity standard button • To add an individual allowance for activities not related with service statistics, follow these steps: 1.Click the Add new activity standard button in the toolbar above the Individual Allowance worksheet under Activities Not Related With Service Statistics. The application adds a new row to the worksheet. 2.Enter the activity name, the number of staff members allocated to this activity, and the value, and choose the appropriate units from the drop-down menu. Based on your input, the application automatically determines the activity standard for this activity. • To delete an individual allowance for activities not related with service statistics, select the individual allowance that you want to delete in the Individual Allowance worksheet, and click the Delete the activity standard button in the toolbar above this worksheet. TIP If an expected staff type does not appear in the Type of Staff list, make sure that you have checked this staff type under the Type of Staff at the Facility tab. For more information, see “Setting the type of staff at the facility” earlier in this chapter. 13 Setting the staffing comparison The staffing comparison indicates the difference between actual and recommended staffing levels. • To specify the staffing comparison, switch to the Staffing Comparison tab, and in the Existing Staff column (column A), enter the current number of staff members for each staff type. The application automatically computes the calculated requirement (column B), the difference in staff (column C), and the WISN ratio (column D). TIP If an expected staff type does not appear in the Type of Staff list, make sure that you have checked this staff type under the Type of Staff at the Facility tab. For more information, see “Setting the type of staff at the facility” earlier in this chapter. 14 Viewing the salary cost calculations The salary cost calculations indicate the budgetary requirements for each staff type. • To review the salary cost calculations for existing staff and salary values, switch to the Salary Cost Calculations tab. • To review the salary cost calculations for new staff and salary values, type new values in the Annual Salary (Local Currency) and Existing Staff columns for any given staff type, and press ENTER. The application automatically recalculates the rest of the worksheet. NOTE Changing the annual salary or existing staff on this worksheet does not alter the corresponding values on other worksheets of the WISN study. 15 Saving the WISN study To save the WISN study, follow these steps: 1.Click the Save button at the top of the application window. The Save As dialog box appears. 2.Navigate to a convenient location on your computer, or use the default location that the application automatically supplies. TIP We strongly recommend that you use the default folder for all WISN studies. This way, you can run comparison reports on multiple studies with ease (see Chapter 3). The built-in default folder for your WISN studies is WISN Documents under Documents (Windows 7 and Windows Vista) or My Documents (Windows XP). 1.Type a name for the WISN study file in the File name field, and click Save. The Save As dialog box closes, and the application saves the WISN study file in the specified location. TIP You can overwrite an existing WISN study file by selecting this file in the Save As dialog box. 16 3. Working with reports In this chapter About reports - Creating a report - Exploring the Preview window - Navigating the report - Saving and opening a report 18 18 19 20 20 Changing the view of the report 21 Changing the appearance of report pages - Changing the background color of report pages - Adding a watermark Searching the text of the report Printing, exporting, and distributing the report - Setting up the page - Setting the scale of the report - Printing the report - Exporting and distributing the report 22 22 22 25 26 26 26 27 28 17 About reports Reports are printable documents that provide in-depth information and unique perspectives into WISN studies. These documents include dynamically generated tables and charts for ease of comprehension and added insight. The application enables you to create two types of reports: • Summary report. This report compares the difference between existing and calculated staffing and WISN ratios for multiple WISN studies. • Institution report. This report provides a detailed look at a single WISN study. Creating a report You can create either type of report at any time from the application’s start page. • To create a summary report, follow these steps: 1.Click Build summary report on the start page. The Build Summary Report dialog box appears. 2.If necessary, in the Folders pane at the top of the dialog box, navigate to the folder that contains the WISN studies that you want to compare. All the studies at this location appear in the lower pane of the dialog box. 3.Check the checkboxes to the left of the WISN studies that you want to compare, and click OK. The Build Summary Report dialog box closes, and the application displays the sum mary report in the Preview window. • To create an institution report, follow these steps: 1.Click Build an institution report on the start page. The Build an Institution Report dialog box appears. 2.If necessary, in the Folders pane at the top of the dialog box, navigate to the folder that contains the WISN study that you want to use for the report. All the studies at this location appear in the lower pane of the dialog box. 3.Check the checkbox to the left of the WISN study that you want to use, and click OK. The Build an Institution Report dialog box closes, and the application displays the institution report in the Preview window. 18 Exploring the Preview window The Preview window displays your report and provides tools for customizing its appearance, saving it as a file on your computer, and printing it on your printer. The interface of the Preview window includes the following components: • Main menu. The main menu organizes the available commands and options of the Preview window into three submenus: File, View, and Background. The main menu appears by default along the top of the application window. • Toolbar. The toolbar provides graphical icons or tools for commonly used commands and options. It appears by default between the main menu and the report area. • Report area. The report area occupies the large lower portion of the Preview window. It displays the contents of the report. • Status bar.The status bar appears along the bottom edge of the application window. It displays the current page number of the report as well as the zoom level. TIP You can show or hide the toolbar or the status bar by checking or unchecking the Toolbar and Status Bar options under View in the main menu. 19 The Preview window appears automatically when you create a report from the start page of the application. Each report opens in its own Preview window. You may have multiple Preview windows open at the same time. • To customize the toolbar commands, menu commands, and general properties of the Preview window, choose View > Customize from the main menu. The Customization dialog box appears. We recommend this dialog box for advanced users only. Navigating the report To navigate the report in the Preview window, do any of the following: • To go to the next page in the report, click the Next Page button in the toolbar. • To go to the previous page in the report, click the Previous Page button toolbar. in the • To go to the first page of the report, click the First Page button in the toolbar. • To go to the last page of the report, click the Last Page button in the toolbar. Saving and opening a report The application enables you to save your report in its native format (PRNX). Once saved, you can open it again at any time in the Preview window. NOTE You can share your report file with other users as long as they have the WISN application installed on their systems. Otherwise, their computers cannot open the report’s PRNX file. To share your report with non-WISN users, simply export the report to a common file format, and then share the exported version. For more information, see “Printing, exporting, and distributing the report” later in this chapter. • To save a report, follow these steps: 1.Click the Save button in the toolbar. The Save As dialog box appears. 2.If necessary, navigate to a convenient location for the saved report, and type a file name for the report in the File name field. 3.Click Save. The Save As dialog box closes, and the application saves your report in PRNX format. • To open a previously saved report, follow these steps: 1.Click the Open button in the toolbar. The Open dialog box appears. 2.If necessary, navigate to the location of the report that you wish to open. 3.Double-click the report, or select the report and then click Open. The Open dialog box closes, and the application loads the saved report into the Preview window. 20 Changing the view of the report The application enables you to change the view of the report in the Preview window in a variety of ways. NOTE These commands and options simply change the view of the report as it appears in the Preview window.They do not affect the way that the application prints or exports your report. If you want to adjust the physical properties of the printed or exported report, see “Printing, exporting, and distributing the report” later in this chapter. in the toolbar. Then • To change the position of the report, click to select the Hand tool move the mouse pointer into the display area, hold down the mouse button, and drag the mouse. The Hand tool pushes the report in the direction that you drag. When you are finished, click the Hand tool again to deselect it. • To change the magnification level of the report, do one of the following: To switch between 100% and whole-page magnification, click to select the Magnifier tool in the toolbar. Then move the mouse pointer into the display area, and click any page of the report. If the current magnification level is less than 100%, the Magnifier tool changes it to 100% exactly. If the current magnification level is 100% or more, the Magnifier tool changes it to the whole-page magnification setting, so that the selected report page fits inside the Preview window; the exact percentage depends on the physical dimensions of your screen as well as the current dimensions of the Preview window. Continue clicking the report page with the Magnifier tool to switch back and forth. When you are finished, click to deselect the Magnifier tool in the toolbar. To increase or decrease the magnification level in increments of 5%, go to the toolbar, and click the Zoom In button or the Zoom Out button . Zooming in increases magnification, while zooming out decreases it. To set the magnification level to a custom percentage, enter the percentage value directly in the Zoom field in the toolbar. To apply a preset magnification level, click to open the Zoom drop-down menu in the toolbar, and choose an option. Your choices include common percentage values as well as four special functions. Page Width sets the magnification level to the width of a single report page, including margins; Text Width sets the magnification level to the width of the text on the report page, ignoring margins; Whole Page sets the magnification level so that a single report page fits in the Preview window; and Two Pages sets the magnification level so that two report pages fit side by side in the Preview window. • To change the arrangement of report pages in the Preview window, look under View > Page Layout in the main menu, and choose an option from the submenu that appears. Choose Facing to arrange the pages side by side, or choose Continuous to arrange them in vertical columns. 21 • To change the layout of multiple report pages in the Preview window, click the Multiple Pages button in the toolbar. A grid of page icons appears. Move the mouse pointer over the icons to select them. When the selection in the grid matches the number of pages that you want to display horizontally and vertically in the Preview window, click the mouse button. If you need more page icons in either direction, move the mouse pointer off the right side or the bottom side of the grid. To turn off the Multiple Pages feature, click Cancel at the bottom of the grid. Changing the appearance of report pages The application enables you to change the background color of the report pages as well as apply a custom watermark, which is a string of text or a graphic that appears on one or more report pages. Changing the background color of report pages • To change the background color of the report pages, follow these steps: 1.Choose Background > Color from the main menu, or click the Color button The control panel for the background color appears. in the toolbar. 2.Do any of the following: To select a custom color, switch to the Custom tab, and click any of the color swatches. To select a Web-safe color, or one that looks the same across virtually all computers and devices, switch to the Web tab, and choose from any of the colors in the menu. To select from system colors, or the colors currently defined in your Windows settings, switch to the System tab, and choose from any of the colors in the menu. Adding a watermark The application enables you to create a watermark from a string or text or an image file. These watermarks are called text watermarks and picture watermarks, respectively. TIP You can apply both a text watermark and a picture watermark to the same report. 22 • To add a text watermark, follow these steps: 1.Choose Background > Watermark from the main menu, or click the Watermark button in the toolbar. The Watermark dialog box appears. 2.If necessary, switch to the Text Watermark tab. 3.In the Text field, type the text of the watermark, or choose from several preset text messages by opening the drop-down menu. 4.Set the appearance attributes of the text: From the Direction drop-down menu, choose the way in which the text should run. From the Color drop-down menu, choose the color of the text. From the Font drop-down menu, choose the typeface of the text. From the Size drop-down menu, choose the type size of the text. Check the Bold option to apply boldface type. Check the Italic option to apply italic type. 5.Drag the Transparency slider or type a value directly in the Transparency field to set the level of transparency of the text. Transparency values range from 0 to 255, with 0 representing complete opacity and 255 representing complete transparency. 6.Under Position, choose an option: Choose In front to place the watermark on top of the text and graphics in the report. Choose Behind to place the watermark beneath the text and graphics in the report. 23 7. Under Page Range, choose an option: Choose All to place the watermark on each report page. Choose Pages to place the watermark on select pages only, and then enter the desired pages or page ranges in the field. 8.Click OK. The Watermark dialog box closes, and the application adds the watermark to your report. • To add a picture watermark, follow these steps: 1.Choose Background > Watermark from the main menu, or click the Watermark button in the toolbar. The Watermark dialog box appears. 2.If necessary, switch to the Picture Watermark tab. 3.To choose the image for the watermark, click Load image. The Select Picture dialog box appears. Navigate to the location of the image file, and then either double-click the image file or select it and click Open. 4.From the Size mode drop-down menu, choose an option: Choose Clip to show the image file in its native dimensions. If these are larger than the page dimensions, the image is cropped to fit. Choose Stretch to change the dimensions of the image to match those of the page exactly. Choose Zoom to change the dimensions of the image to match those of the page as closely as possible without stretching the image. 24 5.From the Horizontal alignment and Vertical alignment drop-down menus, choose the horizontal and vertical alignment options for the position of the image on the page. 6.Check the Tiling option if you want the image to tile, or repeat itself as often as necessary to fill every square unit on the report page. Note that tiling produces no visible effect under the Stretch size mode (see Step 4). 7.Drag the Transparency slider or type a value directly in the Transparency field to set the level of transparency of the image. Transparency values range from 0 to 255, with 0 representing complete opacity and 255 representing complete transparency. 8.Under Position, choose an option: Choose In front to place the watermark on top of the text and graphics in the report. Choose Behind to place the watermark beneath the text and graphics in the report. 9.Under Page Range, choose an option: Choose All to place the watermark on each report page. Choose Pages to place the watermark on select pages only, and then enter the desired pages or page ranges in the field. 10.Click OK. The Watermark dialog box closes, and the application adds the watermark to your report. TIP Click the Clear All button under the watermark preview to remove the current watermark in its entirety. If your watermark combines text with an image, the application removes both elements. Searching the text of the report • To search the current report for a target word or string of text, follow these steps: 1.Click the Search button in the toolbar. The Find dialog box appears. 2.In the Find what field, type the target text, or open the drop-down menu and choose text from previous searches. 3.Set the search options: Check the Match case option if the search should consider the case of the target text to determine a match. For example, searching for wisn with Match case enabled does not locate occurrences of WISN in the report. Check the Match whole word option if the search should not find occurrences of the target text within other words. For example, searching for is with Match whole word enabled does not return the middle characters of WISN as a match. Check the Search up option to conduct the search backwards, from the current location in the report to the top of the first page. By default, the search goes from the current location in the report to the bottom of the last page. 25 4.Click Find Next. The application locates the first occurrence of the target text in the report and highlights this occurrence in the Preview window. Continue clicking Find Next to locate subsequent occurrences. 5.When you are finished, click Close. The Find dialog box closes. Printing, exporting, and distributing the report The application provides many options for customizing the printed or electronic output of your report. Setting up the page Setting page properties enables you to control the printout of your report. To set up the page, follow these steps: 1.Choose File > Page Setup from the main menu, or click the Page Setup button the toolbar. The Page Setup dialog box appears. in 2.Describe the paper in your printer with the controls under Paper: Choose the size of the paper in your printer from the Size drop-down menu. Choose the source of the paper in your printer from the Source drop-down menu. 3.Set the orientation of the printout by choosing an option under Orientation: Choose Portrait to make the report taller than it is wide (for example, 8.5 × 11 inches). Choose Landscape to make the report wider than it is tall (for example, 11 × 8.5 inches). 4.Set the size of the margins in the fields under Margins. The Left, Right, Top, and Bottom fields represent the left, right, top, and bottom margins, respectively, and all measurements are expressed in inches. TIP To review or change your printer settings from the Page Setup dialog box, click the Printer button. 5.Click OK. The Page Setup dialog box closes, and the application makes the changes to your page settings. Setting the scale of the report The scale of a report is the ratio between the width of one report page, or any single page in the report, and the width of one printed page, or the page as it is printed or exported. By default, the scale is 100%, meaning that the width of a report page is exactly equal to the width of a printed page. 26 • To set the scale of the report, click the Scale button panel appears directly below the toolbar. in the toolbar. The Scaling control To scale the report by percent, select the Adjust to option in the Scaling control panel, and then type a percentage value in the field to the right of this option. A value of 100% indicates the report prints at normal width; a value of 200% indicates that the report prints at twice normal width, while a value of 50% indicates that the report prints at half the normal width, and so on. To scale the report by number of pages, select the Fit to option in the Scaling control panel, and then, in the field to the right of this option, type the number of printed pages whose combined width should equal the width of a single report page. For example, typing 3 in this field spreads the width of a single report page over the combined width of three printed pages. NOTE Scaling by percent and scaling by page width are two different ways of expressing the same concept. Therefore, changing the value of one option changes the value of the other. Printing the report The application provides two different methods of printing your report: • Print. By this method, the application enables you to select and set up your printer before printing. • Quick Print. By this method, the application sends your printout directly to your computer’s default printer using the current printer settings. While the Quick Print method is convenient for creating rough drafts, the Print method provides more control for finished reports that you intend to distribute to others. • To print a report using the Print method, follow these steps: 1.Look under File in the main menu and choose the first Print option, or click the Print button in the toolbar. The standard Print dialog box for Windows appears. 2.In the Print dialog box, choose a printer to use, select a page range to print, specify the number of copies to print out, and set any other options that you require, and click Print. The Print dialog box closes, and the application sends your report to the selected printer using the specified options and settings. • To print a report using the Quick Print method, look under File in the main menu and choose the second Print option, or click the Quick Print button in the toolbar. The application sends your report to your default printer using the current printer settings. TIP Before you print, you might want to review or change the page settings to ensure that the report prints out as you intend it. For more information, see “Setting up the page” earlier in this chapter. 27 Exporting and distributing the report The application enables you to export your report, or convert it to a different electronic format, for sharing with other computer users who do not have theWISN application. Further, the application’s Send Via Email feature simplifies the task of distributing your exported report to email contacts. You can export to any of nine available formats: • PDF. This format opens in Adobe Acrobat. • HTML. This format opens in any Web browser, such as Microsoft Internet Explorer. • MHT. This format opens in Microsoft Internet Explorer. • RTF. This format opens in any word processor, such as Microsoft Word. • XLS. This format opens in Microsoft Excel. • XLSX. This format opens in Microsoft Excel 2007. • CSV. This format opens in any spreadsheet application, such as Microsoft Excel. • Text. This format opens in any text editor, such as Notepad. • Image. This format opens in any image editor or image viewer. CAUTION Not all export formats render your report exactly as it appears in the Preview window. For example, exporting to RTF strips out the graphical elements of your report, since this format is text-based. Therefore, you should always review your exported report before you share it with others. If you are not sure which format to use, select PDF. It provides a very accurate conversion while maintaining high compatibility. • To export a report, follow these steps: 1.Look under File > Export Document in the main menu and choose your preferred export format from the submenu that appears, or click the inverted triangle to the right of the Export button in the toolbar and choose your preferred export format from the pop-up menu. The application displays the Export Options dialog box for your selected format. TIP After you select an export format from the toolbar button’s pop-up menu for the first time, the application remembers your choice. In the future, you can click the Export button itself, not the inverted triangle, to export to your preferred format. To change the format for subsequent exports, click the inverted triangle again, and choose a new format from the pop-up menu. 28 2.Adjust the export settings as you require, and click OK. The Export Options dialog box closes, and the application opens the Save As dialog box. 3.Navigate to a convenient location on your computer for the exported report file or files, and type a name for the exported report in the File name field. (If you are exporting to multiple files, the application appends a suffix to each subsequent file). 4.Click Save. The Save As dialog box closes, and the application exports your report to the specified location on your computer. • To send your report by email, follow these steps: 1.Look under File > Send via Email in the main menu and choose your preferred export format from the submenu that appears, or click the inverted triangle to the right of the Send via Email button in the toolbar and choose your preferred export format from the pop-up menu. 2.The application steps you through the export procedure as described above.Upon completion, your default email program opens a new message window with your exported report as an attachment. 3.Address and send the email. NOTE If you have already exported your report, you do not need to re-export it using the Send via Email feature just to share your report by email. Simply open a new message in your email application and attach your exported report file or files. 29 4. Working with dictionaries In this chapter About the Dictionary Manager 30 Adding a dictionary element - Adding an element to the Geographic dictionary - Adding an element to the Staff Types dictionary 31 32 32 33 Editing a dictionary element 33 Deleting a dictionary element 34 About the Dictionary Manager The Dictionary Manager enables you to review and change the contents of an application dictionary, or data repository. A dictionary consists of a hierarchical list of items, or elements. The application makes use of two built-in dictionaries: • Geographic. This dictionary contains a hierarchical list of countries and regions. • Staff types. This dictionary contains a hierarchical list of personnel functions and jobs. Using the Dictionary Manager, you may add or subtract elements to either dictionary at any time. CAUTION Removing elements from the dictionary can affect previously saved WISN studies if those studies refer to the dictionary elements in question. 31 • To open the Dictionary Manager, click the Dictionary Manager button at the top of the WISN study, or click Administrator tasks from the start page. • To select a dictionary from the Dictionary Manager, click the desired dictionary in the Dictionaries list in the pane on the left. The elements of this dictionary appear in the Dictionary Elements list in the pane on the right. • To expand or collapse the list of details under any given dictionary element, click the + or − button, respectively, to the left of the element name. If no such button appears next to the element name, then the element does not currently contain details. Adding a dictionary element The procedure for adding a new element to either dictionary is essentially the same, but since the content of each dictionary is different, we provide two sets of instructions here. Adding an element to the Geographic dictionary To add an element to the geographic dictionary, follow these steps: 1.Select the Geographic dictionary from the Dictionaries list. 2.Click the Create Element button in the toolbar above the Dictionary Elements list. The Create Element dialog box appears. 3.In the Country field, do one of the following: If the country for the new element already exists in the dictionary, select the country from the drop-down menu. If the country for the new element does not yet exist in the dictionary, type the name of the country in the field. When you create the element, the application adds this country to the dictionary. 4.In the Region field, do one of the following: If the region for the new element already exists in the dictionary, select the region from the drop-down menu. If the region for the new element does not yet exist in the dictionary, type the name of the region in the field. When you create the element, the application adds this region to the dictionary. 5.In the District field, type the name of the new element’s district. If you do not want to specify a district for your new element, leave this field blank. 6.Click Add. The Create Element dialog box closes, and the application adds the new element to the dictionary. • To close the Create Element dialog box without adding the new element, click Cancel. 32 Adding an element to the Staff Types dictionary To add an element to the Staff Types dictionary, follow these steps: 1.Select the Staff Types dictionary from the Dictionaries list. 2.Click the Create Element button in the toolbar above the Dictionary Elements list. The Create Element dialog box appears. 3.In the Institution type field, do one of the following: If the institution type for the new element already exists in the dictionary, select the institution type from the drop-down menu. If the institution type for the new element does not yet exist in the dictionary, type the name of the institution type in the field. When you create the element, the application adds this institution type to the dictionary. 4.In the Specialist category field, do one of the following: If the specialist category for the new element already exists in the dictionary, select the specialist category from the drop-down menu. If the specialist category for the new element does not yet exist in the dictionary, type the name of the specialist category in the field. When you create the element, the application adds this specialist category to the dictionary. 5.In the Specialist Group field, type the name of the new element’s specialist group. If you do not want to specify a specialist group for your new element, leave this field blank. 6.Click Add. The Create Element dialog box closes, and the application adds the new element to the dictionary. • To close the Create Element dialog box without adding the new element, click Cancel. Editing a dictionary element To edit a dictionary element, follow these steps: 1.In the Dictionary Elements list, click to select the dictionary element that you want to edit. 2.In the toolbar above the Dictionary Elements list, click the Edit Element button Edit Element dialog box appears. . The 3.In the Name field, type the new name for the element. 4.Click OK. The Edit Element dialog box closes, and the application changes the nam of the element. • To close the Edit Element dialog box without changing the name of the element, click Cancel. 33 NOTE If you specify the name of an existing element in Step 3, the application does not move the edited element’s details to the existing element. Instead, you get two elements with the same name but with differing details. Deleting a dictionary element To delete a dictionary element, follow these steps: 1.In the Dictionary Elements list, click to select the dictionary element that you want to delete. 2.In the toolbar above the Dictionary Elements list, click the Delete Element button A confirmation message appears. . 3.Click Yes to delete the selected element, or click No to cancel. NOTE Deleting an element also deletes all its details. For example, if the Wisonia dictionary element contains the Lower Lands region element and the Nice Views district element, then deleting Wisonia also deletes Lower Lands and Nice Views, along with all the other regions and districts under the Wisonia element. 34 The Workload Indicators of Staffing Need (WISN) software application is a tool for using a computer to record, analyze, and report data related to staffing status and requirements at health facilities. The software complements the revised Workload Indicators of Staffing Need (WISN) : User’s Manual. It assumes that the software user is familiar with the terms, concepts, and methodologies presented in it. This software manual starts with an overview of the software application’s features. It then gives step-by-step instructions for completing a variety of tasks in order to manipulate the data and produce reports. ISBN 978 92 4 150019 7