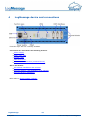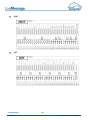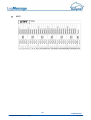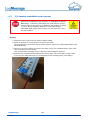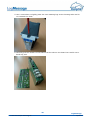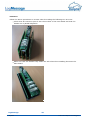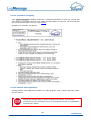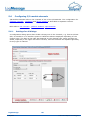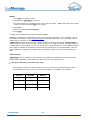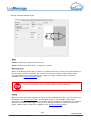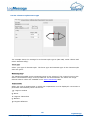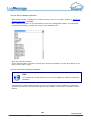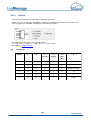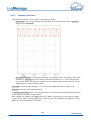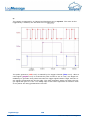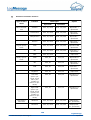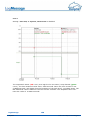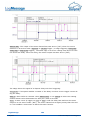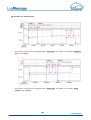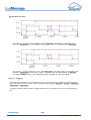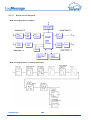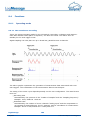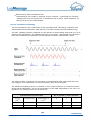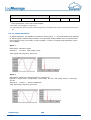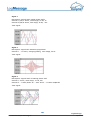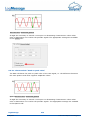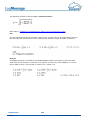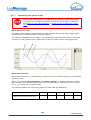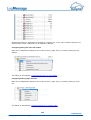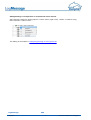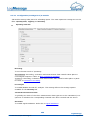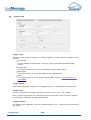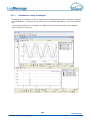
1
Table of contents 1 LogMessage 1 Safety Advice ............................................................................................... 2 2 Introduction ............................................................................................... 3 Included ........................................................................................... in delivery 4 System........................................................................................... requirements 5 Symbols ........................................................................................... used in this documentation 6 3 Getting started ............................................................................................... 7 Starting ........................................................................................... LogMessage 8 Installing ........................................................................................... programs 9 PC connection ........................................................................................... 10 Basic ........................................................................................... settings 13 4 LogMessage ............................................................................................... device and connections 14 Device ........................................................................................... types 15 Power........................................................................................... supply 16 LED lamps, ........................................................................................... LAN, USB 17 General ........................................................................................... LEDs 18 COM interfaces, ........................................................................................... CAN 20 I/O module ........................................................................................... connections (terminal blocks) 23 I/O module ........................................................................................... installation and removal 28 Internal ........................................................................................... memory card installation and upgrade 32 Internal ........................................................................................... battery installation 36 5 Configuration ............................................................................................... and operation 40 Overview ........................................................................................... 41 Configuration ........................................................................................... via an internet browser 43 Unknown .......................................................................................... IP address? 43 Settings .......................................................................................... 44 Network ............................................................................... 44 Clock ............................................................................... settings 46 NTP ............................................................................... status 47 Configuration .......................................................................................... 47 View............................................................................... channels 48 Saving ............................................................................... and loading configurations 48 Default ............................................................................... configuration 49 Service .......................................................................................... 50 System ............................................................................... report 50 System .......................................................................................... 51 Update ............................................................................... firmware 51 Firmware ............................................................................... changelog 53 Restart ............................................................................... main application 53 Device ............................................................................... restart (reboot) 54 LogMessage July 2012 I © 2010-2012 Delphin Technology AG Configuring ........................................................................................... a LogMessage device 55 Device .......................................................................................... configuration (channel configuration) 56 Network .......................................................................................... settings, NTP 58 Storage ........................................................................................... Group 60 Data transfer ........................................................................................... to USB memory stick 64 Configuring ........................................................................................... I/O module channels 66 Settings .......................................................................................... for all dialogs 66 Tables .......................................................................................... 70 Global ............................................................................... linearisation tables 71 Global ............................................................................... setpoint tables 73 I/O .......................................................................................... module 76 I/O .......................................................................................... module AMDT 78 Analog .......................................................................................... input 79 Voltage ............................................................................... sensor type 80 Resistor ............................................................................... sensor type 81 Current ............................................................................... sensor type 83 Current ............................................................................... sensor type (0/4...20 mA) 84 Resistance ............................................................................... thermometer sensor type 85 Therm ............................................................................... ocouple sensor type 87 Ph-probe ............................................................................... sensor type 88 Digital .......................................................................................... input with counter/frequency measurement 89 Digital .......................................................................................... input 91 Analog .......................................................................................... output 92 Digital .......................................................................................... output 93 Configuring ........................................................................................... interfaces 94 CAN-Controller .......................................................................................... 94 CAN-Driver ............................................................................... 96 CAN............................................................................... -Bus-Channel 96 Configuring ........................................................................................... Software channels 101 General .......................................................................................... settings for Software channels 102 Channelgroups ............................................................................... 102 Edge ............................................................................... and level triggers 102 Basic ............................................................................... channel selection 103 Advanced ............................................................................... channel selection 103 Inherit ............................................................................... status 104 Advanced ............................................................................... settings tab (software channels) 105 Accum .......................................................................................... ulator 106 Operating .......................................................................................... hours counter 106 Differentiator .......................................................................................... 106 FlipFlop .......................................................................................... 107 Lim .......................................................................................... it 109 Im .......................................................................................... pulse generator 111 Integrator .......................................................................................... 121 Linearization .......................................................................................... 121 Logic .......................................................................................... 123 Variables .......................................................................................... 126 Average .......................................................................................... 127 Pulse .......................................................................................... width modulation (PWM) 127 II © 2010-2012 Delphin Technology AG LogMessage July 2012 Calculation .......................................................................................... channel 128 Collective .......................................................................................... fault 131 Setpoint .......................................................................................... 132 Statistics .......................................................................................... 134 Status .......................................................................................... monitor 135 Stopwatch .......................................................................................... 136 System .......................................................................................... monitor 141 Tim .......................................................................................... er 141 Trigger .......................................................................................... 144 Alarm .......................................................................................... clock 145 Counter .......................................................................................... 146 6 Connection ............................................................................................... examples 150 Connecting ........................................................................................... sensors 151 Connecting ........................................................................................... actuators 155 7 Measurement ............................................................................................... technology 157 Galvanic ........................................................................................... isolation 158 Earthing ........................................................................................... 159 Earth ........................................................................................... loops 160 Shielding ........................................................................................... 162 ESD protection ........................................................................................... 163 Potential ........................................................................................... differences 164 8 Technical ............................................................................................... specifications 166 Main........................................................................................... device 167 I/O modules ........................................................................................... 170 I/O .......................................................................................... modules: AAST, ADGT, ADIT and ADVT 170 I/O .......................................................................................... modules: DIOT, IOIT and OTPT 173 I/O .......................................................................................... module: ADFT 175 I/O .......................................................................................... module: AMDT 177 9 I/O module ............................................................................................... AMDT 178 Safety ........................................................................................... advice 179 Introduction ........................................................................................... 180 Included .......................................................................................... in delivery 180 Sym .......................................................................................... bols used in this documentation 181 Project .......................................................................................... planning 182 Hardware ........................................................................................... 184 Connector .......................................................................................... panel (industrial) 184 Connector .......................................................................................... panel (laboratory) 185 Block .......................................................................................... circuit diagram 186 Technical .......................................................................................... specifications 187 Galvanic ............................................................................... isolation 187 Analog ............................................................................... inputs 187 Analog ............................................................................... outputs 188 Digital ............................................................................... inputs 189 Counter ............................................................................... 189 Digital ............................................................................... outputs 190 Attachm .......................................................................................... ent 191 LogMessage July 2012 III © 2010-2012 Delphin Technology AG AC-coupling ............................................................................... for analog inputs 191 External ............................................................................... cicuits 192 Functions ........................................................................................... 194 Operating .......................................................................................... mode 194 Non-Continuous ............................................................................... recording 194 Continuous ............................................................................... recording 195 Signal ............................................................................... simulation 196 Synchronizing ............................................................................... two AMDT modules 199 Triggering .......................................................................................... and recording 204 Redundant ............................................................................... trigger source 206 Tim .......................................................................................... e signal 208 Digital ............................................................................... filter 208 Digital ............................................................................... integrator 208 FFT .......................................................................................... analysis / frequency spectrum 209 Characteristics .......................................................................................... 209 Characteristic ............................................................................... "Maximum value", "minimum value" 211 Characteristic ............................................................................... "Peak-to-peak value" 212 Characteristic ............................................................................... "Mean value" 213 Characteristic ............................................................................... "True RMS value" 214 Characteristic ............................................................................... "Frequency of main amplitude" 214 Characteristic ............................................................................... "Main amplitude" 215 Characteristic ............................................................................... "Phase of main amplitude" 215 Characteristic "Amplitude of 1X/2X/3X/xX com ............................................................................... ponent" 216 Characteristic "Phase of the 1X/2X/3X/xX com ............................................................................... ponent" 217 Characteristic ............................................................................... "Rotation speed" 218 Characteristic ............................................................................... "Maximum of vector sum" 219 Characteristic ............................................................................... "Mean of product" 220 Characteristic "Frequency of main amplitude, band 1/2/3" ............................................................................... 221 Characteristic ............................................................................... "Main amplitude, band 1/2/3" 221 Characteristic ............................................................................... "RMS value, band 1/2/3" 223 Characteristic ............................................................................... "Sum value" 225 Characteristic ............................................................................... "Remainder value" 225 Measuring .......................................................................................... frequency or speed 227 Measuring .......................................................................................... the phase angle 229 Monitoring .......................................................................................... 231 Configuration ........................................................................................... and operation 232 Configuration .......................................................................................... using the DataService Configurator 232 Configuration/settings ............................................................................... for I/O module 235 I/O............................................................................... module / measurement block counter 241 Configuration/settings ............................................................................... for analog input 241 Configuration/settings ............................................................................... for FFT/spectrum 246 Configuration/settings ............................................................................... for characteristics 247 Configuration/settings ............................................................................... for analog output 249 Configuration/settings ............................................................................... for digital input 250 Configuration/settings ............................................................................... for counter 251 IV © 2010-2012 Delphin Technology AG LogMessage July 2012 Configuration/settings ............................................................................... for digital output 252 Visualization .......................................................................................... using ProfiSignal 253 Firm .......................................................................................... ware update 254 Information ........................................................................................... on applications 256 Appendix ........................................................................................... to older AMDT hardware 257 10 Appendix: ............................................................................................... 259 EC declaration ........................................................................................... on conformity LogMessage 259 ISO 9001 ........................................................................................... certificate 260 LogMessage July 2012 V © 2010-2012 Delphin Technology AG LogMessage LogMessage devices are designed for use as modular measurement, control, and monitoring devices and are equipped with many settings and connection options. They are also equip ped with a range of I/O modules, field bus interfaces, and software channels to enable the performance of monitoring, control, and regulation tasks. LogMessage devices have 16 GB internal memories and can function as stand alone, independent units. Acquired data can be transferred via interfaces in runtime mode, via time-controlled events, or via the devi ce's USB ports. Copyright © 2003-2012 Delphin Technology AG. All rights reserved. This document's content, especially text, images, and graphics are protected by copyright. When not otherwise stated, the copyright belongs to Delphin Technology AG, Lustheide 81, in 51427 Bergisch Gladbach, Germany. All the trademarks and brands used in this manual refer only to the respective product or trademark holder. Delphin Technology claims no rights other than those to its own trade marks and brands. 1 © 2010-2012 Delphin Technology AG LogMessage July 2012 1 Safety Advice WARNING! Connector terminals on I/O modules carry electrical potential from the attached sensors/actuators. Before coming into contact with the connectors, ensure the power is off. There should be no voltage at the connector terminals when the attached sensors ha ve varying potentials or earthed high potentials, e.g. when measuring the elec trical current of a mains voltage phase. Differences in electrical potential between two channels of a module can not be determined from the Measurement data. Refer to Potential differences. I/O module, memory card, battery installation installation/replacement Electronic components are sensitive to ESD (Electro-Static Discharge). Therefore, dischar ge any electrostatic energy before opening the device for I/O module or memory card in stallation/replacement. We recommend wearing a wrist band (static discharge wrist band) and to carry out the work on a conductive surface. ESD damage can have varying consequences from minor deviations in data recording through to full system failure. LogMessage July 2012 2 © 2010-2012 Delphin Technology AG 2 Introduction Dear User, Thank you for purchasing a device from the LogMessage series. You have acquired a high quality product with extensive options for data acquisition and processing. This manual is included in the delivery. Always keep the manual available for reference. To avoid any damage occurring to yourself or your equipment, carefully follow the guidance and safety precautions given in this manual. If your equipment has a problem that this ma nual does not address, please contact us. This manual is intended for technicians and engineers or similarly qualified persons wishing to use the device. If you find errors in the product or in this documentation, or if you have any suggestions for its improvement, we welcome your feedback. Contact: Delphin Technology AG Lustheide 81 51427 Bergisch Gladbach (Refrath), Germany Telephone: +49 2204 97685-0 Telefax: +49 2204 97685 -85 Email: [email protected] Internet: www.delphin.de Contact USA: Delphin Technology Corp. 4860 Cox Road, Suite 2000 Glen Allen, VA 23660 Virginia, USA Telephone: +1 804 217 8391 Telefax: +1 804 747 6182 Email: [email protected] Internet: www.delphin.com 3 © 2010-2012 Delphin Technology AG LogMessage July 2012 2.1 Included in delivery Included in delivery: LogMessage device) Brackets for rail mountings Ethernet cross-cable RS232 connection cable with D-SUB DB9 connectors CD containing ProfiSignal software Documentation The devices can be equipped with various I / O modules. Available I / O modules: AAST: 4 analog inputs for V, mV, 20mA, Pt100, thermocouples 2 digital inputs 4 analog outputs 20mA 2 digital outputs ADFT: 8 analog inputs for V, mV, 20mA 2 frequency or counter inputs 2 digital inputs 2 analog outputs 10V 4 digital outputs ADGT V2.0: 8 analog inputs for V, mV, 20mA, Pt100, thermocouples ADGT V3.0: 8 analog inputs for V, mV, 20mA, Pt100, thermocouples ADIT: 10 analog inputs for V, mV, 20mA, Pt100, thermocouples 1 analog output 20mA 1 digital output ADVT: 15 analog inputs for V, mV, 20mA, thermocouples AMDT: module with DSP (enables calculation functions) 8 analog inputs for V, mV, 20mA 2 frequency or counter inputs 2 digital inputs 2 analog outputs 10V 4 digital outputs DIOT: 11 frequency or counter inputs 1 digital input 16 digital outputs IOIT: 24 digital inputs 1 digital output OTPT: 1 digital input 24 digital outputs LogMessage July 2012 4 © 2010-2012 Delphin Technology AG 2.2 System requirements The following hardware requirements are the minimum requirements to ensure problem-free operation of the Delphin products. Operating System Microsoft Windows XP 32-bit, Windows Vista, Windows 7 and Windows Server 2008 R2 in the 32-bit- or 64-bit versions, either the English or German versions. Main memory At least 1024 MB* Recommended: 2 ... 3 GB for 32-bit systems, 4 ... 8 GB for 64-bit-systems Monitor At least 1024 x 768 pixel, fixed font size of 96 dpi (100%) resolution CPU A PC with at least 1.6-GHz* Recommended: Systems with dual or 4-core processors from 2.5 GHz or greater Hard disk for Pro fiSig nal-Go at least 70 MB of free hard disk space for Pro fiSig nal-Vie we r at least 70 MB of free hard disk space for Pro fiSig nal-Klicks at least 500 MB of free hard disk space for other Pro fiSig nal-- versions at least 250 MB of free hard disk space 5 © 2010-2012 Delphin Technology AG LogMessage July 2012 2.3 Symbols used in this documentation To make reading of this manual easier, we have used the following symbols: WARNING! This symbol warns of a potential hazard which - if the safety requirements are not followed - may be fatal or cause serious physical injury. Indicates important information. Info Refers to a special option or explains a special feature. We use italics to highlight individual words within the text. Keyboard input is highlighted in this way. Program menus have a grey background with arrows indicating the respective sub-menus which need to be accessed: Connect Add driver (connection) LogMessage device. Also highlighted in grey and displayed in italics are the dialog headings, buttons, check bo xes, input field names, etc. Display status. This should help you to find the relevant fields and buttons or menus within the correspon ding software. Symbols on the device Symbol CE symbol:The CE symbol guarantees that our products meet the requirements of relevant EU directives. Refer also to the EC Declaration of Conformity section. LogMessage July 2012 6 © 2010-2012 Delphin Technology AG 3 Getting started This section explains: The important device connections to commence work. The software that needs to be installed on your PC. How to establish a connection between a PC and the device. The settings required to acquire measurement signals from the device. For detailed information refer to these sections: The section Display devices and connections gives an overview of all the interfaces/ connections/ports and LEDs. The section Configuration and operation explains the different options for setting up the device for measurement tasks. The section on Examples of connections shows the options for connecting standard sensors and actuators and how to configure them. The section on Measurement technology contains general information and recommen dations on using measurement technology. Technical data is available in the Technical specifications section. 7 © 2010-2012 Delphin Technology AG LogMessage July 2012 3.1 Starting LogMessage Just a few steps are required to start using the LogMessage device: Unpack the device. Plug the three-pinned, grey plug from the supplied AC adapter into the socket marked "Power" on the device. Refer also to Display devices and connections. The plug is polarity-protected can be inserted into the socket in only one way. Plug the supplied three-pinned grey connector for the external bus terminal in the socket marked " Ext. BUS“. The terminal possesses a resistor that is necessary for the proper functioning of the bus system. The resistor is required even when a bus (cable) is not connected. Connect the power adapter into the mains socket. The next steps are: Installing programs PC connection Basic settings LogMessage July 2012 8 © 2010-2012 Delphin Technology AG 3.2 Installing programs Administrator rights are required to install the programs. Install the CD ProfiSignal Go. Please ensure that the DataService Configurator is installed as a Program (and not as a Service). Following installation, these two desktop icons should appear: The DataService Configurator from Delphin functions as a link between the PC and mea surement hardware. Delphin hardware is configured using DataService Configurator. Lo g Me ssag e devices are immediately configured in the DataSe rv ice Co nfig urato r. The ProfiSignal program provides evaluation and visualisation functions for measurement data. 9 © 2010-2012 Delphin Technology AG LogMessage July 2012 3.3 PC connection Preparing the PC The factory setting of the IP address is printed on a sticker on the device. If the sticker is lost, the please try the IP address 192.168.251.252 (Net mask: 255.255.240.0) To be able to establish a connection using this address, the PC must be temporarily set to a different address within the same IP segment: 1.Run the network connection dialog. 2.Depending on the operating system being used, the the dialog can be accessed from either the Windows Start button and Network settings or via the Control Panel, Net work and Sharing Center. 3.Display the Properties of the connection to which the device is to connect (usually labelled Local Area Connection). In Windows Vista, click Status , then Properties . 4.Display the Properties for the internet protocol. LogMessage July 2012 10 © 2010-2012 Delphin Technology AG 5.In the next dialog you can set either a fixed address for your PC, or - if the PC is set to DHCP and used in the LAN - use the option of an alternative configuration to pre pare for cases where no network (server) is available (recommended). 6.Enter an address that falls within the same segment as the address of the device (refer to above example). Windows automatically adds the subnet mask. 7.Close all dialogs by clicking OK . Establishing a cable connection Connect the PC and the device using the supplied Ethernet cable. The connection between the device and PC can also be made via a network hub or switch. Establishing a device connection and setting an alternative network address If a different IP address is required, e.g. to operate the device within a LAN, this can be performed using any internet browser. Go to the next section if a change of IP address is not required. 1.Open the internet browser and enter the address http://192.168.7.21 . A connection is established to the device and the start page is displayed. 2.In the Settings section, click Network . This displays the network settings page. 3.Enter the address required for your network at IP Address. The subnet mask and ga teway, or DNS and NTP server can also be entered (refer to web browser configurati on) 4.Click Save when finished to store the settings. The LogMessage device can now be connected to your network. If the PC again requires reconnecting to the device, you may need to set it to the new IP Segment (the first group of three digits). 11 © 2010-2012 Delphin Technology AG LogMessage July 2012 Establishing a connection to the device 1.Start the DataService Configurator to establish a connection and to carry out confi guration. The DataService is starts and the Connections tab is displayed on the left of the Da taService Configurator. 2.Select Connect Add driver (connection) LogMessage device. Alternatively, a LogMessa ge device driver can be added by right-clicking DataService ... . 3.A device search is performed and a dialog displayed with the found device or devices. 4.Double-click the the address of the required device. If no device is found, use the General tab to manually enter the address. Change the port only when the Windows firewall is not being used and/or other ports have been configured within the firewall. 5.Confirm the settings with Connect: Always (default). Connection is then automatic when starting the DataService Configurator. A successful connection is then displayed with an IP address and a status. The Da taService record displays the host name or the address of the PC. LogMessage July 2012 12 © 2010-2012 Delphin Technology AG 3.4 Basic settings The DataService Configurator dialog is split enabling a device to be selected on the left un der Connections and settings to be made on the right under Channels . Displaying measurement data Once a connection has been established (refer to the previous section ) current measure ment data can then be displayed. Double-click on an I/O module to displays its channels. The Value column continuously updates with new measurement data. Displaying scaled measurement data To convert data from the sensor into the required measurement unit requires configuration of the channel. Right click a channel to display the Properties dialog. A general explanation of dialogs is available under settings for all dialogs section. Special settings for different channel types (analog input, analog output) can be found in subsections of the configuring module channels section. The dialog also displays connection diagrams (refer to I/O module connections ). Other settings Setting digital I/O Scaling can also be made for counter inputs. Set which signal (channel) requires out put of a constant level. Settings for data reduction, A/D measurement duration, etc. A number of options are available other than basic scaling, e.g. duration of an A/D conversion, the change required for a new measured value to be stored (data reduc tion), or how the channel is to be monitored. Specific settings for a device Options are available for system monitoring, e.g. CPU utilization or the available me mory, and interface configurations. Calculation channels (subordinate channels) ProfiSignal devices are capable of processing data before it is saved and output. The corresponding settings are described in configuring software channels. 13 © 2010-2012 Delphin Technology AG LogMessage July 2012 4 LogMessage device and connections Function keys are not currently enabled. Connections are described in the following sections: Power supply LEDs, LAN, USB General LEDs COM interfaces I/O module connections (terminal blocks) Also in this section: I/O module installation and removal Internal memory card installation and upgrade Internal battery installation Refer also to Device restart (reboot) LogMessage July 2012 14 © 2010-2012 Delphin Technology AG 4.1 Device types Types Analog inputs (mV, mA, Thermo couples) LM LM LM LM LM 1000 2000 3000 4000 5000 15 8 15 Analog inputs (mV, mA, Thermo couples, Pt100(0)) 10 16 Analog outputs (mV, mA) 1 Digital inputs (frequency measure ments) 12 (11) 24 28 (2) Digital inputs (mV) 17 1 5 2 Sampling rate in measurements per second 600 600 600 10000 80 Galvanic isolation AI to AI ( V DC) 110 110 110 100 650 Module 1 ADVT DIOT ADVT ADFT ADGT ADIT IOIT IOIT ADGT Module 2 Types LM 6000 LM LM LM 7000 8000 9000 30 15 Analog inputs (mV, mA, Thermo couples) 15 Analog inputs (mV, mA, Thermo couples, Pt100(0)) 10 20 Analog outputs (mV, mA) 1 2 12 (11) Digital inputs (frequency measure ments) Digital inputs (mV) 1 16 2 Sampling rate in measurements per second 1200 1200 600 1200 Galvanic isolation AI to AI ( V DC) 110 110 110 110 Module 1 ADVT ADVT ADVT AAST Module 2 ADIT ADVT DIOT AAST 15 © 2010-2012 Delphin Technology AG LogMessage July 2012 4.2 Power supply Input voltage: 12 ... 28 VAC ± 10% / 12 ... 36 V DC ± 10% Info If the device is equipped with the AMDT I/O module the input voltage is 18 VA C / DC Power input Pmax : 10 W Pin assignment Pin Label Description Left 24V Power supply Middle 0V Neutral Right PE Protective Earth , refer to ear thing LogMessage July 2012 16 © 2010-2012 Delphin Technology AG 4.3 LED Right Left LED lamps, LAN, USB Status Description Off Not connected Green, non-flashing Connected, data not being transferred Green, flashing Data transfer Off Half duplex Orange, non-flashing Full duplex Orange, flashing Collision 17 © 2010-2012 Delphin Technology AG LogMessage July 2012 4.4 General LEDs LED descriptions Com Number ponents of LEDs Power 1 Status Mod. 1 1 1 Status Description green Hardware failure, e.g. the device connected to the USB port requires too much power orange Power supply OK red / green Multifunctional display green Status of I/O module Flashing green: Module OK Flashing orange: Main program has ended (no data acquisition / processing) Permanent: normal functioning Slow flashing: BUS identification For ADFT / ADMT: Slow flashing: new firmware being saved Fast flashing: firmware being downloaded Mod. 2 1 Ext. BUS 1 CAN Battery green Status of I/O module green RxD orange TxD green RxD orange TxD red Battery failure / battery low 1 1 The battery for the clock and emergency data backup is flat and must be replaced. Refer to Inter nal battery replacement MEM 1 COM1 1 COM2 LogMessage July 2012 1 green Access to the internal memory green RxD orange TxD green RxD 18 © 2010-2012 Delphin Technology AG Com Number ponents of LEDs COM3 COM4 Status Description orange TxD green RxD orange TxD green RxD orange TxD 1 1 19 © 2010-2012 Delphin Technology AG LogMessage July 2012 4.5 COM interfaces, CAN COM1/CAN Pin assignment Pin Signal Description COM1 (RS485) Description CAN Hou sing Shield 1 Shield 2 CANL - CAN-Bus Low 3 RxD/TxDP/B Receive/transmit data-Plus (RS485) - 4 RTS Control signal for repeaters (TTL) - 5 GND / C 6 VP 7 CANH - CAN-Bus High 8 RxD/TxDN/ A Receive/transmit data-Negative (RS485) - 9 - Shield / protective ground, refer to earthing Shield / protective ground, refer to earthing Data reference potential / neutral Supply voltage / Plus (5V) Not connected Info Galvanic isolation does not exist between CAN and COM1. LogMessage July 2012 20 © 2010-2012 Delphin Technology AG COM2/COM3 Pin assignment Pin Signal Description COM2 (RS485) Description COM3 (RS232) Hou sing Shield 1 Shield 2 RxD - Receive data (RS232) 3 RxD/TxDP/B Receive/transmit data-Plus (RS485) - 4 RTS Control signal for repeaters (TTL) - 5 GND / C 6 VP 7 RTS - 8 RxD/TxDN/ A Receive/transmit data-Negative (RS485) 9 TxD Shield / protective ground, refer to earthing Shield / protective ground, refer to earthing Data reference potential / neutral Supply voltage / Plus (5V) Request to Send (RS232) Transmit data (RS232) Info Galvanic isolation does not exist between COM2 and COM3. 21 © 2010-2012 Delphin Technology AG LogMessage July 2012 COM4 Pin assignment Pin Signal Description Housing Shield Shield / protective ground, refer to earthing 1 DCD Data Carrier Detect (RS232) 2 RxD Receive Data (RS232) 3 TxD Transmit Data (RS232) 4 DTR Data terminal ready (RS232) 5 GND Signal ground 6 - Not connected 7 RTS Request to Send (RS232) 8 CTS Clear to Send (RS232) 9 - Not connected LogMessage July 2012 22 © 2010-2012 Delphin Technology AG 4.6 I/O module connections (terminal blocks) Devices can be equipped with different modules. Below are the the wiring diagrams/terminal assignments for the various I/O modules (in alphabetical order). AAST ADGT Info Versions 1.0 and 2.0 of the ADGT modules have mechanical switches that enable cyclical selection of individual channels. A light ticking is therefore audible during operation. 23 © 2010-2012 Delphin Technology AG LogMessage July 2012 ADIT LogMessage July 2012 24 © 2010-2012 Delphin Technology AG ADVT AMDT and ADFT ADFT and AMDT have identical terminal assignments. For technical reasons, only one ADFT module per system can be used. 25 © 2010-2012 Delphin Technology AG LogMessage July 2012 DIOT IOIT LogMessage July 2012 26 © 2010-2012 Delphin Technology AG OTPT 27 © 2010-2012 Delphin Technology AG LogMessage July 2012 4.7 I/O module installation and removal Electronic components are sensitive to ESD (Electro-Static Discharge). Therefore, discharge any electrostatic energy before opening the device to install an I/O module or memo ry card. We recommend wearing a wrist band (static discharge wrist band) and to carry out the work on a con ductive surface. Removal 1.Disconnect the unit from the mains voltage supply. 2.Remove all plug-in connectors from the device front. When replacing one module with a similar module, leave the cables attached to the terminal blocks. 3.Unscrew the four locking screws at the ends of the two terminal blocks until a dis tinct cracking sound is heard. The screws have retaining rings to prevent their complete removal. 4.Pull the two terminal blocks towards the front. Prise off if necessary using a flat screw at the sides between the terminal block and housing front (see image). LogMessage July 2012 28 © 2010-2012 Delphin Technology AG 5.Use a screwdriver to lightly press the two retaining lugs at the housing sides and le ver towards the front. 6.Carefully pull the module circuit board from the slots in the board. Be careful not to bend any pins. 29 © 2010-2012 Delphin Technology AG LogMessage July 2012 Installation Follow the above procedures in reverse order but taking the following into account: The side of the I/O module with components must point towards the internal circuit board. Check that all connector pins fit into the sockets of the inner board and that the boards are aligned in parallel. Make sure that the boards keep within the side slots when installing them onto the base board. LogMessage July 2012 30 © 2010-2012 Delphin Technology AG Note that the front fits only in one direction to the bottom part. It may be necessary to rotate the module through 180 degrees. Do not fully tighten each screw one after the other. Lightly tighten one screw then move to the next, repeating the procedure until all screws are fully tightened. 31 © 2010-2012 Delphin Technology AG LogMessage July 2012 4.8 Internal memory card installation and upgrade Electronic components are sensitive to ESD (Electro-Static Discharge). Therefore, discharge any electrostatic energy before opening the device to install a memory card. We re commend wearing a wrist band (static discharge wrist band) and to carry out the work on a conductive surface. Removing and replacing the memory card 1.Disconnect the unit from the mains voltage supply. 2.Remove all plug-in connectors from the device front. Leave the cables that are atta ched to the terminals of the terminal blocks. 3.Unscrew the four locking screws at the ends of the two terminal blocks until a dis tinct cracking sound is heard. The screws have retaining rings to prevent their complete removal. 4.Pull the two terminal blocks towards the front. If necessary prise off using a flat screwdriver between the side of the terminal block and housing. LogMessage July 2012 32 © 2010-2012 Delphin Technology AG 5.Use a screwdriver to lightly press the two retaining lugs at the housing sides and le ver towards the front. 6.Remove the memory card from its slot using long-nose pliers or a similar tool. 7.Push in the new memory card, with its "handle" pointing towards the board, until it stops. Use only gentle pressure and do not force. The card fits in one direction only. 33 © 2010-2012 Delphin Technology AG LogMessage July 2012 Installation Follow the above procedures in reverse order but taking the following into account: Check that all connector pins fit into the sockets of the inner board and that the boards are in parallel alignment. Make sure that the boards keep within the side slots when installing them into the base board. LogMessage July 2012 34 © 2010-2012 Delphin Technology AG Note that the front fits only in one direction to the bottom part. It may be necessary to rotate the module through 180 degrees. Do not fully tighten each screw one after the other. Lightly tighten one screw then move to the next, repeating the procedure until all screws are fully tightened. 35 © 2010-2012 Delphin Technology AG LogMessage July 2012 4.9 Internal battery installation Electronic components are sensitive to electrostatic charge. Therefore, discharge any electrostatic before opening the device to replace the battery. We recommend wearing a wrist band (static discharge wrist band) and to carry out the work on a conductive surface. A lithium coin cell battery CR2450 with 3V/575 mAh is used. The battery has a lifespan of at least 10 years. Removal 1.Disconnect the unit from the mains voltage supply. 2.Remove all connectors from the device front. Leave the cables that are attached to the terminals of the terminal blocks. 3.Unscrew the four locking screws at the ends of the two terminal blocks until a dis tinct cracking sound is heard. The screws have retaining rings to prevent their complete removal. 4.Pull the two terminal blocks towards the front. If necessary prise off using a flat screwdriver between the side of the terminal block and housing. LogMessage July 2012 36 © 2010-2012 Delphin Technology AG 5.Use a screwdriver to lightly press the two retaining lugs at the housing sides and le ver towards the front. 6.Remove the battery from its holder using long-nose pliers or a similar tool. Installation Follow the above procedures in reverse order but taking the following into account: When inserting the new battery ensure that the negative pole is towards the board and the plus-pole to the holding bracket. 37 © 2010-2012 Delphin Technology AG LogMessage July 2012 Check that all connector pins fit into the sockets of the inner board and that the boards are in parallel alignment. Make sure that the boards keep within the side slots when installing them into the base board. LogMessage July 2012 38 © 2010-2012 Delphin Technology AG Note that the front fits only in one direction to the bottom part. It may be necessary to rotate the module through 180 degrees. Do not fully tighten each screw one after the other. Lightly tighten one screw then move to the next, repeating the procedure until all screws are fully tightened. 39 © 2010-2012 Delphin Technology AG LogMessage July 2012 5 Configuration and operation The following sections are covered here: The Configuration via web browser explains how to make (device) settings via an in ternet browser. The following functions are possible via the device's web interface: saving and loa ding device configurations; resetting to factory settings; firmware updating. Some basic settings are also possible, e.g. Ethernet interface or device-clock. Basic device settings, such as the network settings or the device ID, is described in the Device configuration section. The Connecting slave devices section explains the configuration process when multi ple devices are being used. Devices are equipped with internal memories to enable configurations to be saved. The Memory section explains how this storage space can be used the space, e.g. for partitioning across different channel groups. The Data transfer to USB memory stick section explains how to externally back up in ternally stored data. Configuring the various I/O module-channels is described in detail in the section on Configuring module channels. Read the Configuring interfaces section on how to use the various interfaces for connecting or exchanging data with external devices. The Configuring software channels section describes the various ways in which to perform calculations on the measurement data or between channels. See also Getting Started , Settings for all dialogs. LogMessage July 2012 40 © 2010-2012 Delphin Technology AG 5.1 Overview See also Getting started Configuration of the most important parameters, such as network settings, can be perfor med using either the Web Interface from the device or the DataService Configurator. Set tings via the web interface are described in the Configuration via an internet browser sec tion. The configuration of sensor and actuator connections, and the definition of calculati on (software channels) takes place via the DataService Configurator and is explained in the following sections. A detailed description of DataService Configurator is available in the Da taService Configurator manual. Clicking DataService Configurator starts the DataService background program and establis hes a connection to the devices (the default for the first installation is explained in the Getting started section). The DataService Configurator dialog is split enabling a device to be selected on the left under Connections and settings to be made on the right under Chan nels . The device itself is considered a "channel" and in the example is listed as "LogMessa ge '192 .168.100.116 ', PoND 2.2 ...". Channel configuration Any configuration performed in the DataService Configurator is considered a channel confi guration even when not strictly concerning a measurement channel, i.e. a device interface, memory group or module. Amendments to configurations take immediate effect with the previous settings being over written. The new settings are saved to the LogMessage device's non-volatile memory and remain there even following a device reset. Open the configuration dialog for a channel by double-clicking the channel name or rightclicking and selecting Properties from the context menu. Objects that do not have this entry in their context menus are not configurable via the DataService Configurator but act as containers, i.e. as channel groups for (more) sub-channels such as the "software channels" group. Channels from a channel group are displayed by clicking the corresponding plus sign ( ). 41 © 2010-2012 Delphin Technology AG LogMessage July 2012 DataService Configurator options Hide or show columns for the different tabs on or off: View ... or View Right panel Visible columns ... Set the DataService Configurator time zone: View Left panel Timezone . Change the DataService Configurator's display language via Options Suppress confirmation requests: Options Change channel order via Options User-defined view ). Visible columns Language . Don't prompt for confirmation. Activate channel move / link (Only available in the Further information is available in the manual for the DataService Configurator. LogMessage July 2012 42 © 2010-2012 Delphin Technology AG 5.2 Configuration via an internet browser The web configuration is performed by entering the IP address (or the DNS name for net works) in the browser's address bar. Any current browser can be used. Cookies are not re quired for the functions and JavaScript is used only for date and time settings. Refer also to Unknown IP address? Info Click Save after entering the settings otherwise they will not be amended within the device. To return to the main menu either click the Back button on your browser or click Back at the bottom of the screen. Settings via the web interface are made in the the following four areas: Settings , Configu ration , Service and System . To display the current status of the NTP client click NTP sta tus or Clock . Many of the settings made through the device web interface can also be made via the DataService Configurator. Refer to Configuring the LogMessage device. The browser display for a device with the address 192.168.100.116, the host name "Lo gMessage" and the domain "example.com". 5.2.1 Unknown IP address? If an IP address has been amended and then forgotten, the new address can be determi ned via a connection to the serial interface. Requirements: A Null modem cable (crossover serial cable, D-SUB DB9 connector coupling to D-SUB DB9 connector coupling that is included the delivery). A terminal program such as Windows HyperTerminal or PuTTY. Info Putty can be downloaded using the device's Service option and via the web interface (when connected). Method 1.Connect the RS232 port of your PC to the COM4 port of the device using the null modem cable. 2.Set your terminal program to 115200 baud transmission speed , 8 data bits , no parity and 1 stop bit (8N1), and No handshake. 3.Enter the user name root . 4.Enter ifconfig . 43 © 2010-2012 Delphin Technology AG LogMessage July 2012 The current IP address and subnet mask settings for the device are then shown in the se cond line of the output (underlined in red in the following example): To change the IP address or subnet mask, you must first set your PC address to an ad dress in the same segment and then connect the PC to the device via Ethernet. Refer to PC Connection. This section also explains how to amend the device's IP address. 5.2.2 Settings This section enables network and timezone settings. The NTP status is obtained by clicking NTP status above. 5.2.2.1 Network This window enables network data to be input or amended. Settings are made only after clicking Save . After changing the IP address or subnet mask the device is then accessible only via the new address. The PC's IP address (and possibly subnet mask) then also requires amending to establish a connection. LogMessage July 2012 44 © 2010-2012 Delphin Technology AG The hostname (network name for the device), domain and DNS server are used to convert network names into the corresponding IP address. Leave the DNS server field empty when a DNS server is unavailable on the network. Do not use invalid characters for network host and domain names (no underscores or special characters and only ASCII characters, i.e. no German umlauts, etc., but hyphens are allowed). Ask your network administrator whether your network requires MTU and gateway informati on. Otherwise, leave the 1500 default setting for MTU. A gateway address is required only if connections are to be established to other networks. For the NTP server field, enter the IP address of one or more available NTP time servers (NTP: Network Time Protocol) to enable correct time settings for the device. The NTP time server can be any other network device such as a PC or another LogMessage device. The integrated Windows time server SNTP (Simple Network Time Protocol) is however not re commended due to it having insufficient information on synchronization status. The device accepts (S)NTP times but only when the (S)NTP is synchronized to an internet time server or to DCF77 or GPS and is able to provide information on the quality of synchronization. If necessary, download an NTP time server from http://www.meinberg.de/german/sw/ ntp.htm . 45 © 2010-2012 Delphin Technology AG LogMessage July 2012 5.2.2.2 Clock settings Use this window to specify the timezone that the device is to use. Store the selection by clicking Save. When a time server is unavailable, the date and time can be manually set. The device's in ternal clock then functions without synchronization to a time server. Click Synchronize with NTP servers now to commence synchronization with the NTP time server specified under Network. LogMessage July 2012 46 © 2010-2012 Delphin Technology AG 5.2.2.3 NTP status This window displays detailed information about the NTP time server, e.g. about server-IP, signal delay and jitter (variations). The information is for users who are familiar with NTP protocols and who wish to identify errors in timestamp transfers or time server responses. Info NTP synchronization requires up to 5 minutes to adjust to the NTP time ser ver after the device has been switched on. The NTP status will be invalid during this period and will display the message "Synchronised to unspecified at stratum 13". The following is an example of the NTP-status (only the beginning is shown): 5.2.3 Configuration This section describes how to: Save or Load device settings, refer to Saving and loading configurations. View channels to display the current channel Settings . Reset all settings (except the network and settings) to the factory settings using Default configuration. Refer also to Resetting configurations. 47 © 2010-2012 Delphin Technology AG LogMessage July 2012 5.2.3.1 View channels This window shows in tabular form, configurations for all the channels from a device. Each column contains detailed information such as channel name, type of module, physical unit, measurement range, or whether an invalid channel configuration exists, etc. The object ID in the penultimate column enables users to display the channel configuration as an XML file (potentially important for support purposes). The data can only be displayed. Changing settings is not possible. To change configurati ons, use the DataService Configurator (Refer to LogMessage device configuration). 5.2.3.2 Saving and loading configurations Info The saving or loading of device configurations can only be done through the web interface. Save configuration Saves the current configuration to a (compressed) file. The file name is automatically gene rated from the host name, domain (refer to network settings ) and the date and time as at file creation. LogMessage July 2012 48 © 2010-2012 Delphin Technology AG Load configuration Loads a file that has been created with Save configuration and sets the device to the file's settings except for network, date and time settings. Enter the file to loaded in Configuration file or click on Search to find the file on your PC (file extension tar.gz). Then click Load configuration. Loading takes about 1 minute. A message is displayed during loading and when a restart has been completed: The process is complete when "Done" is the last message displayed. 5.2.3.3 Default configuration Resetting to factory setting cannot be undone. Therefore save the current configuration using Save (Refer to Saving and loading configurations). By clicking Default configuration all settings, except for the network, date and time settings, are reset to the factory settings. The process is displayed in a window. The process ends when Back is displayed in the window's footer. 49 © 2010-2012 Delphin Technology AG LogMessage July 2012 After resetting to factory settings, the I/O modules are disabled and requi red the reassigning of a module number (refer to I/O module ). Info Resetting the configuration to the factory setting can only be done through the web interface. 5.2.4 Service This section describes: Generation of a system report. The file is required only by Delphin's service and support in the event that the devi ce malfunctions. Downloading of bitmaps from a device. Bitmaps are used for the graphical representation of the device in the user's PROFIBUS configuration program. Downloading the PuTTY terminal program ( PuTTY ) button. 5.2.4.1 System report Provides a detailed overview of the system for fault diagnosis by Delphin Support. Send the file to the Support team. The system report can be generated only through the web in terface. After clicking System report, the device requires approximately 10 seconds to acquire all the information and record it to a ZIP file. The following dialog is then displayed to select the location of the saved file. The file name is made up of the current date and time and the network identifier of the device. LogMessage July 2012 50 © 2010-2012 Delphin Technology AG 5.2.5 System This section describes: Firmware updating using Update firmware (updating of the software within the device). Refer to Update firmware. Displaying of the changes to the current firmware compared to the previous version using Firmware changelog. The Adobe Acrobat Reader is required. The Acrobat Reader can be downloaded costfree from Adobe. Refer to Updating firmware. Restarting the device using Reboot . This has the effect of switching off and on. Refer to Rebooting the device. Restart main application only restarts the software for data acquisition and storage or transmission. Refer to Restart main application. This is faster than fully rebooting the device. 5.2.5.1 Update firmware Info A firmware update can be performed only via the web interface. A firmware update is provided with every software update. Perform both updates to ensure software and hardware are being used with their latest versions. Errors may otherwise oc cur in data acquisition or configuration. The device's current firmware version is also dis played in this window. The device's power supply must not be interrupted during firmware upda ting otherwise damage may occur to the equipment that will require repai ring. 51 © 2010-2012 Delphin Technology AG LogMessage July 2012 Enter the file with the new firmware in the New firmware file field on (click Search to find the file on your PC) and then click Start firmware update . The firmware upgrade takes 4 to 6 minutes. The device will reboot after the update (reboot). A message is displayed during loading and when a restart has been completed: The process finishes about one minute later. Then return to the home page ( Back ). LogMessage July 2012 52 © 2010-2012 Delphin Technology AG 5.2.5.2 Firmware changelog Click Firmware changelog to display a PDF file containing information on how the current firm ware differs to previous versions. The Adobe Acrobat Reader is required. The Acrobat Rea der can be downloaded cost-free from Adobe.. Example of a firmware changelog: 5.2.5.3 Restart main application Clicking Restart main application restarts the main program. This is faster than fully reboo ting the device. During the restart, data is neither acquired nor stored. The network connection to the <% PM%> device is interrupted and the re-established following the restart. 53 © 2010-2012 Delphin Technology AG LogMessage July 2012 Info A start can be performed only via the web interface. The process is displayed in a window. The process ends when the "Done" message is displayed. 5.2.5.4 Device restart (reboot) Restarts the device. The process takes approximately 2 minutes. Then click Back . The LEDs on the device indicate when the device is ready (refer to General LED). The action is equivalent to pressing the (countersunk) reset button on the front of the de vice or switching it off and then on again. LogMessage July 2012 54 © 2010-2012 Delphin Technology AG 5.3 Configuring a LogMessage device The Channels tab's top level DataService Configurator is the device level. The next level is the user-defined view (left panel) and displays the I/O modules, the interfaces, memory and the software channels. The hardware view (right panel), displays the various system interfaces, memory and software channels. The I/O modules are located in the "Ext. BUS" group. This section explains the settings that users can make themselves. This takes place via " LogMessage '192 .168.100.116'..." in the Channels tab in the DataService Configurator (see example). Use the Properties context menu to amend a device name and ID or to en ter a description for the device. Use Main settings context menu to amend network and NTP settings. Refer to Configuring main unit, Network settings, NTP. The explanations of other settings, refer to: Memory for internal memory Configuring module channels for I / O modules Configuring interfaces for CAN, COM and Configuring software channels for system monitoring and calculations Info For general information on configuration dialogs (including header and foo ter), refer to Settings for all dialogs. 55 © 2010-2012 Delphin Technology AG LogMessage July 2012 5.3.1 Device configuration (channel configuration) Open the configuration dialog either by double clicking the device or by selecting Properties from the context menu. This dialog enables users to: Enter information about the device's Location and its function ( Description ). For example, enter the location of the device or of the object from which data is being acquired. Amending Device ID . Device ID The DataService uses the device ID to uniquely identify a device and its channels. The fac tory setting for the device ID is its serial number. The device ID is displayed as the main part of the Device ID under the DataService's column of the same name. The column can be displayed via View Right panel Visible channel sheet columns. The device ID requires amending when copying the configuration from one device to ano ther and then running both devices together on the same DataService. Both devices would then have identical device IDs and the DataService would not be able to distinguish bet ween them. LogMessage July 2012 56 © 2010-2012 Delphin Technology AG Method 1.Save the required configuration using the web interface. Refer to Saving a configura tion. 2.Use the web interface to load the configuration to the new device. Refer to Loading a configuration. 3.Open the Device configuration dialog. 4.Enable User-defined device ID. 5.Enter a new ID (e.g. the device's " old " serial number). The device ID is in hexadecimal format. Valid input includes numbers from 0 to 9 and letters from 'a–f' or 'A–F' (no distinction is made between upper case and lower case letters). A zero may not be entered as the first character. A valid input changes the input field's background color to bright green. It remains red background as long as the input is invalid or incomplete. After amending the device ID, the connection to the device is briefly interrupted before being restored again. Refer also to Settings for all dialogs 57 © 2010-2012 Delphin Technology AG LogMessage July 2012 5.3.2 Network settings, NTP Open the Main settings dialogue via the device's context menu. After amending the IP address or subnet mask the device is then accessible only via the new address. The PC's IP address (and possibly subnet mask) then also requires amending to establish a connection. The Hostname (network name for the device), domain and DNS server are used to convert network names into the corresponding IP address. Leave the DNS server field empty when a DNS server is unavailable on the network. Do not use invalid characters for network host and domain names (no underscores or special characters and only ASCII characters, i.e. no German umlauts, etc., but hyphens are allowed). Ask your network administrator whether your network requires MTU and gateway informati on. Otherwise, leave the default setting of 1500 for MTU . A gateway address is required on ly if connections are to be established to other networks. LogMessage July 2012 58 © 2010-2012 Delphin Technology AG For the NTP server field, enter the IP address of one or more available NTP time servers (NTP: Network Time Protocol) to enable correct time settings for the device. The NTP time server can be any other network device such as a PC or another LogMessage device. The integrated Windows time server SNTP (Simple Network Time Protocol) is however not re commended due to it having insufficient information on synchronization status. The device accepts (S)NTP times but only when the (S)NTP is synchronized to an internet time server or to DCF77 or GPS and is able to provide information on the quality of synchronization. Download an NTP server from http://www.meinberg.de/german/sw/ntp.htm if necessary. As of Firmware Version R233 it is possible to connect GPS clocks (e.g. Holux GR-213). For that enter the "pseudo IP address" 127.127.20.3 in the NTP server field. Additionally deactivate the corresponding channel (Device -> Interfaces -> COM3 RS232). When the GPS receiver has locked on valid sattelite signal, after a while the NTP status will change to "synchronized to UHF radio at stratum 1". Example of absent or incorrect time synchronization DataService Configurator: Info NTP synchronization requires up to 5 minutes to adjust to the NTP time ser ver after the device has been switched on. The NTP status will be invalid du ring this period and will display the message "Synchronised to unspecified at stratum 13". 59 © 2010-2012 Delphin Technology AG LogMessage July 2012 5.4 Storage Group Setting subgroups within the "Memory" enables a more efficient partitioning of the memory. From the context menu select Create channel Memory groups. Divide the available memory among these groups and use the Channel list tab to set how often the groups channels are to be saved. Refer also to Settings for all dialogs , Data transfer to USB memory stick. Memory group settings, Main settings tab Use this tab to set the Size (amount) of memory that this group may use. The memory either can written to until full (End storage process when memory full) or the group can be configured as a Ring buffer. As a ring buffer, the current value overwrites the oldest value when the memory is full. An alternative to the ring buffer is the Erase trigger function. Enter a (digital) channel as the trigger for the deletion. A calculation channel can be used that monitors memory capacity and then deletes the memory when a specified capacity has been reached. Store time change : When enabled, time changes, such as synchronizing using NTP time, triggers extra saving to the memory group from the channels in the channel list. This identifies from the data the cause of the "time mismatch". Store config change: When enabled, saves changes to channel configurations in this me mory group along with the time of change, version number and configuration file history in the device (.. / pm / config / channels / backup / directory). LogMessage July 2012 60 © 2010-2012 Delphin Technology AG Memory group settings, Storage mode tab The following options are available: Save initial values: When enabled, the current values from all channels in the chan nel list are saved when the memory group starts. The storage group starts by activation in this dialogue or following the switching on / rebooting of the device and active storage group. Cycle store values: When enabled, saving takes place at the given interval irre spective of any trigger or tolerance settings. Continuous: The current value is saved when a tolerance is exceeded depending on the tolerance settings for the channel in the channel list. Single step : Functions as for the edge trigger but without pre-or post-trigger ti mes. Edge trigger: Saving takes places with a change (edge) in a (digital) signal. Level trigger: Measurement data is saved as long as the given level remains active. For Edge trigger and Level trigger options, an additional pre-trigger and post-trigger ti me can be given for saving to also take place. Data is then stored within these times when a value exceeds the tolerance settings for the respective channel. 61 © 2010-2012 Delphin Technology AG LogMessage July 2012 Memory group settings, Channellist tab Select the channels from which data is to be stored: Mark channel and click How often measurement data is saved depends on a the different settings (refer also to the Storage mode tab) and may also be influenced by the Tolerance for newly added chan nels: Online: The tolerances given in the Advanced settings tab under Data reduction will also be used for saving. The measurement data is saved when it deviates from the previously saved data by more than the value given here. The valid value for the channel is displayed - after acquisition - in the field Stored channels . Defaultvalue: The value specified here is used for the channel that is to be assi gned to the group. The tolerance is valid only for saving to this memory group. For everything else, such as a calculation using this channel, the valid tolerance is the one assigned to this channel. The valid value for the channel is displayed after acquisition - in the field Stored channels . If Relative tolerance is enabled, data is not displayed according to the channel's unit but as a percentage based on Conversion in the Main settings tab. LogMessage July 2012 62 © 2010-2012 Delphin Technology AG Info Make the Tolerance for channels being saved settings before clicking . A subsequent change to the settings will be ineffective. For the change to be effective, the channel first needs to be deleted and then reinstated. Settings for USB export Activate this option to export data from a memory group to a USB memory stick: allo wed. Refer also to Data transfer to USB memory stick. 63 © 2010-2012 Delphin Technology AG LogMessage July 2012 5.5 Data transfer to USB memory stick Acquired data can be copied to a USB memory stick without the device having to be connected to a PC. There are two options for the transfer of data: 1.Data transfer without configuration 2.Data transfer with transfer type configuration The prerequisite for both options is the capability of transferring data to a USB memory stick. Refer to device memory. Info Use a FAT32-formatted USB flash drive with an LED that blinks during the data transfer. Data transfer without configuration 1.Plug in the USB memory stick. 2.After detection of the USB memory stick, data is transferred to the USB stick from the enabled storage groups. The transfer is complete when the USB stick's LED stops blinking. The data is copied and not deleted from the device! 3.Remove the USB memory stick. Configuring data transfer 1.Insert the USB memory stick into a PC running the DataService Configurator. 2.Open the configuration dialog from the "memory" group's Save USB export Configura tion option. LogMessage July 2012 64 © 2010-2012 Delphin Technology AG 3.Select the required (memory) mode: 'One-off: Data is saved for the specified period. Incrementally : Data is saved that has been acquired since the last save. Saving takes place after removal and reinsertion of the USB memory stick. 4.Enter the USB memory stick's drive (in the dialog's lower left corner). 5.Click Save: The configuration file is saved in XML format to the USB memory stick. 6.Remove the USB memory stick. When the USB stick is inserted into the device the configuration file is read and the corre sponding data transferred to the USB memory. The data is only copied and not deleted from the device! Saving ends when either: All data from the selected memory group(s) for the set time periods has been saved or The date has been saved with a time-stamp for the current time. The transfer is complete when the USB stick's LED stops blinking. A new saving process begins only by the removal and reinsertion of the stick. 65 © 2010-2012 Delphin Technology AG LogMessage July 2012 5.6 Configuring I/O module channels I/O module channels refer to the channels of the of the I/O modules. The configuration for software channels , interfaces and device memory is described in separate sections. Refer also to the overview , galvanic isolation, specifications. 5.6.1 Settings for all dialogs A configuration dialog opens after double-clicking one of the channels, e.g. from an I/O mo dule, an interface or an interface protocol. Different tabs are displayed depending on the channel type. The data in the tabs also depends on the channel type. Many settings are similar, especially in the upper and lower sections, and can therefore be explained generally for any type of channel. LogMessage July 2012 66 © 2010-2012 Delphin Technology AG Upper section Active: Enables or disables the channel. Channel name: Enter a meaningful and unique name to identify the channel. Unit: Enter the unit of measurement. Info The unit for memory groups should be left at % (default). Storage ca pacity is always shown as a percentage. Location: Information on the location of the sensor or signal source can be entered he re. Description: For entering a description or comment. After creating a function (software channel), a description of the function (in English) appears here. Lower section Previous or Next : Changes to the configuration dialog of the previous or next channel in the channel view. The dialog's current settings are applied before the dialog changes (the equivalent of clicking on OK ). OK: Applies all the settings and closes the dialog. Cancel: Cancels the configuration and closes the dialog. The settings are ignored and no changes are made within the device. Help : Opens the online help. The appropriate topic is displayed whenever possible. The date and time display of the last setting change for the channel is displayed in the lower left corner (08/25/2011 in the example). 67 © 2010-2012 Delphin Technology AG LogMessage July 2012 Tabs in the dialog's main section Depending on the type of channel, different tabs are available. Not every channel type has the following tabs: Main settings Advanced settings Additional settings Measuring time Sensor correction The settings in the Main settings and Additional settings tabs differ according to channel type and are therefore not described here. There are also other tabs that relate to specific channels and are therefore described under these channels. The other tabs have share common settings and can be explained here. Advanced settings tab Default value: This is used in the event of a input or output failure (refer also to status monitor ). The settings depend on channel type. For example, digital inputs have only the options Off and On. Force default value (simulation) : Sets the channel's output value. This setting is is useful during installation to simulate certain conditions or activate system responses. Do not forget to disable the option for normal operation! Data reduction (Not available for all channel types): A signal is fed in at the channel in put, processed within the channel and then released to the channel output. The tole rance specifies the extent of change a signal value must undergo following processing before being output. In the example the processed input value is output only when it differs by more than 0.1 mA to the preceding value. The Data reduction function pre vents the device from having to process/store superfluous data. The tolerance value can be expressed as an absolute measurement unit or as a relative value. Refer also to the Scaling section of the Main settings tab. LogMessage July 2012 68 © 2010-2012 Delphin Technology AG Format: For setting data resolution. Persistence (not available for all channel types): The current valid output value (refer to data reduction) is stored to a non-volatile memory. The channel uses this value fol lowing a restart or reboot. This feature is particularly important for outputs to establish a predefined state following a power failure. Measurement time settings tab To set an A/D measurement cycle for analog input channels, i.e. the frequency to be used for converting an analog signal into a digital value. The smaller the frequency the more values are acquired. A short measurement cycle may however raise the signal's noise level. Input of (50Hz) or (60Hz) achieves improved network frequency suppression via measure ment cycle and via the A/D conversion's special filters. Sensor correction tab To specify correction values for sensors with non-linear characteristics or to specify the correct direction for sensors with different characteristic values for positive and negative measurement directions. Conversion takes place according to scaling settings in the Main settings tab for the signal delivered by the sensor. Active: Enables sensor correction. Mode There is a choice of modes: Offset An offset shifts the curve by a fixed value, i.e. the given value is added to the measurement value. Offset and gradient Allows a shifting of the curve and an increase in its gradient. The example above picture shows the values for a temperature measurement with calibration at 0 ° C and 100 ° C. Square Generates a quadratic curve through the given points to linearize the measured values. 69 © 2010-2012 Delphin Technology AG LogMessage July 2012 Linear interpolation Enter a table for the conversion of measured values into display values. Linear interpolation takes place between the given points. Spline interpolation An optimal fitting polynomial 3rd degree (cubic spline) is determined using spline interpolation for the given values which is then used to to convert the measured values. Info You can use copy and paste to transfer data from an Excel table into the dialog's table. Position the cursor in the table's top left field. Extra rows are created automatically when this is permitted by the selected mode. Click on a row and use the Del key to delete unwanted rows. Insert ex tra rows in a linear interpolation using the Return key . A created table can be exported and then re-imported later: Export and Import . 5.6.2 Tables Set point tables can be created in the device for software and channel linearization tables. The tables can have two different applications: Global application for multiple channels (external table) Global tables can be used for multi-channel data not assigned to a specific channel. They are valid only after Global settings have been made for Table type in the Main set tings tab for this channel's software channel setpoints or linearization. A global linearization table is created using the Global linearization table context menu of the device. Local The validity of a local setpoint or linearization table is limited to the channel in which it is configured. From the Main settings tab select the Local for the software channel setpoint or linea rization Table type . Create the table in the Table tab that then appears. LogMessage July 2012 70 © 2010-2012 Delphin Technology AG 5.6.2.1 Global linearisation tables An external linearization table that can be used as a global table for multiple channels is created via the Global linearisation tables context menu of device. Refer also to Lineariza tion. Linearization table created using the device's context menu. Method 1.Click New to create a table. 2.Change the Table name if required. 3.Select the required mode. 4.Enter the point values. The number of values to be entered will depend on the type of linearization required (Mode ). 5.Click Save. A table can be imported as well as created: Import. 71 © 2010-2012 Delphin Technology AG LogMessage July 2012 Mode There is a choice of modes Offset An offset shifts the curve by a fixed value, i.e. the given value is added to the mea surement value. Offset and Gradient Allows a shifting of the curve and an increase in its gradient. The example above shows the values for a temperature measurement with calibration at 0 ° C and 100 ° C. Squarely Generates a quadratic curve through the given points to linearize the measured va lues. Linear interpolation Enter a table for the conversion of measured values into display values. Linear inter polation takes place between the given points. Spline interpolation An optimal fitting polynomial 3rd degree (cubic spline) is determined using spline in terpolation for the given values. This is then used to to convert the measured va lues. Info You can use copy and paste to transfer data from an Excel table into the dialog's table. Position the cursor in the table's top left field. Extra rows are created automatically when this is permitted by the selected mode. Click on a row and use the Del key to delete unwanted rows. Insert extra rows in a linear interpolation using the Return key . A created table can be exported and then re-imported later: Export and Im port . LogMessage July 2012 72 © 2010-2012 Delphin Technology AG 5.6.2.2 Global setpoint tables An external setpoint table that can be used as a global table for multiple channels is crea ted via the Global setpoint table context menu of device. The setpoint table creates a conditional procedure whose points are set by value pairs ma de up from a period and a value. Each row of the table describes a program step for time t (fixed or variable) and value y (fixed or variable). Based on the previous value of yi-1 , the ti value indicates how long will it take to achieve the yi value. The first row defines the starting point of the track, so at least two pairs of values require entering. One variable is defined via the setpoint channel that uses the table. Setpoint table created using the device's context menu. 73 © 2010-2012 Delphin Technology AG LogMessage July 2012 Method 1.Click New to create a table. 2.Change the Table name if required. 3.For each table row (program step) enter the time value ( Time ) with the unit of time and to be used and the value to be output. 4.Click Add. 5.Enter the required Global Settings . 6.Click Save. A table can be imported as well as created: Import. Numbers (constants) or variables can be used for times and values. The variables used in the tables are defined under setpoint channel (software channels). For time input, the va riable may be used as a value or as a trigger: Variable (value) means that the value of the variable is used as time value. Variable (trigger) means that the channel set for the variable is used as a trigger channel. A trigger event is a rising edge. If this trigger occurs, the value that is programmed into the program step for the trigger is applied as a setpoint and the next program step is then performed. This me thod enables the upgrade of a basic time-controlled program to an event controlled sys tem. Global settings Relative time : When enabled, input times are calculated as a difference to previous time points. When disabled, time values are taken from the start (first value). Example of absolute and relative time input The numerical values are fixed values and in this case refer to identical time points. The final time is 7 (the unit is not stated but might, for example, be minutes). Point no. Absolute Relative 1 0 0 2 1 1 3 5 4 4 7 2 LogMessage July 2012 74 © 2010-2012 Delphin Technology AG Example of a table In the table in the example, the value 22.5 is held for the first 15 minutes. Then, after each 6 minutes (Relative time setting ) the value increases to 35, then lowers to 10 via 22.5, and then increases again to 22.5. A change and therefore output of the new va lue takes place every 10 seconds. The change over the previous value is therefore around 0.35 for every 10 seconds. Cycle time : The cycle time for values to be output between two program steps. Intermedia te values are linearly interpolated, i.e. calculated using a linear equation. The intervals used in the table between each program step should be multiples of the cycle time. 75 © 2010-2012 Delphin Technology AG LogMessage July 2012 5.6.3 I/O module This section describes configurations at the I/O module level and how to delete a module entry. An I / O module appears in the Channels tab as a symbol. The I / O modules are available in the hardware view below the "Ext BUS DCP " entry. The user-defined view lists all the I/O modules directly below the device - as long as the user has not already mo ved the modules or channels. Double-click an I/O module or select Properties from the context menu to display the confi guration dialog. Use the dialog to change the module name or set the module number (bus address) in the Main settings tab. Main settings tab Module information This area shows the module's type, version and unique CAN-ID. LogMessage July 2012 76 © 2010-2012 Delphin Technology AG Module number After loading the factory settings the modules have no number. The number is important because a module can be active only when it has been assigned a unique number. Modules are displayed in numerical order in the channel view. Give each connected module a unique number between 1 and 99. Numbers that have alrea dy been allocated are marked with the symbol. When a number has been allocated, the module symbol is displayed next to the number. Module settings (for I/O modules DIOT and ADFT only) These modules have the option to use the counter inputs either as pulse counters or fre quency measurements. For frequency measurements, set the period over which incoming pulses are totalled to enable the frequency to be determined. Low frequencies require a correspondingly longer time to acquire multiple vibrations, but measurement is then slow for long time periods. For short times measurement is dynamic but less vibrations are detected and measurement data fluctuates strongly. Make sure the gate time is small enough at hig her frequencies because the maximum number of impulses is 65535. Deleting module entries Modules can also be displayed that are currently inactive but had been previously connec ted or configured. As long as they have not been deleted they are appear with the sym bols or before the module symbol. The configuration is retained and reloaded as soon as the module is reconnected. Deleting a module entry permanently deletes the entire module configurati on including all hardware channels. Therefore, prior to deleting, back up the current configuration via the web interface. Refer to save/ load confi guration. 77 © 2010-2012 Delphin Technology AG LogMessage July 2012 Delete the entire module entry when the module configuration is no longer required. Click Delete channel along with subchannels / links from the module's context menu. 5.6.4 I/O module AMDT The AMDT I/O module on vibration measurement is dealt with in a separate chapter. Refer to E/A-Modul AMDT. Channel configuration/settings are described here: I/O module AMDT, Configuration and operation. LogMessage July 2012 78 © 2010-2012 Delphin Technology AG 5.6.5 Analog input Configuration options in the Main settings tab depend on the sensor type: Voltage, e.g. 0 … 10 V Resistor Current, e.g. 4 … 20 mA Resistance thermometer, e.g. Pt 100 Thermocouple, e.g. type K NiCr-NiAl pH probe The Additional settings tab is identical for all analog input sensors but not every setting is ac cessible from every type of sensor. Monitoring Measuring range monitoring: When data is not in the Measuring range specified in the Main settings tab, the channel status is set to "measurement range overrun/underrun". The status otherwise displays "OK". The output value of the channel is set to the maximum or minimum value of the Scaling value (in the Main settings tab). Channel status values are available in the status monitoring table. Wire break monitoring : The option is useful for monitoring sensor failure in, for example, ther mocouples or sensors with 4 ... 20 mA output. In the event of a failure, channel status is set to "wire-break". Channel status values are available in the status monitoring table. Cycle times Calibration every 2^ x cycles : Offset errors require correcting from ambient temperature fluc tuations in long term measurement procedures This setting determines how often this hap pens. A cycle is made up of the measurement of all active channels in the module (refer to Overall module measuretime in the Measuring time tab). The default is every 1024 cycles (210 ). For an A/D measurement time of 100 ms for 8 active channels, any offset errors are then corrected approximately every 14 minutes. Measurement every x cycles: To specify that a measurement from a channel is acquired at, for example, every 10th cycle. A cycle is made up of the measurement of all active channels in the module (refer to Module's overall measurement time in the Measurement cycle settings tab). 79 © 2010-2012 Delphin Technology AG LogMessage July 2012 Compensation The setting is available for thermocouple sensor types and pH probes. Enter the Channel that is to be used for the thermocouple's cold junction measurement (junction between thermocouple and copper wire/connector) or the temperature compensation for the pH pro be. The default Reference Junction uses the measurement from the Pt100 temperature sensor at the I/O module's terminal and is practical only for the thermocouple sensor type. A diffe rent channel may also be used. When the temperature at the thermocouple to copper wire junction remains constant, this temperature can be entered as a Manual value. Inherite status means that the compensation status is applied also to the current measu ring point. Info Refer also to Examples of connections for information on the connection of sensors and Measurement technology for background information on measu rement technology in practice . 5.6.5.1 Voltage sensor type The example means: 0 mV corresponds to 0 bar, 5 V corresponds to 10 bar. Mode unipolar : Measuring positive signals only. bipolar : Measuring positive and / or negative signals. LogMessage July 2012 80 © 2010-2012 Delphin Technology AG Measuring range Select a measuring range that is equal to or greater than the signal from the sensor or si gnal source to prevent A / D converter overload. The channel receives the status "measu rement range overrun/underrun" for measurements not within the range. Channel status va lues are available in the status monitoring table. Scaling Enter two points from the sensor's characteristic curve, if possible, the lower and upper vertexes. For a linear characteristic, measurement values are then converted into the unit of measurement (scaling) from the sensor. For non-linear characteristics use Sensor cor rection. The specified range (in the example 0 to 10 bar) is used as the default for the dis play area for graphics in ProfiSignal. The channel receives the status "scale range overrun" or "scale range underrun" when not within the range. Channel status values are available in the status monitoring table. 5.6.5.2 Resistor sensor type The example means: 0 degrees corresponds to 0 ohms, 4000 ohms corresponds to 270 de grees . Measuring range Select a measuring range that is equal to or greater than the resistance from the sensor to prevent A/D converter overload. The channel receives the status "measurement range overrun/underrun" for measurements not within the range. Channel status values are available in the status monitoring table. 81 © 2010-2012 Delphin Technology AG LogMessage July 2012 Scaling Enter two points from the sensor's characteristic curve, if possible, the lower and upper vertexes. For a linear characteristic, measured values are then converted into the unit of measurement (scaling) from the sensor. For non-linear characteristics use Sensor correcti on. The specified range (in the example 0 to 270 bar) is used as the default for the display area for graphics in ProfiSignal. The channel receives the status "scale range overrun" or "scale range underrun" when not within the range. Channel status values are available in the status monitoring table. Connection Indicate here how the sensor has been connected (the diagram displays the selected wi ring): 2 Wire : The sensor is connected with only two wires. This is recommended only for very short lines and high impedance sensors otherwise the resulting voltage drop on the line feeds can lead to measurement errors. 3 Wire : The sensor is connected with three wires. Since loss occurs only on one line, a measurement error is only half as large as in two-wire connections. 4 Wire : The recommended connection method for low impedance sensors and / or longer supply lines. The loss of feed lines does not matter because the device has a high-ohm in put resistance (no voltage drop on the line feed) and the voltage drop (the unit of measu rement) can be measured directly at the sensor. LogMessage July 2012 82 © 2010-2012 Delphin Technology AG 5.6.5.3 Current sensor type Mode unipolar : Measuring positive currents only. bipolar : Measuring positive and / or negative currents. Measuring range Select a measuring range that is equal to or greater than the current at the load resistor to prevent A/D converter overload. The channel receives the status "measurement range overrun/underrun" for measurements not within the range. Channel status values are available in the status monitoring table. Current measurement is not possible without a load resistance. Scaling Enter the lower and upper vertexes of the sensor's characteristic curve. For non-linear cha racteristics use Sensor correction. The specified range (in the example -2000 mA to 2000 mA) is used as the default for the display area for graphics in ProfiSignal. The channel receives the status "scale range overrun" or "scale range underrun" when not within the range. Channel status values are available in the status monitoring table. 83 © 2010-2012 Delphin Technology AG LogMessage July 2012 5.6.5.4 Current sensor type (0/4...20 mA) The example means: 0 mA corresponds to 0 l / h (liters per hour), 20 mA corresponds to 1000 l / h. Mode This setting is available only for sensor type 0 ... 20 mA available. For sensor type 4 ... 20 mA the measuring range is always unipolar. unipolar : Measuring positive signals only. bipolar : Measuring positive and / or negative signals. Shunt Enter the load resistance being used. Delphin offers various load resistances for measuring currents. Contact us to obtain a suitable resistance. Current measurement is not possible without a load resistance. LogMessage July 2012 84 © 2010-2012 Delphin Technology AG Scaling Enter two points from the sensor's characteristic curve, if possible, the lower and upper vertexes. For a linear characteristic, measured values are then converted into the unit of measurement (scaling) from the sensor. For non-linear characteristics use Sensor correcti on. The specified range (in the example 0 l/h to 1000 l/h) is used as the default for the dis play area for graphics in ProfiSignal. The channel receives the status "scale range overrun" or "scale range underrun" when not within the range. Channel status values are available in the status monitoring table. 5.6.5.5 Resistance thermometer sensor type The example shows the settings for a Pt100 sensor. The sensors or settings for Nixxx sen sors or PT1000 etc. are however similar. Pt xxx or Ni xxx or YSI400 Select the the type of resistance thermometer being used: Pt100 , Pt1000 or Ni500 etc. The numerical values for the platinum and nickel thermometers correspond to their resistance at 0°C. YSI400 is a special NTC resistor mainly used in the medical field (temperature range -80 to 250 ° C, resistance of 1660 ... 6400 Measuring range Select the measurement range being used. Depending on the version of the sensor only a limited range may be permissible. Refer to the sensor's technical data. The default is always the sensor's maximum possible measuring range. The channel receives the status "measure ment range overrun/underrun" for measurements not within the range. Channel status va lues are available in the status monitoring table. 85 © 2010-2012 Delphin Technology AG LogMessage July 2012 Temp. Format Select the unit of measurement in which the temperature is to be displayed. Conversion is performed automatically within the device. ° C : Degrees Celsius K: Kelvin °F: Degrees Fahrenheit R: Rankine °R: Degrees Réaumur Scaling Enter the range for valid sensor signals. The specified range (in the example -260 °C to +850 °C) is used as the default for the display area for graphics in ProfiSignal. The channel receives the status "scale range overrun" or "scale range underrun" when not wi thin the range. Channel status values are available in the status monitoring table. Connection Indicate here how the sensor has been connected (the diagram displays the selected wi ring): 2 Wire : The sensor is connected with only two wires. This is recommended only for very short lines and high impedance sensors otherwise the resulting voltage drop across the cir cuits can lead to measurement errors. 3 Wire : The sensor is connected with three wires. Since loss occurs only on one line, the measurement error is only half as large as in two-wire connections. 4 Wire : The recommended connection method for low impedance sensors and / or longer supply lines. The loss of feed lines does not matter because the device has a high-ohm in put resistance (no voltage drop on the line feed) and the voltage drop (the unit of measu rement) can be measured directly at the sensor. Info No choice of wiring is available for YSI400 sensors. LogMessage July 2012 86 © 2010-2012 Delphin Technology AG 5.6.5.6 Thermocouple sensor type The example shows the settings for a thermocouple type K (NiCr-NiAl, nickel-chrome and nickel-aluminum alloy). Sensor type select your type of thermocouple. The letter type and material type of the thermocouple wires are given. Measuring range The maximum possible sensor measuring range is pre-selected. The channel receives the status "measurement range overrun/underrun" for measurements not within the range. Channel status values are available in the status monitoring table. Temp. Format Select the unit of measurement in which the temperature is to be displayed. Conversion is performed automatically within the device. ° C : Degrees Celsius K: Kelvin °F: Degrees Fahrenheit R: Rankine °R: Degrees Réaumur 87 © 2010-2012 Delphin Technology AG LogMessage July 2012 Scaling Enter the range for valid sensor signals. The specified range (in the example -270 °C to +1372 °C) is used as the default for the display area for graphics in ProfiSignal. The channel receives the status "scale range overrun" or "scale range underrun" when not wi thin the range. Channel status values are available in the status monitoring table. Info Enter the compensation to be used in the Extended settings tab (refer to Set tings for all dialogs). 5.6.5.7 Ph-probe sensor type This sensor type determines the pH value from the voltage of the pH probe in mV and the temperature in ° C of the reference junction via the Nernst factor. Nernst factor = ln 10 * molar gas constant * absolute temperature / Faraday constant with molar gas constant = 8.314472 in J/(mol*K), absolute temperature = temperature of the reference junction + 273.15 in K, Faraday constant = 96.4851534 in J/(mV*mol) Sensor type Select pH . LogMessage July 2012 88 © 2010-2012 Delphin Technology AG Measuring range A range of ± 625 mV is sufficient for this type of sensor. Temp. compensation Temperature compensation is determined by measuring the temperature at the measure ment point in the solution to be determined. Activate compensation and configure the channel using the Additional settings dialog (refer to Settings for all dialogs). Scaling The default scaling uses the standard measurement methods and should not be altered. 5.6.6 Digital input with counter/frequency measurement Use the Main settings (for DIOT and ADFT modules) or Speed measurement(AMDT module) tabs to select whether the digital inputs are to be used for counting (Pulse count) or Frequency measurement. Pulse counting occurs according to a signal's falling edge. For frequency mea surement, pulses are counted that occur within the gate time. The result is then converted into a frequency (refer also to the module tab in the Module settings area of the Main settings tab. Pulse counting or frequency measurement settings apply to all digital in puts of an I/O module. 89 © 2010-2012 Delphin Technology AG LogMessage July 2012 This example means: 0 pulses correspond to 0 degrees, 7200 pulses correspond to 3600 degrees (10 rotations). This example means: 0 pulses correspond to 0 kHz, 5000 pulses correspond (with a gate ti me of 100 ms) to 50 kHz. Scaling Enter two points from the sensor's characteristic curve, if possible, the lower and upper vertexes. For a linear characteristic, measured values are then converted into the unit of measurement (scaling) from the sensor. For non-linear characteristics use Sensor correcti on. The specified range(0 to 3600 degrees in the upper example, i.e. 10 rotations; in the lower example 0 to 50 kHz ) is the default for displaying graphics in ProfiSignal. The channel receives the status "scale range overrun" or "scale range underrun" when not within the range. Channel status values are available in the status monitoring table. LogMessage July 2012 90 © 2010-2012 Delphin Technology AG 5.6.7 Digital input Invert : This option inverts a "High" level at the input to a "Low" level at the output (measu rement signal in device) and vice versa. 91 © 2010-2012 Delphin Technology AG LogMessage July 2012 5.6.8 Analog output Depending on the module, either currents or voltages can be output. The Output range in the configuration dialog indicates whether currents can be output in the range 0 ... 20 mA or 4 ... 20 mA or voltages in the range 0 ... 10 V or ± 10 V. The example means: 0 bar corresponds to 4 mA, 0.5 bar corresponds to 20 mA. The example means: 0 bar corresponds to 0 V, 0.5 bar corresponds to 10 V. LogMessage July 2012 92 © 2010-2012 Delphin Technology AG Source Enter either a constant value ( Manual value ) or use Channel to select an existing channel whose value is then output. Selecting Application enables the output value to be manually set via the DataService Configurator or automatically set via a ProfiSignal application. Scaling Enter two points from the sensor's characteristic curve, if possible, the lower and upper vertexes. Values from the source are then linearly converted into the output range. For non-linear characteristics use Sensor correction. The specified range (in the example 0 to 0.5 bar) is used as the default for the display area for graphics in ProfiSignal. The channel receives the status "scale range overrun" or "scale range underrun" when not within the range. Channel status values are available in the status monitoring table. The Output range defines the limits of the current or voltage output. 5.6.9 Digital output The digital output corresponds to a switch that is either ON (the two output terminals are connected, the input is "High" ) or OFF (no current flow between the two output terminals, the input is "Low" ). An external voltage source may be necessary (see wiring diagram in the dialog). Be aware of the maximum permitted currents and voltages for the digital out put, (refer to the Technical specifications). Source Enter either a constant value (Manual value) or use Channel to select an existing channel whose value is then output. Selecting Application enables the output value to be manually set via the DataService Configuratoror automatically set via a ProfiSignal application. Invert: This option inverts the "High" level for the channel in the OFF state (No current flow between the two output terminals) at the output and vice versa. 93 © 2010-2012 Delphin Technology AG LogMessage July 2012 5.7 Configuring interfaces A device is equipped with multiple interfaces to enable communication with external devi ces. These interfaces enable connection to other PCs, PLCs, or other third party equipment for data import or export. The Ethernet and USB interface require no configuration and therefore have no configurati on dialog. Configuration of the CAN-bus and COM interfaces as well as for I/O modules ta kes place directly from the channel view of the DataService Configurator and is described in this section. The device has one CAN bus and four COM ports which are available as two D-SUB DB9 socket-connectors, and one D-SUB DB9 plug-connector (refer also to display devices and connections. Using the left D-SUB connector as a COM1 and CAN connection is possible via a special connector available from Delphin. COM1 is a RS485 port and can operate in UART mode. COM2 has the same properties as COM1. COM3 is a limited (3-wire) RS232 port in UART mode. COM4 is a full RS232 port in UART mode. Info The DataService Configurator displays a hardware error following the acti vation of the COM4 port because COM4 is set internally as an interface for support / service purposes and therefore initially unavailable for use. If COM4 is required as an additional port, contact Delphin's support team. Configuring the CAN bus CAN-Controller CAN-Driver CAN-Bus-Channel Refer also to settings for all dialogs 5.7.1 CAN-Controller Follow these steps to run a device via the CAN interface: 1.Configuring the basic settings of the CAN-Controller (this section) 2.Creating a CAN-Driver: CAN-Driver 3.Create one (or more) CAN-Bus-Channels The CAN interface is displayed in the Channels tab with the CAN-symbol . The CAN in terfaces are available in the Hardware defined view under the interface entry. The User de fined view lists all CAN interfaces directly below the device - as long as the user has not al ready moved the modules or channels. LogMessage July 2012 94 © 2010-2012 Delphin Technology AG Double-click a CAN entry or select Properties from the context menu to display the configu ration dialog. Set the baud rate and the length of the identifier in the Main settings tab. We recommend a unique Channelname. If required, amend Description and enter a Location. Main settings tab Baudrate The baud rate states the number of characters transferred per second via the interface. Selection depends on the properties of the connected devices and the cable length bet ween the devices: For longer lines a lower baud rate should be selected to achieve error-free communi cation. The following are guidelines for CAN interfaces: from 15 m: 1000 kBaud (factory device) up to 30 m: 500 kBaud up to 45 m: 333.3 kBaud up to 60 m: 250 kBaud up to 150 m: 100 kBaud The baud rate must be the same for transmission and reception. Therefore, first determine the baud rate for the equipment to be communicated to and use this value to set the CAN interface's baud rate. In brackets are noted the procotols, which implement that baud rate (CiA = CAN in Auto mation, DCP = Delphin CAN Protocol) Extended ID A CAN system identifies data not by device addresses but by identifiers within a message. The CAN specification defines identifiers at either 11 or 29 bits in length. The setting deter mines which identifier length is being used. When enabled this interface can be used with either an 11-bit or 29-bit (CAN 2.0B) identi fier. When not enabled, data transmission on the CAN bus is limited to an 11-bit identifier (CAN 2.0A) and no other amendments can be made via CAN-Bus-Channels. Refer to Pin assignment of COM interfaces 95 © 2010-2012 Delphin Technology AG LogMessage July 2012 5.7.1.1 CAN-Driver Create a CAN-Driver via the CAN-Controller context menu: Create channel The symbol CAN-Driver (RAW). is then displayed for the CAN driver. Double-click the CAN driver or select Properties from the context menu to display the confi guration dialog. Use the dialog to enter a name, location and description for the CAN-Dri ver. 5.7.1.2 CAN -Bus-Channel A CAN-Bus-Channel is displayed with the symbol . CAN-Bus-Channels are available on ly when a CAN interface and CAN-Driver have been configured. To create additional chan nels, select Create channel Protocol RAW). CAN-Bus-Channel from the CAN-Driver context menu ( , CAN Double-click a CAN-Bus-Channel entry or select Properties from the context menu to display the configuration dialog. The data to be entered depends on the type signal that is to be sent to or received from the CAN-Bus-User. Therefore, obtain information on the format and settings of the signal before entering data here. LogMessage July 2012 96 © 2010-2012 Delphin Technology AG Main settings tab Data type settings Data type Specifies the data type for interpreting the payload data. Bit length, Byte order and Word order are set and adjusted depending on the data type input. Startposition within reference data , Scaling and Use channel as output are also set accor ding to data type. Signed Sets whether the integer data type is to be interpreted as signed or unsigned. An 8-bit value would then be in the range -128 to 127 (2's complement) or 0 to 255. Floating values are always interpreted as signed. Bit-values make no dis tinction between signed and unsigned. Bit length Sets the bit lengths for integer and floating data types. Byte order and Word order are adjusted according to length value. This also applies to the numeric fields in Startposition within reference data. 97 © 2010-2012 Delphin Technology AG LogMessage July 2012 Encoding type Specifies the encoding type for interpreting the transmitted/received data. Byte order The byte order (byte sequence) is a number, made up of several bytes, how by tes are ordered to the address. BigEndian, also known as Motorola-format, orders the most significant byte to the lowest address. LittleEndian, also known as In tel-format, orders the least significant byte to the lowest address. Refer also to http://de.wikipedia.org/wiki/Byte-Reihenfolge. Word order Like the byte order, word order orders Word data (1 word = 2 bytes = 16 bits) to addresses. In addition to determining byte order, a different word ordering may be necessary. Byte pattern To display the different byte and word order combinations, a hex value (a ran dom number in the example) is shown with the resulting byte pattern of a CAN message. Startposition within reference data Byte offset The length of the payload data, i.e. the size of the data field (DATA) of a CAN message, is limited to a maximum of 8 bytes. This allows multiple signals to be transmitted within a CAN message as long as not all the 8 bytes per signal are being used (this would only be the case with a binary-coded 64-bit floating va lue). Enter the starting byte for this signal's payload data. In the example the va lue of 4 means that, for example, two signals each with 2 bytes (binary-coded 16-bit integer value) would fit before the current signal and one signal behind it. The maximum possible value of the offset is derived from the bit length of the data type and is displayed to the right of the numeric field. Input is restricted to the valid values, and the default is 0 Bit offset This field is available only for the bit data type and binary encoding. The payload bit in this data type can be between the 0 and seventh bytes. The byte offset is also available for this data type. Input is restricted to the valid values, and the default is 0 CAN ID Extended ID To set whether the CAN message uses 11 bit or 29 bit for the identifier. The set ting in this dialog is available only when Extended ID has been selected in the CAN controller dialog. ID Enter a hexadecimal value for an ID either with 11 bit (hex value of between 1 and 7FF) or 29 bit (between 1 and 1FFFFFFF). Input is restricted to the valid va lues. The entry directly sets the identifier for CAN message to be received (or sent, see Use channel as output) when 7FF or 1FFFFFFF is selected for Mask. LogMessage July 2012 98 © 2010-2012 Delphin Technology AG Mask The filter provides the option to set the CAN bus channel to a whole group of IDs. The range of input depends on the setting in Extended ID . The Mask value is linked with the configured and received ID bit by bit AND. The CAN message will be evaluated when the configured and received ID have the same value, other wise it will be ignored. An identifier group is established when the bits that are to be ignored during evaluation are set to 0. Enter 7FF or 1FFFFFFF when a Mask is not to be used. Example of mask settings ID 0x027 = 100111 = binary, Mask = 0x24 = 100100 binary (numbers with 0x are in he xadecimal format); bit by bit AND operation results in 100100 in binary. The first four digits of the link and ID are identical; last two digits only are 0 and 1. CAN messages are then received with IDs that begin with 1001 (binary) and end with either two zero es or two ones, i.e. all messages with the (binary) IDs 100100, 100101, 100 110 and 100111. Scaling If CAN users send values that require conversion, enable Scaling and enter Min / Max va lues to convert from the Input value into the Scale value . If the Use channel as output option is used, scaling takes place in the opposite directi on: Enter the range from the source data in Scale value and the range for the output signal in Output value. Info Without scaling, the channel's data type is that entered under Data ty pe. When scaling is enabled the floating data type is always used for the channel. This also applies when the channel is used as an output. When scaling is enabled the channel must have the floating data type, otherwise the type under Data type is used. Scaling example In the above image, a conversion from 4800 (pulses) to 300 (km / h) is performed. 99 © 2010-2012 Delphin Technology AG LogMessage July 2012 Use channel as output CAN-bus channels are configured by default as input channels, i.e. they receive data via the CAN bus. This option enables the device to send data to other CAN bus users. Enter either a constant (Manual value) or select an existing channel from Channel whose value can be output. Selecting Application enables the output value to be manually set via the DataService Configuratoror automatically set via a ProfiSignal application. The source value is converted to the type given in Data type. Inherite status (for Channel settings only): The status of the input channel is used but not output to the CAN-Bus. LogMessage July 2012 100 © 2010-2012 Delphin Technology AG 5.8 Configuring Software channels Refer also to Settings for all dialogs Software channels are calculations or functions that are performed within the device. In previous device families from Delphin, such channels were also called virtual channels. Any number of channels can be created. This is a standard feature of the device. Display the Software channels context menu (DataServiceChannels tab). You can then either create a Channel group (e.g. Analog channels in the example) to group together created chan nels, or select one of the available channel operations. The context menu contains all available calculations and functions. Alternatively software channels can be created via the context menu of a hardware chan nel as Create dependent channel. In contrast to creation via Software channel, the source chan nel is already selected within the dialog and the channel is (initially ) located directly under the hardware channel. Following creation, the User defined view enables channels to be moved and grouped differently. Another option enables the linking of a channel. The original channel remains at the original position, but creates at another location an entry that is linked to this channel. Linking channels From the Options in tab in the DataService Configurator select Activate channel move / link. In the User defined view (View Right / left panel Channel sheet options) move or link a channel by left-clicking and holding. Further information is available in the DataService Configurator manual. The rest of the configuration is similar to module channels. Specific settings for each func tion are explained in the sections here. General information on dialogs is available in Settings for all dialogs and General settings for Software channels. 101 © 2010-2012 Delphin Technology AG LogMessage July 2012 5.8.1 General settings for Software channels The following sections explain some of the settings that are available in many of the confi guration dialogs. Channelgroups Edge and level triggers Basic channel selection and Advanced channel selection Inherited status Advanced settings tab Refer also to Tables. 5.8.1.1 Channelgroups Use channel groups to group related or interdependent channels. Any number of channel groups may be created. If required a channel can be linked to more than one group (linked channels: refer to Configuring Software channels). 5.8.1.2 Edge and level triggers Many dialogs have input fields with options for different trigger functions according to edge or level states. The following variations and combinations are available: Edge and level Level Edge (full) Edge (basic) Explanation of options Setting Description Rising edge The event is triggered when changing from "Low" to "High" Falling edge The event is triggered when changing from "High" to "Low" Edge (both) The event is triggered at every change High level The event is triggered when (and for as long as) the level is "High" Low Level The event is triggered when (and for as long as) the level is "Low" LogMessage July 2012 102 © 2010-2012 Delphin Technology AG 5.8.1.3 Basic channel selection Many dialog require a channel to be selected as a source or a target. A basic or advanced channel selection is available. Basic channel selection is accessed directly from the configuration dialog. All configured channels are listed by clicking the arrow on the dropdown list: Click the required channel. If the channel name is known it can be input from the keyboard. The list then filters accor ding to each letter typed. 5.8.1.4 Advanced channel selection Info The advanced channel selection is not yet available for Windows Vista and Windows. This method of display and selection is more convenient for large numbers of configured channels because the advanced filtering function enables only specific channels to be dis played. 103 © 2010-2012 Delphin Technology AG LogMessage July 2012 Open the dialogue box by clicking and channel ID. . The channels are displayed by name, description Enter filter criteria in the Advanced search area. The filtered channels are then displayed. Se lected the required channel and click OK. 5.8.1.5 Inherit status This option sets whether the source's status as well as its value is to be used. This can be used, for example, to prevent invalid input values from entering the process. Channel sta tus values are available in status monitoring. An example of inheriting: A thermocouple wire-break is also displayed in the software channel as a wire break. LogMessage July 2012 104 © 2010-2012 Delphin Technology AG 5.8.1.6 Advanced settings tab (software channels) Default value: This is used in the event of a input or output failure ( refer also to status mo nitor ). The settings depend on channel type. For example, digital inputs only have the op tions Off and On. Force default value (simulation) Sets the channel's output value. This setting is is useful during installation to simulate certain conditions or activate system responses. Do not forget to disable the option for normal operation! Data reduction (Not available for all channel types): A signal is fed through the channel input, processed within the channel and then released at the channel output. The tolerance spe cifies the extent of change a signal must undergo following processing before being output. In the example the processed input value is output only when it differs by more than 0.1 mA to the preceding value. The Data reduction function enables prevents the device from ha ving to process/store superfluous data. As a software channel has no scale or valid range the tolerance value can only be specified in the channel's absolute unit of measurement. Format: For setting data resolution. Persistence (not available for all channel types): The currently valid output value (refer to data reduction) is stored to a non-volatile memory. The channel uses this value following a restart or reboot. This feature is particularly important for outputs to establish a predefined state following a power failure. 105 © 2010-2012 Delphin Technology AG LogMessage July 2012 5.8.2 Accumulator This Software channel adds together all values from the specified source channel: Adder = adder + new value Reset: When enabled, the calculated sum is output only in a reset event and then reset in ternally to zero. When not enabled, the sum is output for each each new value from the source channel. (Refer also to Trigger options ). Generate intermediate values: When enabled, results are also output (without resetting to ze ro) between reset events immediately after their calculation. 5.8.3 Operating hours counter This software channel acquires the time the source has an active level. When the level be comes inactive, the time period is added to the cumulative time period. High level / Low level: Sets the active level of the source. Info The operating hours counter retains its value even when the scale is amen ded. Enable Reset and configure a channel and the trigger ( Edge, Level ) to reset the hour coun ter. Refer also to Trigger options. If the source has an active level when the reset signal occurs, the operating hours counter is reset to zero only after the source becomes inactive again. 5.8.4 Differentiator This Software channel calculates the relationship of the difference between two values from the source channel to the difference between their time stamps based on the time base: Differential = ( Δ Value / Δ timestamp) * time base Refer also to the Advanced settings tab Time base : Enter the time base for the calculation. The default is 1 ms. Enable Trigger when the calculation is to be triggered by specific events. The differential between successive trigger events is then calculated. Refer also to Trigger options. LogMessage July 2012 106 © 2010-2012 Delphin Technology AG 5.8.5 FlipFlop This software channel functions like a hardware flip-flop. Select the type of flip-flop from Mode. A diagram is displayed depending on the selection. Various inputs are available. Disable any unnecessary inputs. The following tables show the possible states. X = any level, ↑ = edge, H = "High" level, L = "Low" level. Refer also to trigger options. JK Flip-Flop Status Y K C Clr Pre (clock) (clear) (pre Q set) 1 X X X H X L 2 X X X L H H 3 L L X L L Previous status 4 H L ↑ L L H 5 L H ↑ L L L 6 H H ↑ L L Toggle 107 © 2010-2012 Delphin Technology AG LogMessage July 2012 RS-Flip-Flop Status S R S+ C Clr Pre set (clock (cle (pre priori ) ar) set) Q ty 1 X X X X H X L 2 X X X X L H H 3 H L X ↑ L L H 4 L H X ↑ L L L 5 H H L ↑ L L L 6 H H H ↑ L L H 7 L L X X L L Previous state In RS flip-flop, there is the additional option of Set priority , i.e. the value at set input (S) has priority when R = H. D-Flip-Flop Status C (clock) Clr (cle Pre ar) (preset) Q 1 X X H X L 2 X X L H H 3 H ↑ L L H 4 L ↑ L L L 5 L L L L Previous state LogMessage July 2012 D 108 © 2010-2012 Delphin Technology AG Latch 5.8.6 Status D C (clock) Clr (clear) Q 1 X X H L 2 D ↑ L D 2 D H L D (transparent) 3 X L L Previous state Limit This Software channel monitors the specified source channel. The result, i.e. the output si gnal of the limit channel, is "High" when the specified alarm conditions are true. The following forms of monitoring are available: Mode Alert when Overrun the value is above the specified range or above the limit/threshold Underrun the value is below the specified range or below the limit/threshold Band monitoring the value is outside the specified range (threshold ± bandwidth) Band violation the value is within the specified range (threshold ± bandwidth) Steady condition values change by more than the bandwidth during hold-up times In addition, no triggering for wire-breaks at the source can also be entered. The setting is only for sources (sensors) which can have wire-break monitoring. For all input, either enter a fixed value (Manual value) or specify a channel that delivers the value. It is possible to change the limit value during measurement. Threshold is the decisive value in monitoring. Hysteresis : Hysteresis prevents the alarm being repeatedly activated for small fluctuations around the threshold value in the monitored signal. Depending on switch direction, the hys teresis lies below the threshold (for overruns) or above the threshold (for underruns). Refer to the images. The hysteresis is especially beneficial for small (noise) signals. The Delay op tion offers an alternative. 109 © 2010-2012 Delphin Technology AG LogMessage July 2012 Bandwidth : Sets the "monitoring window" for Band violation and Steady condition monitoring. In Band violation the "monitoring window" is symmetrical to the threshold. The value entered acts in positive and negative directions as an addition to the threshold. Example: Threshold = 50, bandwidth = 3 means the 47 to 53 range is monitored. Hold-up: The alarm condition must remain true during the specified time to trigger an alarm. The option is an alternative to Hysteresis and is especially suitable to suppress alarms for brief signal distortions with high amplitudes. Both options can be combined. Latching: The alarm is latched (continues to alarm) even when the alarm condition is no lon ger true. Enabling Latching changes Reset trigger for latching. The alarm resets when a reset event occurs, e.g. a Rising edge, in the given channel. The Reset priority option causes an alarm to reset when the alarm condition is still true. Refer also to Trigger options. LogMessage July 2012 110 © 2010-2012 Delphin Technology AG 5.8.7 Impulse generator The software channel can be used in two different modes: Free running: Free running pulses are generated at a fixed repetition rate (Cycle time) and at a set Pulse width. Synchronic to real time: Pulses are generated at a repetition rate according to time. For example, a Cycle time set at 15 minutes generates pulses at 00, 15, 30 and 45 minu tes of each hour. Only discrete values can be entered here because impulses are ge nerated only at whole number ratios. Pulse width: sets the pulse duration, i.e. how long the pulse maintains a "High" level. Cycle time: sets the pulse repetition rate. In Synchronic to real time mode, only specific times can be selected from the list because the cycles must be at whole number ratios. After closing the dialogue with OK a check for validity is performed. If the input is invalid, e.g. the pulse width is greater than the cycle time, an error message is displayed and the previous valid configuration is retained. 111 © 2010-2012 Delphin Technology AG LogMessage July 2012 Source: The Level trigger option means that the pulse generator functions only during the source's active time, The Edge trigger option means that the pulse generator starts with the source's edge and runs continuously until stopped with Reset The diagram shows the release of the pulse ( red curve) by the source ( blue curve). Reset: when the event occurs, immediately resets the pulse generator output to (asyn chronous) "Low" level. If the Level trigger setting is selected, this signal permanently sup presses further pulses occurring at the pulse generator output. Refer also to trigger options. LogMessage July 2012 112 © 2010-2012 Delphin Technology AG Examples The following are examples of possible uses for the pulse generator. Example 1 In this example the pulse generator runs in continuous mode. Cycle time = 5 seconds. A channel has been selected for the pulse width that initially outputs the value 1 and then the value 2. The channel is not permitted to output a negative value (no negative times)nor a value greater than the cycle time, i.e. 5 in this example. Another channel is given for the reset. 113 © 2010-2012 Delphin Technology AG LogMessage July 2012 Once the pulse generator starts ( red curve) with a pulse duration of 1 second, the pulse duration sets to 2 seconds ( green curve). After three pulses, the reset channel ( purple curve) gives the reset signal and the pulse generator issues no more pulses (the next pulse would be due at 8:49:30). Pulses begin again only after deleting the reset signal (level = "Low"). The cycle time indicates that the next pulse will be output at 08:49:50. LogMessage July 2012 114 © 2010-2012 Delphin Technology AG Example 2 In this example the pulse generator runs in controlled mode. The trigger is enabled by setting High level ("High"). The pulse width and cycle time are set by other channels. Note that these channels may not issue negative values (no negative times) nor con flicting values such as a pulse width greater than the cycle time. Another channel is gi ven for the reset. 115 © 2010-2012 Delphin Technology AG LogMessage July 2012 The pulse generator (red curve) is started by the trigger channel (blue curve) with a 2-second pulse duration (green curve) of and a 6-second cycle time (black curve). After three pulses, the pulse duration is increased to 3 seconds (green curve). After another two pulses, the cycle time (black curve) is reduced to 5 seconds. Just before 9:13:00 a reset takes place at the rising edge of the reset channel. Because the trig ger source has a "High" level, the pulse duration re-starts even though a pulse had al ready begun. LogMessage July 2012 116 © 2010-2012 Delphin Technology AG Example 3 The following examples illustrates the relationship between trigger signal and reset si gnal. a) Trigger and reset are triggered by channels and are set to Edge (both) . Then both the signal's rising and falling edges trigger the event. The trigger (blue curve) starts the pulse generator (red Curve) with a rising edge. Then the reset (purple curve) is triggered with a rising edge triggered and the pulse generator stopped. Pulses are generated again only after the trigger emits a new start signal with a falling edge. A falling edge from the reset channel re-stops the pulse ge nerator. Pulses re-start only with a rising edge from the trigger channel. 117 © 2010-2012 Delphin Technology AG LogMessage July 2012 b) The trigger is triggered by a channel and has been set to Edge (both) . The reset is also triggered by a channel, but has been set to High level. The trigger (blue curve) starts the pulse generator (red curve) with a rising edge. Then comes the reset (purple curve). Because the high level ("high") remains, no fur ther pulses are generated (Reset = High level ). Meanwhile the trigger channel switches to a low level ("Low"). However, because the reset channel remains at a high level, the trigger channel's edge has no effect. The pulse generator does not re-start even when the reset channel reverts to a low level; a re-start takes place only with a rising edge in the trigger channel. LogMessage July 2012 118 © 2010-2012 Delphin Technology AG c) Trigger and reset are triggered by channels and are set to High level. The pulse generator (red curve) is started by the trigger channel (blue curve). When a reset signal (purple curve) is received the output is set to "low" and no further pulses are generated. When the reset signal resets to "Low", the pulse generator re-starts (10:25:25) because the trigger channel remains at a high level. In the second example, no further pulses are generated because the trigger channel has meanwhile gone to "low". 119 © 2010-2012 Delphin Technology AG LogMessage July 2012 d) The trigger is triggered by a channel and has been set to High level. The reset is also triggered by a channel, but has been set to Edge (both). The pulse generator (red curve) is started by the trigger channel (blue curve). When a reset signal (purple curve) is received the pulse counter is set to "low", but begins im mediately to generate new pulses because the trigger signal remains "High" and the re set signal is generated only by the edge. The pulse generator stops only after the trig ger signal also goes to "Low". The falling edge of the reset signal has no influence here as no pulses are being generated at the time. LogMessage July 2012 120 © 2010-2012 Delphin Technology AG 5.8.8 Integrator This software channel calculates the area below a curve ( Source ). Integral = ∑(((previous value + current value) / 2) * Δ time-stamp * time-base) Cyclic : New values are repeatedly obtained from the source for the Period input and the in tegral calculated between the current and previous values. A new value is calculated for each interval and added to the running total. Adaptive: When the source delivers a new value, the integral is calculated between this va lue and the previous value. The result is added to running total. Time unit for source: The calculated values are scaled to the source's time unit, e.g. in l/min (for liters per minute, enter 60 seconds). Reset: The calculated integral is output only in a reset event and then reset internally to zero. Refer also to Trigger options. Generate intermediate values: When enabled, totals are also output between reset events di rectly following their calculation, (without being reset to zero). 5.8.9 Linearization Linearization enables an additional conversion to be performed on a channel's values. An advantage of this feature is that the channel's original values remain available with the conversion being performed in a "new" channel. The available options are identical to those for sensor compensation, which can also be performed here in addition to the required linearization. This dialog enables either the set ting of only a conversion function for the channel ( Table type: Local table ) or the use of a global linearization function ( Global table ) which has been set up via the Global linearisation table option in the device's context menu. See also Tables , Global linearisation tables, Settings for all dialogs: sensor compensation tab Method 1.Select a table type. For external tables then select a table; for an internal table, set up a table via the Table tab that is then displayed. 2.Select a source. 3.Set up a table if necessary (Table tab). A table can be imported as well as created: Import. 121 © 2010-2012 Delphin Technology AG LogMessage July 2012 There is a choice of modes: Offset An offset shifts the curve by a fixed value, i.e. the given value is added to the mea surement value. Offset and Gradient Allows a shifting of the curve and an increase in its gradient. Squarely Generates a quadratic curve through the given points to linearize the measured va lues. Linear interpolation Enter a table for the conversion of measured values into display values. Linear inter polation takes place between the given points. Spline interpolation An optimal fitting polynomial 3rd degree (cubic spline) is determined using spline in terpolation for the given values. This is then used to to convert the measured va lues. Info You can use copy and paste to transfer data from an Excel table into the dialog's table. Position the cursor in the table's top left field. Extra rows are created automatically when this is permitted by the selected mode. Click on a row and use the Del key to delete unwanted rows. Insert extra rows in a linear interpolation using the Return key . A created table can be exported and then re-imported later: Export and Im port . LogMessage July 2012 122 © 2010-2012 Delphin Technology AG 5.8.10 Logic This software channel enables the logical linking of digital signals. Various boolean functions are available: AND, OR, NAND, NOR, NOT, XOR and XNOR as well as Antivalence (XOR with more than two inputs) and Equivalence (XNOR with more than two inputs). Add input generates additional inputs. All inputs are linked according to the selected logic. Info NOT, XOR and XNOR functions can link only one or two inputs. Only this number of inputs can then be created. Click to delete an input. Function table NOT Input value Output value L H H L Function table AND Input value A Input value B Output value L L L L H L H L L H H H 123 © 2010-2012 Delphin Technology AG LogMessage July 2012 Function table OR Input value A Input value B Output value L L L L H H H L H H H H Input value A Input value B Output value L L H L H H H L H H H L Input value A Input value B Output value L L H L H L H L L H H L Input value A Input value B Output value L L L L H H H L H H H L Function table NAND Function table NOR Functiontable XOR (exclusive OR) LogMessage July 2012 124 © 2010-2012 Delphin Technology AG Function table XNOR Input value A Input value B Output value L L H L H L H L L H H H Function table Antivalence The output for Antivalence is then "High" if an odd number of inputs are "High" and the remaining inputs are "Low". Input value A Input value B Input value C Output value L L L L L L H H L H L H L H H L H L L H H L H L H H L L H H H L 125 © 2010-2012 Delphin Technology AG LogMessage July 2012 Function table Equivalence Input value A Input value B Input value C Output value L L L H L L H L L H L L L H H H H L L L H L H H H H L H H H H H 5.8.11 Variables This software channel provides a control option that enables either manual control over the processes in a device via the DataService Configurator or automated control via a ProfiSi gnal application. Signal flow is via a variable channel from the DataService Configurator or a ProfiSignal app lication in the direction of the device. Using channel variables differs to analog or digital outputs or COM channels set to outputs, in that access is to the device itself and not just to the connected process. The generated variable is configured as a source for the controlling channel, e.g. as a reset trigger for a counter channel. Application: This option enables variable control via the DataService Configurator or ProfiSi gnal. Set the variable to a constant value via the Variable's context menu in the DataSer vice Configuratoror automatically control the value via ProfiSignal. Manual value: This option sets a constant value for the variable. This setting is useful during installation to test specific devices or activate system responses. Do not forget to disable the option for normal operation! LogMessage July 2012 126 © 2010-2012 Delphin Technology AG 5.8.12 Average This software channel calculates averages from the source values. Simple moving average: This average is calculated from a configured series of values numbe ring from 2 to 1000 values. Moving indicates that each new value from the source is stored to the data series trigge ring calculation of the average from the accumulated values and outputting the result. If the number of values reaches the specified maximum, the data series is then full and a new value from the source then overwrites the oldest value. A device reboot or a configuration change deletes all the accumulated values. Block averaging : This option provides two methods of averaging: Arithmetic mean: The arithmetic mean, also called the average, is the sum of all values of a data series divided by the number of values. Vector average: A vector average is the average for a unit circle. The method is used, for example, for mass flow rates in air conditioning engineering. Edge triggering : The configured average type is calculated at the time of the trigger event for the data series that has accumulated between two trigger events. The result is output following calculation. Level triggering : When a level moves from an active to inactive state, the average is calcu lated from the values accumulated during the active level period. Generate intermediate values: When enabled, the averages between trigger events are output immediately after calculation (after each new source value). Refer also to Trigger options. 5.8.13 Pulse width modulation (PWM) This software channel generates a square signal with a variable frequency and variable pul se-pause ratio. The pulse-pause ratio is determined by the source. Frequency / period : Enter either a fixed frequency/ time for the period of the base wave or name a channel that provides the appropriate value. Lower / Upper limit : Set here the minimum and maximum values for the pulse-pause ratio. A pulse-pause ratio of 0% means that the PWM output is permanently switched off. A pul se-pause ratio of 100% means that the PWM output is permanently switched on. The range of source values is limited to the specified range. 127 © 2010-2012 Delphin Technology AG LogMessage July 2012 5.8.14 Calculation channel This software performs the mathematical formula that has been input. Any number of sources can be linked within the formula. Each source is represented by a variable that can assume either a constant value or the value from the specified channel. Method 1.Set the required variables with Add Variable. A variable named Var0 is created by default but its name can be changed. 2.Set whether the variable is to have a constant value (Manual input) or whether the va lue is to be obtained from a channel (Channel). 3.Enter the formula expression in the Formula field. Restrictions on variable names 1.The first character must be alphabetic. The digits 0-9 are permitted within or at the end of the name. 2.Variable names must be unique (no repeat names in different channels). 3.A distinction is made between upper and lower case letters. Input in the formula field must use the same variable names otherwise the formula is invalid. Example The example calculates the difference between two channels, divides the result by 100 and adds an offset. Input for the formula field Operand1 operator operand2, e.g. pressure 1 - pressure2 Operator operand, e.g. !DigIO1 Function (operand), e.g. sin (pressure) Function (operand1 , operand2), e.g. pow (pressure, 2) LogMessage July 2012 128 © 2010-2012 Delphin Technology AG Available calculation functions Type of calcu Function Data types lation Syntax Operand1 Operand2 Addition bool, int, float bool, int, float Operand1 + Operand2 Subtraction bool, int, float bool, int, float Operand1 Operand2 Multiplication bool, int, float bool, int, float Operand1 * Operand2 Division bool, int, float bool, int, float Operand1 / Operand2 AND bool, int, float bool, int, float Operand1 && Operand2 OR bool, int, float bool, int, float Operand1 || Operand2 NOT bool, int, float - ! Operand1 AND bool, int bool, int Operand1 & Operand2 OR bool, int bool, int Operand1 | Operand2 XOR bool, int bool, int Operand1 ^ Operand2 Negation bool, int bool, int ~Operand1 Left-shift bool, int bool, int Operand1 << Operand2 bool, int bool, int Operand1 >> Operand2 Minimum bool, int, float bool, int, float MIN(operan d1, operand2) Maximum bool, int, float bool, int, float MAX(operan d1, operand2) Basic calculati ons Logical opera tions Binary opera tions (Move ope rand1 to the left by the number of places in ope rand2) Right-shift (Move ope rand1 to the right by the number of places in ope rand2) Operations with sets 129 © 2010-2012 Delphin Technology AG LogMessage July 2012 Type of calcu Function lation Matching ope rations Trig functions Reverse trig. Functions Other operati ons or functi ons Data types Syntax Operand1 Operand2 Less than bool, int, float, string bool, int, float, string Operand1 < Operand2 Less than or equal bool, int, float, string bool, int, float, string Operand1 <= Operand2 Greater than bool, int, float, string bool, int, float, string Operand1 > Operand2 Greater than or equal bool, int, float, string bool, int, float, string Operand1 >= Operand2 Equals bool, int, float, string bool, int, float, string Operand1 == Operand2 Not equal to bool, int, float, string bool, int, float, string Operand1 != Operand2 Tangent bool, int, float - TAN(Operan d1) Cosine bool, int, float - COS(Operan d1) Sine bool, int, float - SIN(Operan d1) Arctangent bool, int, float - ATAN(Operan d1) Arccosine bool, int, float - ACOS(Operan d1) Arcsine bool, int, float - ASIN(Operan d1) Exponential bool, int, float - EXP(Operan d1) Power bool, int, float bool, int, float POW(basis, factor) POW(Operan d1, Operand2) LogMessage July 2012 Square bool, int, float - SQRT(Operan d1) Modulo bool, int, float bool, int, float Operand1 % Operand2 Absolute bool, int, float - ABS(Operan d1) Natural loga rithm bool, int, float - LN(Operand1) 130 © 2010-2012 Delphin Technology AG Type of calcu Function lation Logarithms (base 10) Data types Syntax Operand1 Operand2 bool, int, float - LOG(Operan d1) Data types bool: True or false float: a floating point number or a fraction int: an integer 5.8.15 Collective fault This software channel monitors channels with boolean output signals to generate a common alarm. Its output has an ON state when one of sources (Monitored channels) has an ON-state (logical OR operation). Latching: The alarm is latched (continues to alarm) even when the alarm condition is no lon ger true. A reset event is then required to reset the alarm. If the Latching option is not se lected, the output for the batch alarm channel takes the state of the linked source. Enabling Latching changes Reset trigger for latching. The alarm resets when a reset event oc curs, e.g. a Rising edge, in the given channel. The Reset priority option causes an alarm to re set when the alarm condition is still true. Refer also to Trigger options. Method Select one or more channels to trigger a batch alarm from the Available channels field and click to accept the selection. Select one or more channels from Monitored channels and click lection. 131 © 2010-2012 Delphin Technology AG to remove the se LogMessage July 2012 5.8.16 Setpoint This software channel enables the device to be used as a programmer. The setpoint table enables the conditional procedures to be programmed that can be repeated as often as re quired. Table type: Use a global Global table (Global table setting) that has been created for the de vice (refer to Global setpoint tables) or define a table for a specific channel (Local table set ting). In the latter case, a Table tab will appear. Number of repeats: To determine whether and how often the program sequence will be re peated automatically. After the last repeat the final setpoint remains in the table. Start: The state (Level ) or edge ( Edge) of the specified channel starts the program at the specified number of repetitions. Once the repetitions have been completed, a new or active start event then sets the programmer to the beginning and restarts the program sequence. Break: Pauses the program's execution, i.e. the current setpoint is retained for as long as the specified channel has the set Level. The break pause channel has a higher priority than the start channel, i.e. the start channel does not start the programmer while pause state is active. For Edge settings, the setpoint is retained from the arrival of the edge until the next edge. An event here is also unable to give priority to a start channel over a pause status. Reset: A reset event from the specified channel, sets the program to the beginning but does not start it. The reset channel has the highest priority, i.e. the reset condition pre vents starting by a start event and can override up a pause status. Refer also to Trigger options. LogMessage July 2012 132 © 2010-2012 Delphin Technology AG Table tab The setpoint table creates a conditional procedure whose points are set by value pairs ma de up from a period and a value. Each row of the table describes a program step for time t (fixed or variable) and value y (fixed or variable). Based on the previous value of yi-1 , the t i value indicates how long will it take to achieve the yi value. The first line defines the star ting point of the procedure, so at least two pairs of values need to be entered. If a varia ble is used it requires configuring via the Variables tab. This applies even when using a glo bal (external) setpoint table for the selected channel for Method 1.For each table row (program step) enter the time value (Time) with the unit of time and to be used and the value to be output. 2.Click Add. 3.Enter the required Global Settings. Select a row to change the specified values. Then click Change. Delete removes the selec ted row. A table can be imported as well as created: Import. Numbers (constants) or variables can be used for times and values. The variables are then defined via the Variables tab. For time input, the variable may be used as a value or as a trigger: Variable (value) means that the value of the variable is used as time value. Variable (trigger) means that the channel set for the variable is used as a trigger channel. A trigger event is a rising edge. If this trigger occurs, the value that is programmed into the program step for the trigger is applied as a setpoint and the next program step is then performed. This me thod enables the upgrade of a basic time-controlled program to an event controlled sys tem. 133 © 2010-2012 Delphin Technology AG LogMessage July 2012 Global settings Relative time: When enabled, input times are calculated as a difference to previous time points. When disabled, time values are taken from the start (first value). Example of absolute and relative time input The numerical values are fixed values and in this case refer to identical time points. The final time is 7 (the unit is not stated but might, for example, be minutes). Point no. Absolute Relative 1 0 0 2 1 1 3 5 4 4 7 2 Example In the table in the example, the value for var1 is held for the first 15 minutes. Then, after each 6 minutes (Relative time setting ) the value increases to var2, then lowers to var3 via var1, and then increases again to var1. A change and therefore output of the new value takes place every second. Cycle time: The cycle time for values to be output between two program steps. Intermedia te values are linearly interpolated, i.e. calculated using a linear equation. The intervals used in the table should be as integral multiples of the cycle time. 5.8.17 Statistics This software channel enables a source to be evaluated with a range of statistical functi ons. Moving minimum / maximum : This minimum or maximum is calculated from a configured series of values numbering from 2 to 1000 values. Moving indicates that each new value from the source is stored to the data series trigge ring calculation of the minimum or maximum from the accumulated values and outputting the result. If the number of values reaches the specified maximum, the data series is then full and a new value from the source then overwrites the oldest value. A device reboot or a configuration change deletes all the accumulated values. Block calculations: The number of values in the data series is determined by the frequency of new source values within an interval set by trigger events. A change in the specified chan nel creates the trigger event. Several statistical functions are available in this mode. Edge triggering : The selected function is calculated at the time of the trigger event from the data series that has accumulated between two trigger events. After calculation, the result is output and all the accumulated valuesare deleted. LogMessage July 2012 134 © 2010-2012 Delphin Technology AG Level triggering : When a level moves from an active to inactive state, the selected function is applied to the values accumulated during the active level period. The result is output and the accumulated values then deleted. Generate intermediate values: When enabled, the results between the trigger events are imme diately output after calculation (with each new source value). Refer also to Trigger options . Definitions The minimum is the smallest value within the data series. The maximum is the greatest value within the data series. The variance is the mean square error relative to the mean. The standard deviation is the square root of the variance (not the average deviation!). The True RMS is the root from the sum of the squares of the values by the number of values. The arithmetic mean, also called the average, is the sum of all values of a data series divided by the number of values. The geometric mean is the Nth root from the product of n values. The harmonic mean is the reciprocal from an average of reciprocals. Refer also to Trigger options . 5.8.18 Status monitor This software channel monitors the source and becomes active (switches to " On" ) when the source contains the specified state. Potential alarm functions and their meaning Selection Description Alarm Alarm for card type AMDT, range error Wire break Wire breakage in monitored channel Configuration error Error in configuring the monitored channel Invalid Invalid value in the monitored channel Measuring range overrun The measured value is above the range for the A / D converter Measuring range underrange The measured value is below the range for the A / D converter Hardware failure Error in the hardware Simulated value An internally generated value for testing Not A Number (NAN) The result of a calculation is not a valid number,e.g. a root from a negative number Infinite value (INF) The result of a calculation is infinity (infinity), e.g. division by zero 135 © 2010-2012 Delphin Technology AG LogMessage July 2012 Selection Description Default value Default value for the monitored channel Forced value The Forced value is a default value, e.g. in the event that a sensor is defective at an analog channel Scale range over run The scale range has been exceeded Scale range under run The scale range has underrun General warning An error has occurred while transferring data End of a trigger block End of a trigger block (data storage) Input value out of range The value of the source channel can not be processed. There exists a parameter error 5.8.19 Stopwatch This software channel records the time between a start and a stop event. There are two methods of starting and stopping the stopwatch: 1.Starting and stopping by means of an Edge or Level. 2.Starting from one channel (Edge only ) and stopping from another channel (Edge only) . In the second example, the stopwatch can be restarted (Retriggerable) via a stop (Reset). Enabling Reset at start resets the stopwatch to 0 at a start (Example 1, Case 1). When not enabled the last value is retained and is added to the new interval (Example 1, Case 2). Refer also to Trigger options . LogMessage July 2012 136 © 2010-2012 Delphin Technology AG Example 1 Case 1 Setting: Start / Stop at High level, Reset at start is enabled. The stopwatch starts (red curve) at a high level in the start / stop channel (green curve). Once the level reverts to low, recording stops. The recording time is the high level time. 137 © 2010-2012 Delphin Technology AG LogMessage July 2012 Case 2 Setting: Start / Stop at High level, Reset at start is disabled. The stopwatch starts (red curve) at a high level in the start / stop channel (green curve). The last measured value was 1.5478 seconds. Once the level reverts to low (8.8582 seconds, calculated from the beginning of the high level), recording stops. The last measured value is added to the the current "runtime". The stopwatch thus con tains the value of 10.4060 seconds. LogMessage July 2012 138 © 2010-2012 Delphin Technology AG Example 2 Case 1 Setting: Start at Rising edge, Reset at Rising edge, Reset at start is enabled. With a rising edge in the start-channel (green curve) the stopwatch starts (red cur ve). Because Reset at start is enabled, the stopwatch begins at 0. The rising edge of the reset channel (blue curve) stops the stopwatch. The recording time is the time bet ween the two edges (6.2821 seconds). 139 © 2010-2012 Delphin Technology AG LogMessage July 2012 Case 2 Setting: Start at Rising edge, Reset at Rising edge, Reset at start is enabled and Ret riggerable is enabled. With the first rising edge of the start channel (green curve) the stopwatch starts (red curve). Because Reset at start is enabled, the stopwatch begins at 0. The second rising edge of the start channel resets the timer back to 0. The rising edge of the reset channel (blue curve) stops the stopwatch. The recording time is the time between the the start channel's final edge and the edge of the reset channel (2.2234 seconds). LogMessage July 2012 140 © 2010-2012 Delphin Technology AG 5.8.20 System monitor This software channel displays system information such as CPU load or memory usage. Some of the system monitoring functions are already created in the "Sys tem Monitoring" group. Optional system information Selection Description Unit CPU usage Displays the overall CPU usage. % CPU usage applicati on Displays the main program's CPU usage (data acqui sition and calculation). % CPU Usage system Displays the (operating) system's CPU usage. % Free memory Displays the amount of free memory available. MB Used memory Displays the amount of used memory. MB Up time system Displays how long the operating system has been working, i.e. the time that the device has been on since the last reset. Days Up time application Displays the time that the main program has been running, i.e. the period following a Reset main appli cation or from a switching on of the device or from a Reboot of the device. Days 5.8.21 Timer This software channel enables the changing of source signal times. This permits, for exam ple, new trigger times to be created for a subsequent channel or defined signals to be ge nerated for outputting to the process. A Response delay mode temporally compresses the si gnal source and a Release delay temporally expands a signal. Response delay: The timer channel starts the delay at the source's change to an active state (High level or Low level trigger). After the delay. the timer output switches into an acti ve state ("On") for as long as the source retains an active state. If source's active state is shorter than the delay, no reaction takes place at the timer output. 141 © 2010-2012 Delphin Technology AG LogMessage July 2012 Release delay: The output of the timer channel becomes active ("On") when the source switches to an active state (High level or Low level Trigger ) or edge triggering (Rising edge, Falling edge or Edge (both) triggers). The same edge or a source change from active to inac tive starts the delay. After the delay, the timer's output becomes active ("Off"). The image shows the signal of a dropout delay with level triggering. Retriggerable: This option enables a restart of the delay via other source trigger events du ring the delay. Delay (s): Enter either a constant value (Manual value) or use Channel to select an existing channel whose value determines the delay as a time in seconds. Reset: A reset event (a trigger via Level or Edge) ends the delay time and sets the timer output in a non-active state ("Off"). The reset channel has a higher priority than the sour ce. This enables a reset state to block the timer function. LogMessage July 2012 142 © 2010-2012 Delphin Technology AG Example of a dropout delay The source (purple curve) triggers with a rising edge. The delay is 2 seconds, Retriggera ble is not enabled. The source (purple curve) triggers with a falling edge. The delay is 7 seconds, Retrig gerable is not enabled. 143 © 2010-2012 Delphin Technology AG LogMessage July 2012 Example of a reset The source ( purple curve) triggers with a rising edge, The delay is controlled via a channel, Retriggerable is not enabled, reset (green curve) is performed at Rising edge. The source ( purple Triggers curve) with Rising edge, The delay time is controlled via a channel, Retriggerable is not active, reset ( green Curve) is performed at a High level. The timer (black curve) is then blocked for the duration of the reset signal. 5.8.22 Trigger This software channel uses the signal source to generate a logic signal for further proces sing. Its output is active ("On") after a trigger event (trigger High level, Low level, Rising edge, Falling edge or Edge (both)). A trigger channel can be used for edge detection or recognition of a non-zero numeric va lue. LogMessage July 2012 144 © 2010-2012 Delphin Technology AG 5.8.23 Alarmclock This software channel allows the triggering of specific events at specified times. Depending on the configuration, an alarm clock channel can generate one-off or repeat alarms for the specified duration. Active fields for Alarm settings depend on the repetition settings (Once, Hourly, Daily, Weekly, Monthly or Yearly). Enter in the times in each active field. The alarm clock response is then described in the text box above these fields. In an alarm, the alarm clock's output channel switches to an active state ("On"). Alarm duration (s): Enter either a constant value (Manual value) or use Channel to select a channel whose value determines the alarm duration as a time in seconds. Reset: A reset event (a trigger via Level or Edge) ends the alarm duration and sets the alarm clock output in a non-active state ("Off"). Alarm clock settings are not changed by a reset, i.e. a follow-up alarm may trigger during the configured time. Refer also to Trigger options. 145 © 2010-2012 Delphin Technology AG LogMessage July 2012 5.8.24 Counter This software channel counts events. Count up trigger: The channel's counter is increased by one at the selected edge (Rising edge, Falling edge or Edge (both)). Count down trigger: The channel's counter is decreased by one at the selected edge (Rising edge, Falling edge or Edge (both)). Reset trigger: The channel's counter is output and reset internally to zero at the selected edge (Rising edge, Falling edge or Edge (both)). When enabled Reset trigger the counter is dis played only at a reset event unless the Generate intermediate values option has been enabled. Generate intermediate values: When enabled, the results are also output between Reset events immediately after their calculation (at every counter change). Output update trigger: The channel's counter is output at the selected edge (Rising edge, Fal ling edge or Edge (both)). Refer also to Trigger options. LogMessage July 2012 146 © 2010-2012 Delphin Technology AG Example of counting up The counter (green curve) increases by one for each edge from the source channel (orange curve) until the reset trigger becomes active. The Generate intermediate va lues option is enabled so all new counter states are output immediately. 147 © 2010-2012 Delphin Technology AG LogMessage July 2012 Example of counting down The counter (green curve) decreases by one for each edge from the source channel (orange curve) until the reset trigger becomes active. The Generate intermediate values option is enabled so all new counter states are output immediately. LogMessage July 2012 148 © 2010-2012 Delphin Technology AG Example of outputting a value At the time of value output (light blue curve) the counter is output. The option Gene rate intermediate values is disabled so no intermediate values are output. 149 © 2010-2012 Delphin Technology AG LogMessage July 2012 6 Connection examples This section gives examples of typical sensor and actuator connections. It explains the available connection options that exist and how sensors and actuators are configured. LogMessage July 2012 150 © 2010-2012 Delphin Technology AG 6.1 Connecting sensors Measuring voltages at an analog input Sensors with voltage signals can be connected directly. Info The largest measurement range is ± 10 V bipolar or 10 V unipolar. The smallest range is ± 156 mV bipolar and 156 mV unipolar. 20 mA current measurement at an analog input Sensors with current signals require connection of a load resistor at the device's input terminals. Resistors are available as accessories. Info The load resistance must be between 10 151 © 2010-2012 Delphin Technology AG and 500 . LogMessage July 2012 Measuring temperatures with a thermocouple at an analog input Thermocouples can be directly connected. Use the configuration dialog to set the type (J, K, T, R, etc.). Info The compensation required for the thermocouple is integrated into the device. Enter the compensation channel as the Reference Junction in the Extended settings tab (for the same I / O module). Measuring temperatures / resistances at an analog input Connect resistor or temperature probes with 4-wire technology when possible. This connection method provides the best results since current path and measuring circuit are separate. Measurement current in 2- or 3-wire connectors flows through both, or one, measurement lines. Voltage drops on the measuring line can therefore distort rea dings. Several constant-power sources are available within the device to supply power. Info These sources deliver 1 mA. they can measure resistance values ofup to 10k . LogMessage July 2012 152 © 2010-2012 Delphin Technology AG Sensor at a digital input Digital inputs have two variants: Input for level (recognition) Inputs for frequency measurement or counting Not every input is usable for both functions. Level detection Info The I / O modules AAST, ADFT, AMDT, DIOT, and IOIT OTPT have digi tal inputs for level detection. For reliable detection the input signal must have a "low" level ranging from 0 ... 1.5 V, a "high" level ranging from 3.5 ... 90 V and a minimum pulse width of 1 ms. A maximum of 50 signal changes per second (maxi mum signal frequency) can be recorded. 153 © 2010-2012 Delphin Technology AG LogMessage July 2012 Frequency measurement/ pulse counting Info The I / O modules ADFT, and AMDT DIOT have digital inputs for fre quency measurement / pulse counting. For reliable detection the input signal must have a "low" level ranging from 0 ... 1.5V and a "high" level ranging from 3.5 ... 90V. The maximum measurable signal frequencies are 50 kHz for the ADFT and AMDT modu le and 30 kHz for the DIOT module. LogMessage July 2012 154 © 2010-2012 Delphin Technology AG 6.2 Connecting actuators Actuator at an analog output Info The I / O modules AAST and ADIT have power sources as analog out puts. The maximum permissible load resistance of the actuator is 650 . Info The I / O modules ADFT and AMDT have power sources as analog out puts. The minimum permissible load resistance of the actuator is 2.5k . Actuator at a digital output, resistive load To connect an actuator at a digital output requires an external supply voltage of bet ween 5 and 50V DC (24 V in the examples). 155 © 2010-2012 Delphin Technology AG LogMessage July 2012 Info The maximum switching voltage is 50V and a maximum switching cur rent of 2.5A. Actuator at a digital output, inductive load To connect an actuator at a digital output requires an external supply voltage of bet ween 5 and 50VDC (24 V in the examples). Info The maximum switching voltage is 50 V, and a maximum switching cur rent of 2.5 A. To protect the output's electronic switches we recommend switching to recovery diodes in parallel with inductive loads. LogMessage July 2012 156 © 2010-2012 Delphin Technology AG 7 Measurement technology The section contains general information and recommendations on using measurement technology. 157 © 2010-2012 Delphin Technology AG LogMessage July 2012 7.1 Galvanic isolation A device's I/O modules, interfaces, Ethernet, Ext. BUS, CAN, COM1, COM2, COM3 and COM4 are all galvanically isolated from the central unit (CPU and power) as well as from each other. The CAN ports and COM1 are not isolated from each other and nor is COM2 to COM3. For system reasons, the USB interface is not isolated. The diagram shows the individual galvanic isolating properties of the device. Refer also to shielding. LogMessage July 2012 158 © 2010-2012 Delphin Technology AG 7.2 Earthing The PE terminal for the power supply is the ground terminal for the device. This terminal is internally connected to the metal housings of the USB-/LAN and COM ports but has no connection to the 0 V terminal(s). Connect the PE terminal with a ≥ 2.5 mm2 cable to the protective earth of your power sup ply. Refer also to Shielding , Galvanic isolation. 159 © 2010-2012 Delphin Technology AG LogMessage July 2012 7.3 Earth loops When linking a sensor, measurement device, and computer together then establishes connections between different ground points. Unless the individual devices are connected to protective earth, this electro conductive connection creates an electrical circuit bet ween the devices. The result is a so called earth or ground loop (shown red in the exam ple). This can have the following effects: In practice the earthing points U1 ... U3 shown in the example do not necessarily possess equal potential. Constant or changing potential differences can occur bet ween the earthing points due to the earthing plan and wiring. Compensating cur rents then occur in the sensor and communication circuits. Interference in the sensor or communication circuits, e.g. through electromagnetic fields, enable parasitic currents to occur within the circuit. Compensation and parasitic currents lead to interference or noise voltage at the input of the measuring instrument and thus creating constant or fluctuating measurement errors. Prevent earth loops! Earth loop between sensor—measurement device Galvanic isolation of the I / O modules to the central device means earth loops via the sen sor circuit, as shown in the example, can not occur within the device. Earth loops can ho wever occur between the sensors of different channels of a module. To avoid such loops, we recommend the use of earth-free sensors or signal sources. Refer also to potential differences. LogMessage July 2012 160 © 2010-2012 Delphin Technology AG Earth loop between measuring device—computer Most of the device's interfaces are galvanically isolated to each other and to the central device. The earth loop in the communication circuit, as shown in the example, does not oc cur with the device. Use these interfaces to connect the device to PCs, PLCs or to the equipment from other manufacturers. Refer also galvanic isolation. 161 © 2010-2012 Delphin Technology AG LogMessage July 2012 7.4 Shielding Measurement signals can be disrupted by the occurrence of magnetic and electric fields across the measuring circuits, e.g. generated by neighbouring current-carrying circuits. Shielded cables should therefore always be used for sensor circuitry and kept at least 50 cm away from other current-carrying circuits. The smaller the sensor signal and/or the higher the sensor impedance, the more important is good shielding for low noise, accurate readings. To prevent earth loops, earth the shield on one side of the circuit only (see example). a) Sensors without earth Earthing of the shield is in this case one-sided and directly at the device (PE connection on the power supply). Refer also to earthing. b) Sensors with earthing When the use of earth-free sensors is not possible, earth the shield only or attach it to the sensor's earth potential (see example). Refer also to potential differences. LogMessage July 2012 162 © 2010-2012 Delphin Technology AG 7.5 ESD protection The ADGT 3.0 module has an earth terminal specifically for ESD protection (ESD, E lectro- S tatic D ischarge ) of the inputs. Connect this with the PE labelled terminal (33) via a ≥ 2.5 mm2 cable to the protective earth of your power supply. Refer also to earthing. The other modules do not have ESD protection. Therefore, discharge sta tic before coming into contact with the I / O modules. Simply touch a hou sing with protective earth, the earth contact of the mains socket, or a ra diator or water pipe. Modules can be damaged if static is not discharged. 163 © 2010-2012 Delphin Technology AG LogMessage July 2012 7.6 Potential differences Potential differences can, in principle, always occur between reference potentials of multi ple-sensor signals that are connected to the analog inputs of a I/O module. The following figure shows the sensor signals as green arrows and Umess , and the potential difference between the two sensor signals as an orange arrow and UDifference. The reference potential of a measurement circuit of an analog input for a device occurs by a change of channel of the sensors' different reference potentials. Depending on the input circuit of the various I / O modules of a device, the difference voltage U Difference between certain channels, may not exceed specified maximum values. These are the "Permissible dif ferential voltages from channel to channel" specified in the Technical specifications. WARNING! Connector terminals on I/O modules carry electrical potential from the attached sensors/actuators. Before coming into contact with the connectors, ensure the power is off. There should be no voltage at the connector terminals when the attached sensors ha ve varying potentials or earthed high potentials, e.g. when measuring the elec trical current of a mains voltage phase. Differences in electrical potential between two channels of a module can not be determined from the Measurement data. LogMessage July 2012 164 © 2010-2012 Delphin Technology AG Info If the connected sensors have different potentials and high currents are expected in the event of a short circuit between the sensor potentials, ta ke measures to protect the device and the measurement installation from subsequent damage. 165 © 2010-2012 Delphin Technology AG LogMessage July 2012 8 Technical specifications Main device AAST, ADGT, ADIT and ADVT ADFT DIOT, IOIT and OTPT LogMessage July 2012 166 © 2010-2012 Delphin Technology AG 8.1 Main device Weight, approx. 1 kg Dimensions 200 x 73 x 120 mm Material Plastic housing Humidity 20 ... 80%, non-condensing Temperature range -20 ... 60 ° C Supply 1) 1) 12 ... 28 V AC ± 10% or 12 ... 36 V DC ± 10% Power input, approx. 10 W Mounting Rail 35 mm according to DIN EN 60715 or screw fixing Processor 400 MHz PowerPC with integrated FPU ROM 8 MB of solid state FlashROM SRAM 0.5 MB, battery-backed DRAM 128 MB of DDR Real-time clock Resolution of 100 ms, battery-backed Backup battery CR2450 lithium battery, backup time of at least 10 years Web Server Basic configuration, firmware upgrade, loading and saving configuration The AMDT module requires a supply of at least 18 V A C / DC Ethernet interface Ethernet standards 10/100Base-T (half and full duplex), autonegotiation Protocols TCP/IP, UDP, ICMP, HTTP, SMTP, NTP Modbus TCP Cli ent/Server Connector RJ45 (8-pin connector TP) Galvanic isolation 1.5 kV 167 © 2010-2012 Delphin Technology AG eff LogMessage July 2012 USB interface Interface Type USB master Transmission speed USB 2.0 Full Speed(USB 1.1 compatible) Power for external devices 5 V max. 500 mA (High Power) Connector USB type A External bus (Ext. Bus) Interface Type CAN bus Baudrate max. 1 Mbaud Connector LP-3-pin terminal block (e.g. Wieland type 8113B/3VL) Galvanic isolation 1 kV COM1 Interface Type RS485 interface Baudrate max. 12 Mbaud Connector 9-pin D-SUB connector, pin assignment to IEC 61158 / EN19245 T1 Galvanic isolation 1 kV (no isolation to CAN) Features CAN (CAN bus) Baudrate max. 1 Mbaud Connector 9-pin D-SUB connector, pin assignment according to CiA DS102-1 (pin 2 and pin 7) Galvanic isolation LogMessage July 2012 1 kV (no isolation to COM1) 168 © 2010-2012 Delphin Technology AG COM2 Interface Type RS485 interface Baudrate max. 12 Mbaud Connector 9-pin D-SUB connector, pin assignment to IEC 61158 / EN19245 T1 Galvanic isolation 1 kV (no isolation to COM3) Features COM3 Interface Type RS232 interface Baudrate max. 5 Mbaud Connector 9-pin D-SUB connector, 3 pins used Galvanic isolation 1 kV (no isolation to COM2) COM4 Interface Type RS232 interface Baudrate max. 5 Mbaud Connector 9-pin D-SUB connector, pin assignment according to DIN 41 652, part 1 (ISO 4902) (such as PC connector assi gnment) Galvanic isolation 1 kV 169 © 2010-2012 Delphin Technology AG LogMessage July 2012 8.2 8.2.1 I/O modules I/O modules: AAST, ADGT, ADIT and ADVT Analog inputs Number of inputs AAST: 4 ADGT: 8 ADIT: 10 ADVT: 15 Connections Terminals, max. diameter 2.5 mm 2 Voltage measuring ranges ± 156 mV to ± 10V (bipolar) and +156 mV to +10 V (unipolar) Current range ± 20 mA, 0 ... 20 mA and 4 ... 20 mA Current measurement requires a load resistan ce of 10 ... 500 Ω Sampling rate AAST, ADIT and ADVT: Max. of 600 measure ments / s ADGT: Max. 60 measurements / s Sequential sampling, A / D measurement time for each channel individually adjustable Resolution 24 bits (about 7 decimal digits) Input impedance > 1 GΩ at ADGT> 10 M Measurement error (DC) Thermocouples Voltage / current: ±0.01% of measurement range / end value Pt100: ±0.1 K Pt1000: ±0.1 K Thermo couples: ±0.1% of end value following compensation Built in cold junction built-in, external optional NiCr-NiAl (K), NiCr-CuNi (E), NiCrSi-NiSi (N), FeCuNi (L), Fe-CuNi (J), Pt10Rh-Pt (S), Cu-CuNi (U), Pt13Rh-Pt (R), Cu-CuNi (T), Pt30Rh-Pt6Rh (B), W5Re-W26Re (C) Measuring range -270 ° C ... 2320 ° C depen ding on thermocouple LogMessage July 2012 170 © 2010-2012 Delphin Technology AG Resistance probe / thermometer Pt50 to Pt5000, Ni50 to Ni5000, YSI400 2-wire, 3-wire and 4-wire 1 mA reference current Measuring range -270 ° C ... 850 ° C Resistance measurement 0 … 10 kΩ pH measurement Integrated temperature compensation Self-calibration DC offset, cyclical, frequency adjustable Digital filter Low pass 6 … 1000 Hz. The cut-off frequency is automatically adjusted to the sampling rate. Potential isolation of main device 750 V DC. Dielectric withstand voltage of the channel 110 V Permissible differential voltages from channel to channel ADGT V2.0: 400 V DC ADGT V3.0: 650 V DC AAST, ADIT and ADVT: 110 V Analog outputs Number of outputs AAST: 4 ADIT: 1 Output signal: 0 / 4 ... 20 mA, maximum load resistance 650 Ω Resolution 16 bit Signal error ±0.05% Potential isolation 750 V from channel to channel and main device 171 © 2010-2012 Delphin Technology AG LogMessage July 2012 Digital inputs for level detection Number of inputs AAST: 2 High level 3.5 ... 90 V / 2 mA (typ. 2.7 mA at 5 V) Low level 0 … 1.5 V / 0 … 1.5 mA Refresh rate 1 kHz (1 ms) Minimum pulse width that can be evaluated 1 ms Maximum signal frequency 50 Hz Potential isolation 2.5 kV Reverse polarity protection 1 kV Digital outputs Number of outputs AAST: 2 ADIT: 1 Switching voltage max. 50 VDC Switching current max. 2.5 ADC Inverse diode Integrated Potential isolation 2.5 kV LogMessage July 2012 172 © 2010-2012 Delphin Technology AG 8.2.2 I/O modules: DIOT, IOIT and OTPT Digital inputs for level detection Number of inputs DIOT: 12, including 11 for frequency measure ment / pulse counting IOIT: 24 OTPT: 1 High level 3.5 ... 90 V / 2 mA (typ. 2.7 mA at 5 V) Low level 0 … 1.5 V / 0 … 1.5 mA Refresh rate 1 kHz (1 ms) Minimum pulse width that can be evaluated 1 ms Maximum signal frequency 50 Hz Potential isolation 2.5 kV Reverse polarity protection 1 kV Digital inputs for frequency measurement / pulse counting Number of inputs DIOT: 11 High level 3.5 ... 90 V / 2 mA (typ. 2.7 mA at 5 V) Low level 0 … 1.5 V / 0 … 1.5 mA Gate time 1 ms ... 6000 ms, adjustable in increments of 1 Frequency measurement 0 … 30 kHz. Measurement error 0 … 1 kHz. ±1 Hz >1 … 10 kHz: ±5 Hz >10 … 30 kHz: ±10 Hz Counter width 16 bit Potential isolation 2.5 kV Reverse polarity protection 1 kV 173 © 2010-2012 Delphin Technology AG LogMessage July 2012 Digital outputs Number of outputs DIOT: 16 IOIT: 1 OTPT: 24 Switching voltage max. 50 VDC Switching current max. 2.5 ADC Inverse diode Integrated Potential isolation 2.5 kV LogMessage July 2012 174 © 2010-2012 Delphin Technology AG 8.2.3 I/O module: ADFT Analog inputs Number of inputs 8 Connections Terminals, max. diameter 2.5 mm 2 Voltage measuring ranges ±156 mV to ±10 V Current range ± 20 mA, 0 ... 20 mA and 4 ... 20 mA Current measurement requires a load resistan ce of 10 ... 500 Ω Measurement frequency range (-3 dB) 0 … 4000 Hz. Sampling rate 10 ... 10000 Hz, in 10 stages, individually ad justable for each channel Channels with the same sampling rate can be sampled simultaneously Sampling rate 10 ... 8500 measurements / s 10 ... 10 000 measurements / s using only the analog inputs 1 ... 4 Resolution 14 bits (approx. 1.2 mV in the 10V range) AC / DC coupling DC coupling preset, switching via DIP switch on the device. Input impedance 0.8 MΩ Measurement error (DC) Measurement range ±1.25 V to ±10 V ±0.1% from unipolar measurement range Measuring ran ge ± 0.625 V: ±0.2% from unipolar measurement range Measuring ran ge ± 0.312 V: ±0.2% from unipolar measurement range Measuring ran ge ± 0.156 V: ±0.4% from unipolar measurement range Anti-aliasing filter Optional digital low-pass filter 8./4. Order for sampling 100-10000 measurements / s. The cut-off frequency is automatically adjusted to the sampling rate. Dielectric withstand voltage of the channel ±250 VDC Permissible differential voltages from channel to channel 100 V DC. 175 © 2010-2012 Delphin Technology AG LogMessage July 2012 Analog outputs Number of outputs 2 Output signal 0 … 10 V / 0 … 4 mA Resolution 12 bits (approx. 2.4 mV) Signal error ± 0.25% of output range or ± 25 mV Earth reference Terminals "–" are connected with 1 kOhm to the internal analog ground Digital inputs for level detection Number of inputs 4, including 2 for frequency measurement / pul se counting High level 3.5 ... 90 V / 2 mA (typ. 2.7 mA at 5 V) Low level 0 … 1.5 V / 0 … 1.5 mA Refresh rate 1 kHz (1 ms) Minimum pulse width that can be evaluated 2.5 ms Maximum signal frequency 50 Hz Potential isolation 2.5 kV Reverse polarity protection 1 kV Digital inputs for frequency measurement / pulse counting Number of inputs 2 High level 3.5 ... 90 V / 2 mA (typ. 2.7 mA at 5 V) Low level 0 … 1.5 V / 0 … 1.5 mA Gate time 250 ms ... 5000 ms, adjustable in increments of 250 Frequency measurement 0.2 Hz … 50 kHz Measurement error 0.2 Hz … 100 Hz ± 1% of the input frequency >100 Hz: ±1 Hz Potential isolation 2.5 kV Reverse polarity protection 1 kV LogMessage July 2012 176 © 2010-2012 Delphin Technology AG Digital outputs 8.2.4 Number of outputs 4 Switching voltage max. 50 VDC Switching current max. 2.5 ADC Inverse diode Integrated Potential isolation 2.5 kV I/O module: AMDT The AMDT I/O module on vibration measurement is dealt with in a separate chapter. Refer to E/A-Modul AMDT. Technical data is available in the I/O module AMDT, Technical specifications section. 177 © 2010-2012 Delphin Technology AG LogMessage July 2012 9 I/O module AMDT This section of the documentation describes using and configuring the I/O module AMDT. The I/O module AMDT has been designed for vibration measurement technology. The effi ciency is reached by a DSP (Digital Signal Processor). The processor's firmware (i.e. soft ware within the I/O module) provides many signal processing functions. The documentation is provided under the following headings: Hardware Functions Configuration and operation Each section can be read independently. Just select the section you require. The content is based on this consistent state-of-the-art : ProfiSignal-CD: V3.1.4 Device firmware: V232 AMDT board: V2.0 AMDT firmware: 3.58 Copyright © 2003-2011 Delphin Technology AG. All rights reserved. This document's content, especially text, images, and graphics are protected by copyright. When not otherwise stated, the copyright belongs to Delphin Technology AG, Lustheide 81, in 51427 Bergisch Gladbach, Germany. All the trademarks and brands used in this manual refer only to the respective product or trademark holder. Delphin Technology claims no rights other than those to its own trade marks and brands. LogMessage July 2012 178 © 2010-2012 Delphin Technology AG 9.1 Safety advice Use only the power supply connector delivered, or a power supply with protective insulati on, to power the LogMessage device. WARNING! Sensors / signals without potential isolation and which have a high-voltage po tential, e.g. current measurement in the phase instead of neutral conductor of the mains voltage, produce voltage also at the device's connectors. In such cases, check for voltage at the connectors before coming into contact with them. The device's I/O modules are potentially isolated to each other and to other components within the device. Potential differences greater that 750V can the refore not occur (potential difference cannot be detected from measurement da ta). Replacing/exchanging I/O modules Electronic components are sensitive to ESD (Electro-Static Discharge). Therefore, dischar ge any electrostatic energy before opening the device to install/replace an I/O module. We recommend wearing a wrist band (static discharge wrist band) and to carry out the work on a conductive surface. 179 © 2010-2012 Delphin Technology AG LogMessage July 2012 9.2 Introduction Dear User, Thank you for purchasing the I/O module AMDT. With this module you have acquired a high quality product with extensive options for data acquisition and processing. This manual is included in the delivery. Always keep the manual available for reference. To avoid any damage occurring to yourself or your equipment, carefully follow the guidance and safety precautions given in this manual. If your equipment has a problem that this ma nual does not address, please contact us. This manual is intended for technicians, engineers or similarly qualified persons wishing to install the I/O module AMDT into a device. If you find errors in the product or in this docu mentation, or if you have any suggestions for its improvement, we welcome your feedback. Contact: Delphin Technology AG Lustheide 81 51427 Bergisch Gladbach (Refrath), Germany Telephone: +49 2204 97685-0 Telefax: +49 2204 97685 -85 Email: [email protected] Internet: www.delphin.de Contact USA: Delphin Technology Corp. 4860 Cox Road, Suite 2000 Glen Allen, VA 23660 Virginia, USA Telephone: +1 804 217 8391 Telefax: +1 804 747 6182 Email: [email protected] Internet: www.delphin.com 9.2.1 Included in delivery The I/O module AMDT is usually pre-installed with delivery of the LogMessage device. Devi ces can be equipped with various I/O modules. An existing I/O module my therefore be ex changed for an I/O module AMDT. Included in delivery: A device configured to individual customer requirements with pre-installed or separate I/O module AMDT CD containing software Documentation LogMessage July 2012 180 © 2010-2012 Delphin Technology AG 9.2.2 Symbols used in this documentation To make reading of this manual easier, we have used the following symbols: WARNING! This symbol warns of a potential hazard which - if the safety requirements are not followed - may be fatal or cause serious physical injury. Indicates important information. Info Refers to a special option or explains a special feature. We use italics to highlight individual words within the text. Keyboard input is highlighted in this way. Program menus have a grey background with arrows indicating the respective sub-menus which need to be accessed: Connect Add driver (connection) LogMessage device . Also highlighted in grey and displayed in italics are the dialog headings, buttons, check boxes, input field names, etc. Display status. This should help you to find the relevant fields and buttons or menus within the correspon ding software. Symbols on the device The CE symbol guarantees that products meet the requirements of relevant EU directives. 181 © 2010-2012 Delphin Technology AG LogMessage July 2012 9.2.3 Project planning LogMessage systems are made up of a base device and optional extension devices (the graphic shows a LogMessage system). Each installed I/O module communicates with a CPU via an expansion bus. The I/O module AMDT is equipped with the fastest sampling and transfer rates. Specific conditions need to be taken into account when planning a system. Regulations according hardware set up One I/O module AMDT can be installed in any one slot. Full functioning is then availa ble. When setting parameters, take into account the maximum transfer rate of 10,000 samples/s. Two I/O modules AMDT can be installed in any of the available slots. Ensure adequate ventilation when both I/O module AMDTs are installed in the base device. Full functioning capability is however no longer available. Both AMDT modules can continuously transmit characteristic values but only one AMDT can continuously transmit time signals or frequency spectrums or both. Two synchronized I/O modules AMDTs can be installed in any of the available slots. Synchronization requires additional wiring and occupies digital input 4 and digital out put 4. Ensure adequate ventilation when both I/O modules AMDT are installed in the base device. Synchronization is available only in the "non-continuous recoding" opera ting mode. Both AMDT modules can transfer time signals, frequency spectrums and characteristic values continuously and synchronized. Refer here to the section on synchronizing two AMDT modules. Three or more I/O modules AMDT can not be installed. LogMessage July 2012 182 © 2010-2012 Delphin Technology AG Regulations according number of usable analog inputs Using a digital high pass filter or band pass filter can be limited to 1..4 analog inputs depending on board revision. An overview is available in the section digital filters. Using a digital integrator can be limited to 1..4 analog inputs - depending on board revision. An overview is available in the section Integrator. The application "Vibration severity measurement with acceleration sensors" (using a digital band pass filter and an integrator) can be limited to 1..4 analog inputs - de pending on board revision. Details on this application are described in the manual "Applications with AMDT". The application "Bearing diagnostics with envelope spectrum" (using a digital demodu lation filter) can be limited to 1..4 analog inputs - depending on board revision. Details on this application are described in the manual "Applications with AMDT". Regulations according phase measurement Be aware of the following when using phase characteristic in rotating machinery: Phase measurement can be used only for low rotation speed (typ. < 500 RPM). Acquisition of 1 to 10 signal periods within a time signal block is significant. Refer here to the sections on cha racteristic phase of main amplitude and characteristic phase of 1X/2X/3X/xX component. 183 © 2010-2012 Delphin Technology AG LogMessage July 2012 9.3 9.3.1 Hardware Connector panel (industrial) Information on connections Refer to the technical specifications. Analog inputs Voltage signals with range of max. ±10 V in a frequency range DC … 8000 Hz can be connected. Input impedance equals 0,8 M . Current signals with range of 0/4 to 20 mA are processed using terminating resistors (to be wired between the '+' and '-' connectors). DC-coupling is factory set. Switching is possible using a DIP switch within the module. The permitted total voltage difference between channels is 100 VDC . Analog outputs Output range is 0 to 10 V, max. load is 4 mA (min. 2.5 k ). The '-' connector is connected at 1 k to the internal analog ground point. Digital inputs / counters Square signals/pulses from 5 V / 12 V or 24 V can be connected. Low-level is <1.5 V; high-level is > 3.5V; common '-' connector, potential isolation. Frequency measurement for signals from 0.2 Hz to 30 kHz. Digital outputs Switching voltage at a max. of 50 VDC . Switching current at a max.: 2.5 ADC . Common '+' connector. Potential isolation. LogMessage July 2012 184 © 2010-2012 Delphin Technology AG Shielded cabling The I/O module enables measurement in the signal range DC to 8 kHz. This requires the use of shielded (single-sided shielding connected to protective earth) or twisted pair cables. Sensors Information on connecting special sensors are available in the manual "Applications with AMDT"l. 9.3.2 Connector panel (laboratory) Information on connections Refer to connector panel (industry). 185 © 2010-2012 Delphin Technology AG LogMessage July 2012 9.3.3 Block circuit diagram Block circuit diagram for hardware Block circuit diagram for an analog input signal LogMessage July 2012 186 © 2010-2012 Delphin Technology AG 9.3.4 Technical specifications Specifications may change as part of ongoing technical developments. 9.3.4.1 Galvanic isolation The complete analog set up (analog inputs 1 … 8 and analog outputs 1 … 2) is galvanically isolated to the rest of the system. Each digital input/output is galvanically isolated to the rest of the system. The CAN-Bus interface (Ext. BUS, communication with base device or main CPU) is likewise galvanically isolated. 9.3.4.2 Analog inputs Properties 8 Analog inputs. 14-bit resolution. Differential inputs. 0,8 M impedance. A potential difference totalling 100V is permitted between the differential inputs ('-' connector). Input protection to ±250 V. Sampling frequency Real synchronous/parallel sampling. Non-continuous sampling: A max. sampling frequency of 20480 Hz for 8 channels gives a total sampling rate of about 160000 samples/s. Continuous sampling: A max. sampling frequency of 1024/2048/4096 Hz for 8/4/2 chan nels gives a total sampling rate of about 8000 samples/s. Signal bandwidth / Anti-Alias-Filter (HW) Signal bandwidth is : DC to 8 kHz ±0,8 kHz. Transfer rate for measurement data A max. 10000 samples/s Measurement range Seven voltage measurement ranges are available: Measurement range V ±10 ±5 ±2.5 ±1.25 ±0.625 ±0.312 ±0.156 Resolution mV 1.2 0.6 0.3 0.15 0.08 0.04 0.02 0/4 … 20 mA signals can be converted to voltage signals using terminating resistors of, for example, 50/100/250 . Resistors are to be externally attached between the '+' and '-' connectors. 187 © 2010-2012 Delphin Technology AG LogMessage July 2012 Accuracy DC-accuracy is factory set using calibration and adjustment. Basic accuracyn is ±0.1 to ±0.4 % of the (unipolar) measurement range. Measurement range V ±10 ±5 ±2.5 ±1.25 ±0.625 ±0.312 ±0.156 DC accuracy mV ±10 ±5 ±2.5 ±1.3 ±1.3 ±0.9 ±0.6 % 0.1 0.1 0.1 0.1 0.2 0.3 0.4 For 0/4 … 20 mA signals, terminating resistors need to be used that have an accuracy greater than 0.1 %. AC-coupling The differential input is factory set as DC-coupled. Switching to AC-coupling is possible using a DIP switch on the signal conditioning board. The DC part of a signal is eliminated through a HW-filter. Cut-off frequency is around 4 Hz. The DC part of a signal can also be eliminated through a SW-filter (i.e. through a DSP). Scaling / sensor compensation Channels can be individually scaled. Scaling takes place in the required unit (e.g. ±100 µm for displacment sensors or ±50 g for acceleration sensors). Zero offset correction and am plification correction can be performed using sensor correction. Anti-Alias-Filter (SW) The (SW) Anti-Alias-Filter's frequency limit is set automatically at 40 % of the sampling fre quency setting. This filter is optional. It is a digital deep pass of the 8th to 4th order with Butterworth characteristic. Application Analog inputs deliver continuous or event-triggered recording of vibration/wave signals or of signals requiring rapid sampling. 9.3.4.3 Analog outputs Properties 2 analog outputs. Voltage range of 0 to 10 V. Resolution of 12 bit and/or 2.4 mV. Board V2.0.x : Output range restricted to 0.3 V to 9.7 V. Board V2.1.x : Output range is 0 to 10 V. Max. load of 4 mA at min. 2.5 k . Refresh rate Determined by source channel (e.g. set-point channel). Typical rates are 0 … 10 Hz. Dependent on DSP load. LogMessage July 2012 188 © 2010-2012 Delphin Technology AG Accuracy DC-accuracy is factory set using calibration and adjustment. Basic precision is ±0,25 % of the output range, i.e. ±25 mV. Scaling Channels can be individually scaled. Scaling takes place in the required unit (e.g. 0 to 100 µm for distance/clearance sensors or 0 to 50 g for velocity sensors) Application Analog outputs are used as monitors for specific measurement data (e.g. speed or vibration amplitude). Also as signal generators (z. B. set-point ramp). 9.3.4.4 Digital inputs Properties 4 digital inputs. Galvanic isolation up to 2.5 kV. Reverse polarity protection up to 1 kV. Low-level 0 … 1.5 V / 0 … 1.5 mA. High-level 3.5 … 90 V / 3 mA. Refresh rate Digital inputs are sampled at 1 kHz (1 ms). The minimum signal pulse width is 1 ms. Recom mended pulse width is >2.5 ms. Maximum continuous signal frequency is 50 Hz. Application Digital inputs are used as trigger sources with simultaneous frequency or rotation speed measurement and phase measurement. 9.3.4.5 Counter Properties 2 or 4 digital inputs (see above) are each equipped with 16-bit counters. Choice of pulse counting in the 0 to 65535 range, or frequency measurement in the 0.2 Hz to 30 kHz range. Automatic switching of measurement mode at 100 Hz Refresh rate Counters are sampled at 4 Hz (250 ms). The minimum evaluable pulse width of a signal is 0.02 ms. Recommended pulse width is >0.1 ms. Frequency measurement precision Basic accuracy is ±1 % of the input frequency up to 100 Hz and ±1 Hz above 100 Hz. Application Digital inputs are used as trigger sources with simultaneous rotation speed measurement and phase measurement. 189 © 2010-2012 Delphin Technology AG LogMessage July 2012 9.3.4.6 Digital outputs Properties 4 digital outputs. Galvanic isolation up to 2.5 kV. Switching voltage max. 50 VDC . Switching current max. 2.5 ADC . Integrated protection diode. Recovery diode external. Refresh rate Determined by source channel (e.g. timer channel). Typical range 0 … 10 Hz; dependent on DSP load. Application The digital outputs report warnings or alarms (e.g. generated by limits on vibration charac teristics). Signals are also delivered for process control. LogMessage July 2012 190 © 2010-2012 Delphin Technology AG 9.3.5 Attachment Setting AC-coupling for analog inputs External switching 9.3.5.1 AC-coupling for analog inputs An analog input's DC-coupling can be switched to AC-coupling via two DIP switches on the signal conditioning board. Two switches require activating. Analog input 1 is located on the right. Switch position Function OFF (up) AC-coupling ON (down) DC-coupling AC-coupling is based on 0.1 µF (50 V) serial capacitors – these provide a high-pass cut-off frequency of 4 Hz. 191 © 2010-2012 Delphin Technology AG LogMessage July 2012 9.3.5.2 External cicuits The following includes examples of external cicuits. External divider for analog inputs and measurement range ±25 V or ±20 V An extended measurement range of ±25 V or ±20 V can be achieved with a symmetrical ex ternal resistor divider. The recommended wiring appears as follows: The resistor accuracy class should be (depending on requirements) 0.1 % to 1 %. Input im pedance reduces here to 25 or 20 k . Measuring point scaling must be performed using the DataService Configurator program to raise the factor to 2.5 or 2.0. External AC-coupling AC-coupling can be achieved with symmetrical capacitors. The recommended wiring ap pears as follows: Non-polarized capacitors must be used. The input high-pass has a cut-off frequency of 4 … 0.4 Hz. External AC-coupling is useful for mobile systems. For fixed installations, refer to AC-coup ling for analog inputs. LogMessage July 2012 192 © 2010-2012 Delphin Technology AG External supply for ICP acceleration sensors Basic supply and coupling of measurement signals can be achieved with three components. The recommended wiring appears as follows: The sensor is supplied through a constant current diode. An external source of 24 VDC is required. The dynamic signal undergoes capacitive separation from the static DC operating point voltage. The capacitors and the AMDT input resistors form a symmetrical high-pass with a Cut-off frequency of 0.4 Hz. 193 © 2010-2012 Delphin Technology AG LogMessage July 2012 9.4 9.4.1 Functions Operating mode 9.4.1.1 Non-Continuous recording This is the preset operating mode for the I/O module. Recording, evaluation and measure ment data transfer takes place in sequence, one after the other. The DSP is then on standby for the next trigger event. Signal sampling can take place at up to 20.48 kHz, parallel across 8 channels. The above graphic represents the generation of measurement data associated with com mon triggers. The transmission of the measurement data is time delayed. The timing of the entire cycle depends primarily on the user configuration. The main factors here are: Recording time Determined by the quotient of the "number of samples" and the "sampling frequency". Example: 1024 / 2560 Hz = 400 ms. Evaluation time Determined by the number of active channels "analog input" and the computation ti me required for digital filtering, for FFT analysis, and for calculation of characteristic. Example: about 10 ms/channel for a 1024-point FFT. LogMessage July 2012 194 © 2010-2012 Delphin Technology AG Measurement data transmission time Determined by the number of selected 'active' channels – specifically for channels "analog input" and "FFT/spectrum". Transmission rate is about 10000 samples/s. Or about 100 ms for any 1024 samples. 9.4.1.2 Continuous recording The the I/O module runs continuously in this operating mode. Recording, evaluation and measurement data transmission take place by the DSP continuously and simultaneously. The max. sampling frequency depends on the amount of measurement data that is to be si multaneously transmitted. The sampling frequency is typically 1 kHz parallel on 8 analog in puts with simultaneous transmission of time signals and some characteristic values. The above graphic represents the generation of measurement data associated with com mon triggers. The transmission of the measurement data is time delayed. The maximum sampling frequency is limited to max. 10000 samples/s of continuous measu rement data transmission, and to the performance of the DSP. Depending on the user con figuration, the following rates can be achieved: Transmitted measurement data Time si gnal1) FFT/Spectrum2) X X No. of parallel or active channels Characteristic va lues3) 8 4 2 X 1024 Hz 2048 Hz 4096 Hz X 2560 Hz 5120 Hz 10240 Hz 195 © 2010-2012 Delphin Technology AG LogMessage July 2012 Transmitted measurement data No. of parallel or active channels X 5120 Hz 10240 Hz 20480 kHz 1) Time signal block, each with 1024 samples 2) FFT with 1024 samples or 400 lines 3) 3 characteristic values from the time range and 3 characteristic values from the frequency ran ge 9.4.1.3 Signal simulation In signal simulation, the signals measured by analog-input 1 … 8 are discarded and replaced by demo signals computed by the DSP. This operating mode enables users to perform test runs without having to actually connect signals. A choice of signals and modulation types are available. Signal 1 Description: Harmonic signal Channel 1 … 8: Sinus, 1000 mVpp, 50 Hz Time signal and frequency spectrum : Signal 2 Description: Signal with three frequency components Channel 1: Sinus with 3 components, 1000 mVpp, 100 Hz / 200 mVpp, 200 Hz / 40 mVpp, 300 Hz Channel 2 … 8 with 2 … 8-times amplitude Time signal and frequency spectrum : LogMessage July 2012 196 © 2010-2012 Delphin Technology AG Signal 3 Description: Signals with paired phase shifts Channel 1/3/5/7: Sinus, 1000 mVpp, 50 Hz, 0° Channel 2/4/6/8: Sinus, 500 mVpp, 50 Hz, -90° Time signal: Signal 4 Description: Signal with transient progression Channel 1 … 8: Sinus, emerging/fading, 1000 mVpp, 50 Hz Time signal: Signal 5 Description: Signals with increasing phase shift Channel 1: Sinus, 1000 mVpp, 10 Hz, 45° Channel 2 … 8 with phase 90 … 360° and 2 … 8-times amplitude Time signal: 197 © 2010-2012 Delphin Technology AG LogMessage July 2012 Signal 6 Description: Signals with frequency components and paired phase shifts appropriate to the "shaft vibration" application Channel 1/3/5/7: Sinus with 3 components, 320 mVpp, 40 Hz, 30° / 80 mVpp, 80 Hz, 40° / 16 mVpp, 120 Hz, 50° Channel 2/4/6/8: Sinus with 3 components, 240 mVpp, 40 Hz, 300° / 60 mVpp, 80 Hz, 220° / 12 mVpp, 120 Hz, 140° Each channel with an amplitude-offset of -7000 mV Time signal, frequency spectrum and orbit : Signal 7 Description: Signals with low frequency Channel 1: Sinus, 1000 mVpp, 1.25 Hz Channel 2 … 8: same signal with 2- to 8-times amplitude Time signal: Modulation Optional modulation varies the demo signal from measurement to measurement. Modulation 1 Modulation of amplitude, +50 % to -50 %, for 32 measurements Modulation 2 Modulation of frequency , +50 % to -50 %, for 32 measurements LogMessage July 2012 198 © 2010-2012 Delphin Technology AG Modulation 3 Modulation of phase, +45 to -45 , for 32 measurements Modulation 4 Modulation of offset , +1000 mV to -1000 mV, for 32 measurements Modulation 5 Noise in the range of ±5 % of amplitude Example: Modulation 6 Two anomalies of ±20 % of amplitude at position 3/16 and 11/16 of signal duration. Example: 9.4.1.4 Synchronizing two AMDT modules Synchronization enables 8 + 8 = 16 analog signals to be simultaneously triggered and sam pled. Synchronization is available only in the "non-continous recoding" operating mode. Application example as here described: Synchronization of vibration measurement from 8 + 4 = 12 analog signals. 8 analog inputs are assigned to a master and 4 analog inputs to a slave. Periodic external trigger pulses (form a rotating shaft). Connected to digital input 1 on master and slave. Additional wiring Synchronization requires additional wiring. Digital input 4 and digital output 4 is connected diagonally. Feed voltage and reference mass are also to be connected. 199 © 2010-2012 Delphin Technology AG LogMessage July 2012 Wiring for the application example: The connections in blue are always essential. LogMessage July 2012 200 © 2010-2012 Delphin Technology AG Configuration/Settings Settings for the operating mode is as follows: One I/O module AMDT is configured as "Master", the other as "Slave". Overview of possible trigger settings: External trigger signal Master, Slave, Trigger source Trigger source None Time period Master Analog signal, wired only at master Analog input Master Digital signal, wired at master and slave Digital input Digital input Digital signal, wired only at master Digital input Master 201 © 2010-2012 Delphin Technology AG LogMessage July 2012 Settings for triggering is as follows: Master and slave settings are identical. LogMessage July 2012 202 © 2010-2012 Delphin Technology AG Rules for settings 1. Digital input 4 and digital output 4 are used internally for synchronization. Both channels should be set to inactive. Set Value source to Manual value for digital output 4. 2. Manual configuration amendments to a "slave" require subsequent amendments to the "master" to avoid the handshake becoming incompatible. 3. If no external Trigger signal is used, the time period (of "master") must be set higher than the natural cycle (Recording time + Calculation time + 2 x Measured data transmit ti me) to avoid the handshake becoming incompatible. See timing diagram. Procedure The outcome of synchronization: Triggering takes place (almost) simultaneously. Measure ment data (time signal / frequency spectrum) are transmitted one after the other Timing diagram for the application example: 203 © 2010-2012 Delphin Technology AG LogMessage July 2012 9.4.2 Triggering and recording Properties Software-trigger vie time interval, periodic within the range 1ms .. 60s Hardware trigger via analog input or digital input Trigger threshold, edge, polarization adjustable Non-continuous recording at a sampling frequency in the range 256 Hz .. 20480 Hz (for 1 to 8 channels) Continuous recording at a sampling frequency in the range 256 Hz ..1024 / 2048 / 4096 Hz (for 8 / 4 / 2 channels) Recording depth of max. 8192 or 4096 samples for each channel, max. 8 synchronous channels Pre-trigger in the range 0..100% of recording depth Start stop trigger function for externally determined recording depth Hardware trigger operating mode The trigger signal is preferably received from one of the four digital inputs. One of the eight analog channels may alternatively be used with a preset threshold. LogMessage July 2012 204 © 2010-2012 Delphin Technology AG Comment to illustration above: In example a) the trigger signal starts recording. Recording stops when the recording-time parameter for has been reached (refer to the next section). In Examples b) and (c) the trigger controls starting and stopping of the recording – irre spective of the trigger-pulse parameter. In the event that the stop trigger does not occur, recording is limited to the recording-time parameter (refer to next section). Recording parameters A vibration/wave signal, associated with a time signal, is recorded according to three para meters: sampling frequency, number of samples, and recording time. A frequency spectrum is determined according to the parameters: frequency range, number of lines, frequency re solution. Parameters are related to each other and their settings therefore influence one another. The following table provides an overview: 205 © 2010-2012 Delphin Technology AG LogMessage July 2012 Parameter Symbol Calculation Example Sample rate fs 2560 Hz Number of samples ns 2048 Recording time tr tr = ns / fs 2048 / 2560 Hz = 800 ms Frequency range fra fra = fs / 2.56 2560 / 2.56 = 1000 Hz Number of lines nli nli = ns / 2.56 2048 / 2.56 = 800 Frequency resolution fre fre = fs / ns 2560 Hz / 2048 = 1.25 Hz 9.4.2.1 Redundant trigger source When triggering takes place via an external digital signal, the trigger source can be auto matically switched in the event of a trigger signal failure. There are two variants: Single-stage redundancy The failure of a trigger signal on digital-input 1 switches to the time-period trigger. Double-stage redundancy The failure of a trigger signal on digital-input 1 switches to the trigger signal on digi tal-input 2. If digital-input 2 also fails, the signal is switched to the time-period si gnal. Configuration example: LogMessage July 2012 206 © 2010-2012 Delphin Technology AG Function and visualisation example: Comment to illustration above: A frequency spectrum is measured here every 3 seconds. If the external trigger signal fails, measurement is triggered at a time period of 6 s. Event 1 marks the Failure of trigger signal of Digital input 1. Event 2 marks the recovery of the trigger signal. 207 © 2010-2012 Delphin Technology AG LogMessage July 2012 9.4.3 Time signal Any acquired vibration signal is initially saved to a buffer within the I/O module. The "analog input" channel delivers a block of measured data (e.g. 2048 amplitude values over time). This block is referred to as a "time signal". Properties 128 to 8192 samples, synchronous/parallel sampled at 256 to 20480 Hz Variable pre/post history and/or triggers Digital filters, integrators etc. can be used Data compression can be used for transmission 9.4.3.1 Digital filter Properties Choice of filter type: low-pass, band-pass, high-pass or demodulation filter Filter order of 2 … 8, preset Butterworth characteristic Adjustable cut-off frequency in the range 1 Hz … 10 kHz Adjustable filters for each channel Application High-frequency distortions are filtered out of the signal to be recorded; the signal is filtered for only the frequency range required. Restrictions The digital filter is defeated if necessary by this limitations: Board V2.0 to V2.1.2 : With 1..4 used analog inputs : All filters available. Max. order is 8. With 5..8 used analog inputs : Only Low-pass filter available. Max. order is 4. From board V2.1.3 : With 1..8 used analog inputs : All filters available. Max order is 6. 9.4.3.2 Digital integrator Properties Numerical integration of the acquired vibration signal Fixed scaling factor preset at 1000. Application For measurements using acceleration sensors, a signal (m/s2 unit) is converted into a vele city signal (mm/s unit). Refer to the "Applications with AMDT" manual. LogMessage July 2012 208 © 2010-2012 Delphin Technology AG Restrictions The integrator is defeated if necessary by this limitations: Board V2.0 to V2.1.2 : With 1..4 used analog inputs : Integrator available With 5..8 used analog inputs : Integrator not available From board V2.1.3 : With 1..8 used analog inputs : Integrator available Info When digital integration is enabled, measurement range checking or wirebreak monitoring will not take place. 9.4.4 FFT analysis / frequency spectrum Any acquired vibration signal is initially saved to a buffer within the I/O module. Options are available to then perform an FFT-analysis or to compute a frequency spectrum. Each ana log-input channel is provided with an additional FFT/spectrum channel. That delivers a block measured data (e.g. 800 amplitude values concerning frequency). Properties An FFT/spectrum channel can be separately set up/created (for each analog input) FFT algorithms for 1024, 2048, or 4096 points or with 400, 800, or 1600 lines Frequency range, number of lines and frequency resolution can be set Standard window functions 'Hanning', 'Flat Top', etc. optional Data compression available for for data recording and transmission Scaling Each FFT/spectrum channel can be individually scaled. Scaling takes place in the required unit (e.g. ±100 µm for displacement sensors or ±50 g for acceleration sensors) Application Analysis of characteristic frequencies and their amplitudes for a measured vibration signal. 9.4.5 Characteristics Any acquired vibration signal is initially saved to a buffer within the I/O module. Options are available to then perform an FFT-analysis or to compute a frequency spectrum. It is then possible to calculate various characteristic from the vibration signal and/or the frequency spectrum. One or more additional characteristic channels are available for each analog-input channel. These then deliver characteristic values (e.g. root mean square, a spectrum's peak ampli tude etc.). 209 © 2010-2012 Delphin Technology AG LogMessage July 2012 Properties 1 to 30 characteristic-value channels can be separately set up/created (for each analog input) Simple configuration using selection lists Automatic assigning to source channel Characteristic values No. Characteristic value Ty Note pe 1 Peak-to-peak value T Difference between maximum and minimum 2 Mean value T or DC component 3 True RMS value T 4 Frequency of the main amplitude F Frequency of the main amplitude within spec trum 5 Main amplitude F Main amplitude within spectrum 6 Rotation speed T Frequency/Rotational speed 7 Phase of main amplitude T, F 8 Amplitude of 1X component F Amplitude of the speed synchronous vibration component 9 Phase of 1X component T, F Phase of the speed synchronous vibration com ponent 10 Amplitude of 2X component F Amplitude of the double speed synchronous vi bration component 11 Phase of 2X component T, F Phase of the double speed synchronous vibrati on component 12 Maximum of vector sum T, 2 Maximum of vector sum of two signals (at an order of 90°) 13 Mean of product T, 2 Mean of product of two signals 14 Frequency of main amplitude, band 1 F Frequency of main amplitude for preset fre quency band 1 15 Main amplitude, band 1 F Main amplitude for preset frequency band 1 16 RMS value, band 1 F RMS value for preset frequency band 1 17 Frequency of main amplitude, band 2 F Frequency of main amplitude in preset frequen cy band 2 18 Main amplitude, band 2 F Main amplitude for preset frequency band 2 19 RMS value, band 2 F RMS value for preset frequency band 2 20 Frequency of main amplitude, band 3 F Frequency of main amplitude in preset frequen cy band 3 21 Main amplitude, band 3 F Main amplitude for preset frequency band 3 22 RMS value, band 3 F RMS value for preset frequency band 3 LogMessage July 2012 210 © 2010-2012 Delphin Technology AG No. Characteristic value Ty Note pe 23 Maximum value T Most positive value 24 Minimum value T Most negative value 25 Amplitude of 3X component F Amplitude of triple speed synchronous vibration component 26 Phase of 3X component T, F Phase of triple speed synchronous vibration component 27 Amplitude of xX component F Amplitude of multiple-x speed synchronous vi bration component 28 Phase of xX component T, F Phase of multiple-x speed synchronous vibrati on component 29 Sum value F Weighted sum of all lines of frequency spec trum 30 Remainder value F Weighted sum of all lines of frequency spec trum minus the lines of the harmonic com ponents Type: T = determined from time signal, F = determined from frequency spectrum, 2 = determined from 2 source channels Scaling Scaling is automatically taken from source channel (in case of amplitude) or appropriate preset (in case of frequency or phase angle) Application Analysis of characteristic values for a vibration signal – for time domain and for frequency domain. For example, determining the root mean square of a vibration signal or the peak amplitude of a spectrum. Mathematical definition Mathematical definitions for all the available characteristic values are listed in the following sections. 9.4.5.1 Characteristic "Maximum value", "minimum value" Maximum value The DSP determines (finds) the maximum value (or most positive value) of the time signal. And then delivers the amplitude value. Minimum value The DSP determines (finds) the minimum value (or most nagative value) of the time signal. And then delivers the amplitude value. 211 © 2010-2012 Delphin Technology AG LogMessage July 2012 Smooth curve / Eliminate glitches It might be necessary to smooth curves prior to determining characteristic values when noise or distortions occur within the periodic signals The appropriate settings are available in the Options tab: 9.4.5.2 Characteristic "Peak-to-peak value" The DSP calculates the peak-to-peak value of the time signal, i.e. the difference between the most positive and most negative amplitude values. OptionsSmooth curve / Eliminate glitches It might be necessary to smooth curves prior to determining characteristic values when noise or distortions occur within the periodic signals. The appropriate settings are available in the Options tab: LogMessage July 2012 212 © 2010-2012 Delphin Technology AG 9.4.5.3 Characteristic "Mean value" The DSP calculates the arithmetical average of the time signal. The arithmetical average is also referred to as a signal's steady or DC component. This cha racteristic value is available even when the option "Without DC-part" is enabled for an ana log input (see configuration/settings for an analog input). Apply window function option 213 © 2010-2012 Delphin Technology AG LogMessage July 2012 Select this option to calm measurement data for a static vibration/wave. A weighting is then applied prior to the arithmetic average being calculated. A low weighting is given to the signal's periphery and a higher weighting to its middle. 9.4.5.4 Characteristic "True RMS value" The DSP calculates the root mean square of the time signal. Discretization enables a good approximation to the above exact formula. Info The accuracy of TRMS calculations on sine signals depends on the number of signal periods acquired. The rule of thumb: Errors are <3% for more than 2 periods; Errors are <1% for more than 4 periods. 9.4.5.5 Characteristic "Frequency of main amplitude" The DSP determines (finds) largest amplitude within the frequency spectrum and delivers the frequency of this line. LogMessage July 2012 214 © 2010-2012 Delphin Technology AG 9.4.5.6 Characteristic "Main amplitude" The DSP determines (finds) the highest amplitude in the frequency spectrum and delivers of the amplitude for this line. 9.4.5.7 Characteristic "Phase of main amplitude" Phase angle measurement is useful only for low frequencies/rotations. The computation procedure (see below) shows why. Further information on phase angle definition and on measurement precision etc. is available un der measuring the phase angle. This characteristic value can be determined only when a cyclical digital pulse is connected to a digital input/counter (e.g. the square wave pulse of a rotating shaft). This signal delivers a stable base frequency fn as well as a phase reference or trigger signal. The DSP normalizes the time signal (internally, hidden) to an integral multiple of the basic frequency fn. 215 © 2010-2012 Delphin Technology AG LogMessage July 2012 Using the frequency spectrum associated with the line index fn, the DSP determines the li ne/vibration component's phase angle 0 … 360°. 9.4.5.8 Characteristic "Amplitude of 1X/2X/3X/xX component" This characteristic value can be determined only when a cyclical digital pulse is connected to a digital input/counter (e.g. the square wave pulse of a rotating shaft). This signal delivers a stable base frequency fn as well as a phase reference or trigger signal. Using the frequency spectrum for the line index fn / 2fn / 3fn / xfn, the DSP determines the amplitude of this line/vibration component. Info Acquisition of an accurate fn via the frequency input is essential, as is the highest possible resolution for the frequency spectrum. In the event of de viations between the measured frequency and frequency spectrum's line in dex, evaluation then takes place of the next line. LogMessage July 2012 216 © 2010-2012 Delphin Technology AG Only the free-definable component (Amplitude of xX component) can be set in the range 0 … 100 x fn. See Below the corresponding configuration dialog (Tab Main settings) with the field "Speed factor": 9.4.5.9 Characteristic "Phase of the 1X/2X/3X/xX component" Phase angle measurement is useful only for low frequencies/rotations. The computation procedure (see below) shows why. Further information on phase angle definition and on measurement precision etc. is available un der measuring the phase angle. This characteristic value can be determined only when a cyclical digital pulse is connected to a digital input/counter (e.g. the square wave pulse of a rotating shaft). This signal delivers a stable base frequency fn. The DSP normalizes the time signal (internally, hidden) to an integral multiple of the basic frequency fn. 217 © 2010-2012 Delphin Technology AG LogMessage July 2012 Using the frequency spectrum for the line index fn / 2fn / 3fn / xfn, the DSP determines the 0 ... 360°phasing for this line/vibration component. Only the free-definable component (Phase of xX component) can be set in the range 0 … 100 x fn. See Below is the corresponding configuration dialog (Tab Main settings) with the field "Speed factor": 9.4.5.10 Characteristic "Rotation speed" The DSP determines (finds and counts) the number of signal periods in the time signal. From this, the DSP determines the signal frequency (f = 1 / T) or rotation (n = 60 * f). Edge and threshold values can be set. LogMessage July 2012 218 © 2010-2012 Delphin Technology AG A frequency measurement has upper and lower frequency limits – frequencies outside this range can are not conclusive (i.e. have insufficient accuracy). The following table provides an overview: Sampling frequency Number of samples Lower limit Upper limit fs ns 10240 Hz 2048 10 Hz 1024 Hz 2560 Hz 2048 2.5 Hz 256 Hz 512 Hz 2048 0.5 Hz 51 Hz Frequencies can be measured between the lower limit at 2*fs/ns and the upper limit at fs/10 for selected parameters (recording parameters). The measurement value equals 0 beyond these limits. Below is the corresponding configuration dialog (Main settings) tab: 9.4.5.11 Characteristic "Maximum of vector sum" The DSP performs vectoral addition of all amplitude values from the time signals of two neighboring channels (e.g. analog inputs 1/2, 3/4, ...) and then determines the maximum value. 219 © 2010-2012 Delphin Technology AG LogMessage July 2012 OptionsSmooth curve / Eliminate glitches Smooth curves prior to determining characteristic values may be applicable to periodic si gnals that have noise or distortions. These two settings are available in the Options tab: 9.4.5.12 Characteristic "Mean of product" The DSP multiplies all amplitude values from two time signals of two neighboring channels (e.g. analog inputs 1/2, 3/4, ...) and then determines the mean value. Info For the "Electrical power measuring" application, this characteristic value corresponds to the P unit of measurement (= active power) for current and voltage input values. LogMessage July 2012 220 © 2010-2012 Delphin Technology AG 9.4.5.13 Characteristic "Frequency of main amplitude, band 1/2/3" The DSP determines (finds) main amplitude, within a small frequency band, from the fre quency spectrum, and delivers the frequency of this line. The frequency band is determined by middle of band fm and band width fw. The frequency band can be fixed or adapted to speed. Refer also to amplitude of maximum line, band1/2/3 9.4.5.14 Characteristic "Main amplitude, band 1/2/3" The DSP determines (finds) the main amplitude, within a small frequency band, from the frequency spectrum, and delivers the amplitude of this line. The frequency band is determi ned by band middle fm and band width fw. The frequency band can be fixed or adapted to rotations. This characteristic value can be determined only when a cyclical digital pulse is connected to a digital input/counter (e.g. the square wave pulse of a rotating shaft). This signal delivers a stable base frequency fn. 221 © 2010-2012 Delphin Technology AG LogMessage July 2012 Below is the corresponding configuration dialog (Main settings) tab: Example 1: Fixed frequency band. The characteristic value delivers the frequency spectrum's largest amplitude within the band 100±5 Hz or 95 to 105 Hz Example 2: Frequency band adapted to rotation. Monitoring of the dual synchronous shaft vibra tion in a machine with a rotating shaft. The frequency band midpoint is shifted proportional ly and automatically from 20 to 100 Hz for operating rotations from 600 to 3000 rev/min (10 to 50 Hz). The width of the frequency band is ±5 Hz. LogMessage July 2012 222 © 2010-2012 Delphin Technology AG 9.4.5.15 Characteristic "RMS value, band 1/2/3" The DSP determines (calculates) the RMS value (root mean square) using all the lines wi thin a specific frequency band of the frequency spectrum. The frequency band is determi ned via the fm middle and fw width. The frequency band can be fixed or adapted to rotati ons. 223 © 2010-2012 Delphin Technology AG LogMessage July 2012 The following formula is also available (Alternative formula ): Refer also to "Amplitude of maximum line, band 1/2/3" characteristic value Hint It is recommended that the frequency band is set so that the left and right limits are loca ted between the spectral lines. Each spectral line will then clearly lie within or without. Example A sampling frequency of 2560 Hz and 4096 samples delivers a frequency spectrum with 1600 lines and a frequency resolution of 0.625 Hz. A frequency band midpoint of 100 Hz and a width of 6 Hz. This results in values for k, m and n of: LogMessage July 2012 224 © 2010-2012 Delphin Technology AG 9.4.5.16 Characteristic "Sum value" The DSP determines (calculates) a weighted sum for all lines of a frequency spectrum. Info For a single ideal line (sine wave), there is agreement between Sum value and True RMS value. 9.4.5.17 Characteristic "Remainder value" The DSP determines (calculates) a weighted sum of all quadratic lines of the a frequency spectrum excluding the three harmonic components and, when applicable, a component of choice. This characteristic value can be determined only when a cyclical digital pulse is connected to a digital input/counter (e.g. the square wave pulse of a rotating shaft). This signal delivers a stable base frequency fn. 225 © 2010-2012 Delphin Technology AG LogMessage July 2012 Info Acquisition of an accurate fn via the frequency input is essential, as is the highest possible resolution for the frequency spectrum. In the event of devia tions between the measured frequency and frequency spectrum's line index, evaluation then takes place of the next line. The three harmonic components and the components of choice can be processed as requi red. These components are each calculated using three lines in the above formula. Settings are 1/3/5 lines. Below is the corresponding configuration dialog (Main settings) tab: LogMessage July 2012 226 © 2010-2012 Delphin Technology AG The characteristic value can not be generated without an rotation pulse. The DataServiceConfigurator then displays an error: 9.4.6 Measuring frequency or speed Measuring of frequency or rotation speed of rotating equipment provides the determining of speed as additional information for the frequency spectrum. Properties Frequency measurement via 2 free running counters (16-bit) Connected to digital-input 1/2 Signal frequency of 0.2 Hz to 30 kHz Frequency measurement or pulse counting operating modes Frequency measurement gate time within the 250 5000 ms range Operating mode Settings are made jointly for both counter channels for operating mode (frequency measu rement mode or pulse counting) and gate time. Frequency measurement The appropriate measuring process is automatically selected. The interval of registered pul ses are measured in the 0.2 to 100 Hz (or 12 6000 rev/min) range. In the >100 Hz to 30 kHz range, the number of pulses are measured per gate time. 227 © 2010-2012 Delphin Technology AG LogMessage July 2012 A gate time setting of 1000 ms is recommended. The table shows the values for 1 pulse/ro tation, a gate time of 1000 ms and a sampling frequency of 1000 Hz: Frequency in Hz Rotation Pulse inter in rev/min val Evaluated periods in ms 0.2 12 5000 1 0.5 30 2000 1 1 60 1000 1 2 120 500 2 5 300 200 5 10 600 100 10 20 1200 50 20 50 3000 20 50 100 6000 10 100 200 12000 5 200 500 30000 2 500 1000 60000 1 1000 2000 0.5 2000 5000 0.2 5000 10000 0.1 10000 20000 0.05 20000 30000 0.033 30000 The following applies to the >100 to 30 kHz range: Lower gate times enable faster measu rement data updates. Higher gate times provide higher resolution/measurement precision. Gate time Resolution in ms in Hz 5000 0.2 2000 0.5 1000 1 500 2 250 4 LogMessage July 2012 228 © 2010-2012 Delphin Technology AG 9.4.7 Measuring the phase angle Phase angle measurement is useable only for machinery with low frequen cy/speed. The evaluation procedure shows why. Refer also to characteri stics phase for the main amplitude or phase for the 1X/2X/3X/xX compo nent. Defining the phase angle The phase angle definition corresponds to a sine definition associated with a trigger point. Conversion to a cosine definition is explained below. The following example has two signals. Two signal periods are acquired. Signal 1 has a pha se angle of 0 deg. Signal 2 has a phase ange of 90 deg. Mark 3 shows the trigger point. Measurement accuracy Measurement accuracy is determined by acquisition of the fn basic frequency via the digital frequency input. Select the settings Sampling frequency and Number of samples, to enable acquisition of more than one but less than ten signal periods in a time signal block. This achieves an accuracy of ±1 5 degrees for the phase angle. The following table is for a frequency spectrum with 2048 and 4096 lines. Acquired signal periods >1 2 5 10 20 Measurement deviation phase angle ±1 deg. ±2 deg. ±3 deg. ±5 deg. ±10 deg . 229 © 2010-2012 Delphin Technology AG LogMessage July 2012 The rule of thumb for a measurement deviation of ±5 degrees: Examples Sample rate 2560 Hz 2560 Hz 1280 Hz Number of samples 2048 4096 4096 Input signal range for a measu rement accuracy of ±5 degrees 1.25 to 25 Hz 0.625 to 12.5 Hz 0.3125 to 6.25 Hz Converting a sine definition to a cosine definition The phase angle is given in the range 0 360 degrees. The following table shows a com parison between sine and cosine definitions: Sinus 0 30 60 90 120 150 180 Cosinus 270 300 330 360/ 0 30 60 90 Sinus 210 240 270 300 330 360 deg. Cosinus 120 150 180 210 240 270 deg. Conversion takes place via a calculation channel using the formula "PhaseOut = (PhaseIn + 270) MOD 360". LogMessage July 2012 230 © 2010-2012 Delphin Technology AG 9.4.8 Monitoring The "Limit" software channel monitors characteristic values against threshold values. Limit channels can be logically linked and given to digital outputs. In the same way, functions can be integrated into the monitoring such as averaging, computations or time procedures. Refer to the sections on software channels in the device manual. 231 © 2010-2012 Delphin Technology AG LogMessage July 2012 9.5 Configuration and operation Configuration using the DataService Configurator Visualisation using ProfiSignal Firmware update 9.5.1 Configuration using the DataService Configurator The DataService Configurator gives a hierarchical portrayal of a system's connected com ponents. The following image shows 8 "analog input" channels. Analog input 1 has additional derived channels. The "Analog Input x" channel deliver the time signal (as block of measured data). The value shown here is the maximum value of the time signal. The "Analog Input x FftSpectrum" channel delivers a frequency spectrum (as a block of measured data). The value shown here corresponds to the spectrum's peak amplitude. The following image shows the other channels from the I/O module AMDT: 2 analog out puts, 2 counters, 4 digital inputs and 4 digital outputs. The two counters belong to the first two digital inputs. LogMessage July 2012 232 © 2010-2012 Delphin Technology AG Overall functioning is organized according to channels. As a rule, each channel delivers one measurement value. Channels can be added or deleted. Configuring/setting the entire I/O module Open the configuration dialog via the context menu (right-click) or double-clicking an I/O module. The dialog is described in configuring/setting the I/O module. Configuring/setting single channels Open the configuration dialog via the context menu (right-click) or double-clicking a chan nel. The dialog is described in configuring/setting an analog input. 233 © 2010-2012 Delphin Technology AG LogMessage July 2012 Adding/deleting an FFT/spectrum or characteristic value channel Add channels using the analog input's context menu (right-click). Delete a channel using that channel's context menu The dialog is described in configuring/setting an FFT/spectrum. LogMessage July 2012 234 © 2010-2012 Delphin Technology AG 9.5.1.1 Configuration/settings for I/O module I/O module settings take place for all analog inputs. The most important settings are on the tabs: Operating mode, Triggering and Recording. Operating mode tab Recording To set the main mode of operating: Non-continuous: Recording, evaluation and measurement data transfer takes place in chronological sequence. Refer to Non-continuous recording. Continuous: Recording, evaluation and measurement data transfer takes place in paral lel. Refer to Continuous recording. FFT analysis To enable/disable internal FFT analysis. This setting affects the settings options available on the Recording tab. Transmitted measurement data To globally set which of the three measurement data types are to be transmitted, irre spective of whether the corresponding channels have been created and are active. Simulation To enable signal simulation. Refer also to signal simulation. 235 © 2010-2012 Delphin Technology AG LogMessage July 2012 Triggering tab Trigger source A trigger event starts recording (i.e. signal acquisition). Select from four trigger-source options: Time period The I/O module's internal time counter is used to generate periodical trigger events. Analog input The trigger source is one of the I/O module's eight analog inputs. Digital input The trigger source is one of the module's four digital inputs. Master The trigger source is a second I/O module AMDT. Refer to synchronizing a se cond AMDT. Trigger channel Selects the triggering channel. This is always one of the I/O module's own channels. Trigger period To set a time period, between two trigger events, in the 1 ms 60 s range. Note: A short time period can extend the actual period when the total time is greater for recording, evaluation and data transmission. Trigger threshold For analog-input triggering, sets the threshold value at ±0 ring range. LogMessage July 2012 100% of the input measu 236 © 2010-2012 Delphin Technology AG Pre-Trigger This option is available only for the Non-continuous operating mode. For triggering via analog input or digital input, sets the amount of signal pre-history as 0..100% of recording depth (i.e. signal length). Mode and polarity Sets the type of triggering. Analog input: With over-run or under-run of the threshold/ limit value. Digital input: With logical 1 or logical 0. Start-Stop trigger and number of trigger pulses This option is available only for the Non-continuous operating mode. This option dynamically controls the recording signal length for analog or digital input triggering. Refer to triggering and recording. Recording tab Used analog inputs Operation can reduce the number of analog inputs from 8 to 4 / 2 / 1. This reduces the time for evaluation and for measurement data transmission, or increases the trigger ra te. Some functions are available only for settings of ≤4 channels. Refer also to project planning. This is setting takes priority over the analog inputs marked as Active. 237 © 2010-2012 Delphin Technology AG LogMessage July 2012 Sample rate Sets the sampling frequency in the 256 Hz to 20480 Hz range. The setting is applied to all selected analog inputs. The Operating mode affects the options that are available he re. Number of samples The number of samples (i.e. measurement values) in the 128 to 8192 range for a time signal. The setting is applied to all selected analog inputs. The Operating mode affects the options that are available here. Recording time Information about the time signal. It is determined from the sampling frequency and number of samples and then displayed here. Frequency range/ number of lines / frequency resolution Information about the frequency spectrum. It is determined from the sampling frequen cy and number of samples and then displayed here. Time signal tab Compression Time signals can be compressed prior to transmission. This can reduce transmission speed and increase storage capacity in the data logger memory. Select the required Method: None The time signal is transmitted without compression Log. compression (µ-Law) Amplitude values undergo logarithmic compression; the compression fact equals 2:1. Amplitude error following decompression is ±2 % max. LogMessage July 2012 238 © 2010-2012 Delphin Technology AG Delta coding Amplitude values are transmitted as absolute (for minor changes) or relative (as differences). The compression factor ranges between 2:1 and 1:1. No compres sion/decompression loss. Minimum-/Maximum values The time signal is reduced to the local maximum or minimum. More information is available in the "Applications with AMDT" manual (in the generator/air-gap secti on). FFT/Spectrum tab Window function Enables a weighting function for the time signal The weighting is applied prior to run ning the FFT analysis. Options are "Hanning" (recommended for high frequency precisi on) or "Flat Top"(recommended for amplitude precision). Compression Frequency spectrums can be compressed prior to transmission. This can reduce trans mission speed and increase storage capacity in the data logger memory. Select the re quired Method: None The frequency spectrum is transmitted without compression Log. compression (µ-Law) Amplitude values undergo logarithmic compression; the compression fact equals 2:1. Amplitude error following decompression is ±2 % max. 239 © 2010-2012 Delphin Technology AG LogMessage July 2012 Averaging A frequency spectrum can be averaged within the device via measurement cycles n = 2 32. The Intermediate block values transmits a frequency spectrum corresponding at averaging level (1, 2, 3, , n) for each measurement. The End block value transmits a frequency spectrum at a corresponding averaging level only after n measurements. Order analysis When order analysis is enabled, the evaluation software (e.g. ProfiSignal) will be infor med that the measured frequency spectrum is to be portrayed as an order spectrum. The spectrum is then normalized to the measured rotation. This requires that a rotati on-pulse is connected and a frequency measurement is activated. Speed measurement tab Counter mode Both counters are assigned directly to first two digital inputs. Two modes are possible: Pulse counting Frequency measurement Settings are made simultaneously to both counters. Pulse counting is consecutive (16bit = 65536) and reset is not possible. Frequency measurement takes place automatically in Hz. More information is available in measuring frequency or speed. LogMessage July 2012 240 © 2010-2012 Delphin Technology AG Speed measurement, Source Sets one of the digital or analog inputs as source for measuring speed to which the FFT analysis is assigned. Key word: Rotation speed stamp to frequency spectrum and order analysis. Set to digital-input 1 or 2 when the frequency measurement is taking place via one of these inputs. Redundancy mode Two speed pulse sensors and two digital inputs can be operated creating the possibility of redundancy. Refer here to redundant trigger source. 9.5.1.2 I/O module / measurement block counter Measurement data undergoes evaluation and transmission depending on I/O module settings and trigger events. The DataService Configurator displays a counter for the number of recorded measurementdata blocks, as status information for the I/O module AMDT. 9.5.1.3 Configuration/settings for analog input Refer also to the technical specifications for analog inputs. Active Activating this channel transmits the time signal as a measurement data block following each triggering. Non-required channels should be deactivated. Info The Time signal tab of the I/O module includes more settings with affects to all analog-input channels. See section Configuring/setting an I/O module. 241 © 2010-2012 Delphin Technology AG LogMessage July 2012 Main settings tab Sensor type / Mode / Measuring range Defining the input measuring range. Sensor type enables selection between a volt and current interface. Mode enables selection between a bipolar and unipolar measuring ran ge. Measuring range selects one of 7 possible measuring ranges from ±10000 mV to ±156 mV. Scaling / Unit The four Scaling fields contain scaling as a choice of two points of a linear ordering. Example: Enter the unit g and the following Scaling values for a velocity sensor with a sensitivity of 100 mV/g: Inversion Activates signal inversion. Takes place following recording and prior to evaluation. Without DC part Eliminates a signal's DC part. Takes place following recording and prior to evaluation. The DC part is still made available as a measurement value (arithmetical average cha racteristic value). LogMessage July 2012 242 © 2010-2012 Delphin Technology AG Apply window function Select this option to calm measurement data for a static vibration. A weighting is then applied prior to the arithmetic average being calculated. The signal's periphery is weighted lower and its middle higher. Rectification Activates signal rectification. Takes place following recording and prior to evaluation. Advanced settings tab Default value The value set here is transmitted as a measurement value when a normal measurement value is missing. Formatting The required number of decimal places for the measurement value is set, e.g. for dis play in the DataService Configurator. 243 © 2010-2012 Delphin Technology AG LogMessage July 2012 Additional settings tab Measuring range check Monitors whether the input signal remains within the physicl voltage range (e.g. ±10 V) . Wire break monitoring Monitors whether the arithmetical average (DC component) of the input signal remains within the preset voltage range. Anti-Alias-Filter (SW) The software-Anti-Alias-Filter is a digital low-pass whose cut-off frequency is around 40 % of the set sampling frequency. Select the Automatic, to work with the FFT analy sis. Compression The I/O module can be set to compress measurement data for transmission of all active analog inputs. Refer to the time signal tab in configuring/setting an I/O module. This op tion enables individual analog inputs to be excluded from such compression. LogMessage July 2012 244 © 2010-2012 Delphin Technology AG Filter settings tab Filter Activates digital filtering of the time signal. Options are low-pass, band-pass or highpass filters. A Butterworth characteristic is preset. Filter order is automatically set in ternally. Cut-off frequencies can be set at the 1Hz to 10000 Hz range. Using a digital high pass filter or band pass filter can be limited to 1..4 analog inputs - depending on board revision. An overview is available in the section digital filters. Integrator Activates numerical integration of the time signal. The scaling factor is fixed at a pre set value of 1000. Example: For measurements using velocity sensors, a vibration/wave velocity signal (m/ s2 unit) is converted into a vibration speed signal (mm/s unit). Refer to the "Applicati ons with AMDT" manual. Using a digital integrator can be limited to 1..4 analog inputs - depen ding on board revision. An overview is available in the section Integra tor. 245 © 2010-2012 Delphin Technology AG LogMessage July 2012 Sensor correction tab Mode / Calibration points Performs correction for offset and gain. A simple variance analysis is used. Input is re quired of two points from the linear characteristic curve. 9.5.1.4 Configuration/settings for FFT/spectrum Main settings tab Active Activating this channel transmits a frequency spectrum as measurement data following each triggering. Unrequired channels should be deactivated. Scaling The "FFT/spectrum" channel is derived from one of the analog-input channels and therefore inherits its scaling. The effective scaling is grayed-out here. LogMessage July 2012 246 © 2010-2012 Delphin Technology AG 9.5.1.5 Configuration/settings for characteristics To add a characteristic-value, click on the source analog-input and right-click to display the required context menu – refer to image below. To delete, use the channel's context menu. Technical specifications for each characteristic : see section characteristics 247 © 2010-2012 Delphin Technology AG LogMessage July 2012 Main settings tab Here characteristic "Peak-to-peak value" as example: Active Activating this channel transmits the selected vibration/wave characteristic value as mea surement data following each triggering. Measurement range /Scaling / Unit The "Characteristic value" channel is derived from one of the analog-input channels and therefore inherits its scaling. The effective scaling is grayed-out here. Exceptions are those characteristic values that deliver frequency or phase measurements. Scaling is then preset to Hz or ° (degrees). More setting options : see section characteristics. LogMessage July 2012 248 © 2010-2012 Delphin Technology AG 9.5.1.6 Configuration/settings for analog output Refer also to the technical specifications for analog outputs. Output is always in the range 0 10 V. Main settings tab Source Source selects from various signal sources: Application: Output data is controlled via a ProfiSignal application. Channel: Output data is controlled via a DataService channel. Manual value: Output is set manually. Scaling Defines the physical basis for the output unit of measurement. In the example 0 100 % is assigned the output value 0 10 V. 249 © 2010-2012 Delphin Technology AG LogMessage July 2012 9.5.1.7 Configuration/settings for digital input Refer also to the technical specifications for digital outputs. Main settings tab Inversion Activates logical inversion. LogMessage July 2012 250 © 2010-2012 Delphin Technology AG 9.5.1.8 Configuration/settings for counter Refer also to the technical specifications for the counter and the section on measuring frequency and rotation. The (measuring frequency or counting pulses) mode is set under the Measuring rotation tab. Refer to configuring/setting an I/O module. Unit The preselected unit for frequency measurement is Hz . Enter here the desired unit. Main settings tab Scaling Sets conversion factor for the measurement. As a choice of two points of a linear orde ring. 251 © 2010-2012 Delphin Technology AG LogMessage July 2012 9.5.1.9 Configuration/settings for digital output Refer also to the technical specifications for digital outputs. Main settings tab Source Source selects from various signal sources: Application: Output data is controlled via a ProfiSignal application. Channel: Output data is controlled via a DataService channel. Manual value: Output is set manually. Inverted Activates logical inversion. LogMessage July 2012 252 © 2010-2012 Delphin Technology AG 9.5.2 Visualization using ProfiSignal ProfiSignal is a complete system for applications for measurement data acquisition, analysis and visualization. It replaces former products,e.g. VibroLab, BasisPaket or Process visualisa tion. The following images show examples of a diagram with some time signals and a diagram with a frequency spektrum : 253 © 2010-2012 Delphin Technology AG LogMessage July 2012 9.5.3 Firmware update Firmware for the I/O module AMDT is included in the device firmware. Firmware updates ta ke place via the device's Ethernet interface and any internet browser. Refer to the sections on firmware update in the device manual. The device's power supply must not be interrupted during firmware upda ting otherwise damage may occur to the equipment that will require repai ring. Method Open your internet browser Enter the IP address of your device (example): Click Update firmware. Enter the file with the new firmware in the New firmware file field on (click Search to find the file on your PC). The click Start firmware update. The firmware upgrade takes 4 to 6 minutes. LogMessage July 2012 254 © 2010-2012 Delphin Technology AG The device will reboot after the update (reboot). A message is displayed during loading and when a restart has been completed: The process finishes about one minute later. Then return to the home page ( Back ). 255 © 2010-2012 Delphin Technology AG LogMessage July 2012 9.6 Information on applications The "Applications with AMDT" manual contains information on typical industrial applications. It includes information on the fundamentals of applications, advice on connections, examp les of configurations, and much more. The main section are : Measurement of absolute bearing vibration Measurement of relative shaft vibration Air gap monitoring LogMessage July 2012 256 © 2010-2012 Delphin Technology AG 9.7 Appendix to older AMDT hardware This appendix explains features and differences to older hardware. AMDT boards V1.0 to V1.2 were manufactured and supplied from 2000 to 2005. AMDT V1.0 to 1.2 AMDT V2.0 Measurement range ±10 V, alternatively ±25 V or ±2,5 V adjustable via jum pers ±10 V, ±5 V, ±2,5 V, ±1,25 V, ±625 mV, ±312 mV, ±156 mV, ad justable via software Coupling DC-coupling Preset DC-coupling, choice of ACcoupling via DIP switch Max. sampling frequen cy 25 kHz 20.48 kHz Oversampling No Yes Anti-aliasing filter Set by hardware (SMDs), possi ble to replace the signal condi tioning board Automatically adapts, with digital fil ter (DSP) Potential isolation A potential difference totalling 2.5 V is permitted between the differential inputs ('-' connector) . A potential difference totalling 100 V is permitted between the differential inputs ('-' connector). Input protection to 25 V to ±250 V Input hysteresis No Yes Input current, type 8 mA 3 mA Updating Coupled to analog inputs (trig ger) Independent Frequency measure ment 0.1 Hz to 100 kHz 0.2 Hz to 30 kHz Measurement procedure Pre-parameterized automatic Updating Coupled to analog inputs (trig ger) Independent Output range ±10 V 0 ... 10 V Updating Coupled to analog inputs (trig ger) Independent Coupled to analog inputs (trig ger) Independent Analog inputs Digital inputs Counter Analog outputs Digital outputs Updating Other 257 © 2010-2012 Delphin Technology AG LogMessage July 2012 Power supply 24 V 12 or 24 V Availability Low-pass/high-pass/band-pass for analog-input 1 ... 8 Low-pass for analog-input 1 ... 8, high-pass/band-pass for analog-input 1 ... 4 Filter order Adjustable, 2/4/6/8 Automatically optimized , 4 or 8 Filter procedure Non-continuous or continuous Always continuous Availability basic integrator for analog-input 1 ... 8 Basic integrator for analog-input 1 ¼ 4 Integrator procedure Non-continuous or continuous Always continuous No Yes for low rotations, via time-zoom procedure Digital filter Digital integrator Measuring phase Availability Envelope spectrum (for roller-bearing diagnostics) Availability LogMessage July 2012 Yes, via sequential mode Yes, for analog-input 1 ¼ 4 258 © 2010-2012 Delphin Technology AG 10 Appendix: 10.1 EC declaration on conformity LogMessage 259 © 2010-2012 Delphin Technology AG LogMessage July 2012 10.2 ISO 9001 certificate LogMessage July 2012 260 © 2010-2012 Delphin Technology AG Index -DData reduction 105 Data transfer to USB 64 Default configuration 49 Default value 105 Deleting module entries 76 14 105 Device Device Configuration (LogMessage) 55 Device connections 14 Device ID 56 Device memory 60 Dialog footer (explanation) 66 Dialog for main settings, sensor compensation 69 Dialog header (explanation) 66 Differentiator 106 Digital input 91 with counter function 89 with frequency measurement 89 Digital output 93 -AAdder 106 Advanced channel selection 103 Advanced settings (software channels) Advanced settings tab 68 Alarm clock 145 Analog input 79 Analog output 92 Average 127 -BBasic channel selection 103 Basic device configuration 56 Basic Settings 13 Batch alarms 131 -C- -E- Calculation channel 128 CAN interface Configuration 94 CE symbol 6 Channel configuration (LogMessage) 55 Channel configuration (overview) 41 Channel groups 102 Channel selection Advanced 103 Basic 103 Clock settings 46 COM interfaces Configuration 94 Wiring 20 Compensation 79 Configuration via an internet browser 43 Configuring a LogMessage device 56 Configuring main unit 56 Counter 146 Current sensor type 83 Current sensor type (0/4..20 mA) 84 Earth loops 160 Earthing 159 Edge trigger 102 ESD protection 163 Establishing a connection to the device Ethernet interface 94 Examples Connecting actuators 155 Connecting sensors 151 Explorer view 55 External linearization tables 71 External setpoint tables 73 10 -FFirmware changelog FlipFlop 107 Format 105 53 -GGalvanic isolation 158 Gateway 44, 58 Getting started 7 261 © 2010-2012 Delphin Technology AG LogMessage July 2012 Network settings Ni xxx 85 NTP 46, 58 NTP status 47 -II/O module replacement 28 I/O modules Terminal assignment 23 Identify an unknown IP address 43 Included in delivery: 4 Inherit status 104 Install programs 9 Integrator 121 Internal battery replacement 36 IP address 44, 58 ISO 9001 certificate 260 -OOperating hours counter Persistence 105 Potential differences 164 Power input 16 Power Supply 16 Power supply: 16 Pt xxx 85 Pulse generator 111 Pulse width modulation (PWM) PWM 127 14 -LLamps 17 LAN LEDs 17 LED lamps 17 LEDs 18 Level trigger 102 Limit value 109 Linearization 121 Linearization tables Load configuration Load resistor 84 Logic 123 Quick Start Reboot 54 Reboot device 54 Replacement Battery 36 I/O module 28 Memory card 32 Reset 14 Reset button 54 Resistance sensor type 81 Resistance thermometer sensor type Restart main application 53 70 48 85 32 -SSafety Advice 2 Save configuration 48 Set point tables 70 Setpoint (software channel) 132 Setting network address 10 Settings for all dialogs 66 Settings for USB export 63 -NJuly 2012 7 -R- Markers 126 Measurement range monitoring 79 Memory 60 Memory card installation and upgrade Module information 76 Module layout 23 Module number 76 Module replacement 28 Module settings 76 44, 58 LogMessage 127 -Q- -M- Network 106 -P- -KKeys 10, 44, 58 262 © 2010-2012 Delphin Technology AG Shielding 162 Software 9 Software channels 101 Statistics 134 Status monitoring 135 Stopwatch 136 Subnet mask 44, 58 Symbols in this document 6 Symbols used in this documentation System monitoring 141 System report 50 System requirements 5 6 -TTables 70 Technical specifications 166 Main device 167 Temperature formats 85, 87 Terminal 43 Terminal block configuration 23 Thermocouple sensor type 87 Timer 141 Trigger (software channel) 144 Trigger variants 102 -UUnknown IP address? 43 Update Firmware 51 Updating firmware 53 USB 17 USB Memory Stick 64 -VView channels 48 Voltage sensor type 80 -WWeb configuration 43 Wire break monitoring 79 263 © 2010-2012 Delphin Technology AG LogMessage July 2012