1
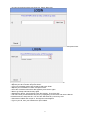
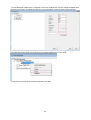
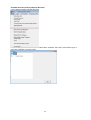
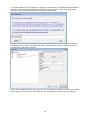
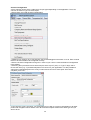
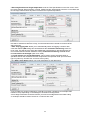
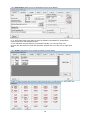
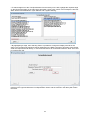
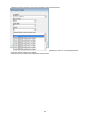
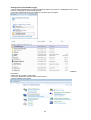
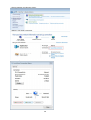
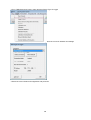
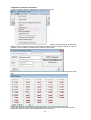
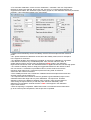
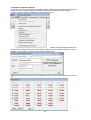
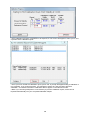
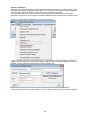
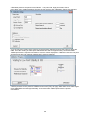
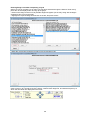
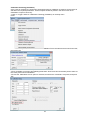
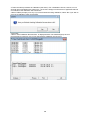
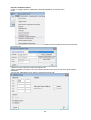
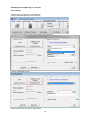
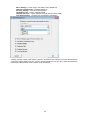
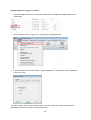
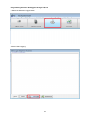
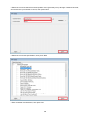
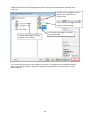
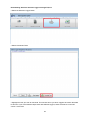
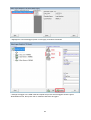
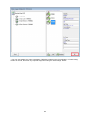
INDEX
· Page 4 TQ Soft and IP Reports Installation and Setup
· Page 5 Setting Up A New User
· Page 8 Company Name & General Setup Options
· Page 9 Test Equipment Records
· Page 11 Chamber Records
· Page 13 Channel Configuration
· Page 15 Test Specifications
· Page 23 Setting Up Agilent Datalogger
· Page 25 Setting Up Fluke NetDAQ
· Page 30 Setting up Thermal Bath
· Page 31 Setting up Temperature Reference
· Page 32 Temperature Calibration (Automatic)
· Page 35 Temperature Calibration (Manual)
· Page 39 Pressure Calibration
· Page 42 Performing a Test
· Page 46 Entering Stage Lines After Completing a Cycle
· Page 53 Calibration Checking
· Page 51 The Current Test Menu
· Page 54 Data Management
· Page 56 Setting Up Wireless Dataloggers
· Page 57 Programming Wireless Dataloggers
· Page 61 Downloading Data From Wireless Dataloggers
· Page 64 Appendix – Required Stage Lines For Use With IPReports
3
TQ Soft and IP Reports Installation and Setup
IP Reports
1. Insert the IPReports CD, and when prompted select ‘Open Folder to View Files’. Right click
gs.exe and select ‘Run as Administrator’ to install. Follow instructions in the setup wizard;
default settings can be used.
2. Right click IPReports_1.4_Build0008_Install.exe and select "Run as Administrator"
The installation procedure is fairly standard with the exception of a printer installation screen
near the end; it will display a screen with a button titled "Setup Now - Click to start printer
setup." This printer installation should be skipped and performed later.
3. Insert the red dongle into a USB socket on your PC. If the dongle indicator LED doesn't
illuminate then locate and right-click on C:\ISL\IPReports\Tools\USB_Dongle\setupdrv.exe
and select "Run as Administrator" to install.
4. IMPORTANT! Right click the IPReports logo on the desktop, then choose ‘Run as
Administrator’. This will lock down the correct settings. Exit IPReports
5. Right click IPReports_1.4_Build0015_Update.exe on the CD and select "Run as
Administrator" to install.
6. Run IPReports once then exit.
7. Make sure that you have a .pdf reader on your computer, such as ‘Adobe Reader’ that can
be downloaded free from the ‘Adobe’ website.
8. Using windows explorer, locate and right click
C:\ISL\IPReports\Tools\IPReportWriterSetup.exe and select "Run as Administrator".
This installs a PDF printer that uses the ghostscript driver installed in step 1.
9. Open IPReports. Select edit->preferences then choose the IPReportWriter printer. Click
'Save' and then ‘Back’
TQ Soft
1. Insert the TQ Soft CD and follow the installation wizard, when prompted selecting C:/Logsys
as the install directory. Insert the TQSoft dongle into a free USB slot.
2. If the Dongle does not light up then locate the Dongle Driver in C:/logsys/Dongle Driver and
run the setup
Fluke NetDAQ
1. After install finishes, explore the TQSoft CD through My Computer, open fluke2680 Support
and then double click NTool32_DLL and run through setup wizard.
2. Change IP Address in Control Panel, Network and Sharing Centre, Change Adapter
Settings, right click on Local Area Network, properties, highlight Internet Protocol
Version 4 (IPV4), properties, change IP to: 198.178.246.100, and Subnet Mask to:
255.255.255.0, press OK and close out.
Serial Drivers (if using the Isopharm USB to Serial Converter) and general settings
1. Double click the CDM20824_Setup application to install the serial to USB convertor drivers
2. Go to Start>Control Panel>Device Manager>Ports to see which ports Windows has allocated
to the USB to Serial adapter. Note TQSoft requires these ports to be numbered 16 or lower.
3. Go back into Control Panel and then select Hardware and Sound, Power Options,
Change plan settings on current plan, and set both Turn off the Display and Put the
Computer to Sleep dropdowns to Never. This will prevent the Windows going into
hibernation during a test cycle.
TQSoft and IPReports are now ready to use. If you have any queries on the installation, please
contact Isopharm at 01709 525256 and choose the option for TQSoft/IPReports technical support.
Please note the user will also require full read/write access to the following folders on the C:\ drive as
well as all subfolders and files:
C:/Logsys
C:/ISL
They will also require full use of any USB slots available
4
Creating a New User in TQSoft
· Identify and double click on the TQSOFT icon on the computer screen.
· Go to the Setup menu in TQSoft and select ‘Edit Security’
· Type in each required User name and after each name is entered, press the Add to List Button.
· You will be asked if the new user should be given Administrator, Manager or Operator security
status. This affects which TQSoft settings the user can change, but can be amended later if required.
· The Audit Trail Reason for Change window will appear (Type in a reason if you wish) then press
OK.
· The New user is added to the Left Hand Side.
· Highlight the new User. The Password Age Limit option forces the user to reset their password after
the number of days set. If you do not wish to use this feature a maximum of 9999 can be entered.
Inactivity Timeout is turned off (00:00:00) by default. If TQSoft does not detect any button presses or
key presses for this amount of time, the password window will appear, and no other operations will be
allowed until the password, or a new ID and password are correctly entered. If a test is running,
TQSoft will run as normal, but a password must be entered to carry on after the test is completed.
· Highlight on the User on the left hand side. Then click on to Hardware/Setup/Test Spec/Tests to
select what the user highlighted can or cannot do in TQSoft. For example if you do not want the user
to have access to Edit Security (the area of the Software we are in now), un-tick the feature Edit
Security in the Setup Section
5
· Note To allow stage lines to be inserted while running a cycle, the ‘Stages’ ‘Real Time’ option needs
to be selected.
· Repeat this process for all users. Once completed press OK in the bottom right hand corner.
To complete the New User setup, select ‘Setup’ then ‘Enter Password’
6
· A Login box appears with a New User box. Select ‘New User’
· Click the dropdown, and a list of new users will appear. Select the correct account and press ‘Enter’
· Type in a new ID (username) and press ‘Enter’. Note that this is case sensitive.
· Repeat your ID to Confirm and press ‘Enter’
· Type in a Password (again case sensitive) and press ‘Enter’
· Repeat your Password to Confirm and press ‘Enter’
· Once the ‘Password Valid Until’ date appears press ‘Enter’ again.
· Now to go Setup and Edit Security again
· Highlight the ‘Demo’ user and then press ‘De-activate’. Then Press OK.
· You can renew you Password at any time, by highlighting on the name and use the Renew
Password tick box and press OK. You can also deactivate any user at any time.
· Close down TQSoft and re-open it. The login box will reappear.
· Type in your ID, then your Password to open TQSoft.
7
Company Name and General Setup Options
· Go to Set up and press on General Setup Options
· Type in the Company Name and this name will be printed out at the top of all the TQSoft
documentation such as Charts, Data Listings etc.
· Type in the Computer Name in the System ID, so the Audit Trail knows which PC has been
used for each application completed.
· Select the date Format below.
· If the option Store Cal, Cal Check, and Audit records with Test record in Company Name
and General Setup Options is on, then an audit database is created and managed for each
test record along with the other files for each test record. In this case the option Audit Trail
on the Current Test drop down menu can be used to view and manage these audit trails. It
also means that TQSoft will remember which Calibration and Calibration Check record is
associated with each test when you backup the data or complete a
Report.
· Audit Trail Archiving is covered in the Advanced Course.
8
Test Equipment
· Go to Setup and Test Equipment
· This area allows you to fill in details of all test equipment being used – multiple types can be
recorded, and the correct one selected at the start of each test.
· Highlight ‘Logger/Recorder’ and select ‘New’ at the bottom right of the box (or right click and select)
9
· A new datalogger called ‘New1’ will appear on the left. Highlight this, and the equipment details area
will show on the right. Complete this with the correct information, and then select ‘Save Changes’
· ’New1’ will now be replaced by the serial number and description of the new logger. Highlight this,
right click and choose ‘Select’ to mark this as the default datalogger for future tests.
· Continue this process for all relevant equipment, then Quit
10
Chamber Records (formerly ‘Machine Records’)
· Go to Setup and Edit Chamber Records.
· A box showing current sites will appear. Either select ‘Chamber’ then ‘New’ at the bottom right, or
right click ‘Chamber’ and select ‘New’
11
· You will be asked to enter a reference number for the new chamber. The default will start AC000xxx.
Isopharm would recommend changing this to either the serial number or some other recognisable
reference, as this reference will be used to refer to the chamber later.
· Enter the details for the chamber. The site name, when entered, will be used to group chambers on
the left side of the screen. Note that the Ref Code is greyed out and cannot be changed. Once this
has been done, select ‘Save Changes’
· If you have multiple chambers at the same site, you can highlight a chamber record that has already
been entered, then select ‘New’. This allows common details to be pre-filled for the new chamber.
12
Channel Configuration
· Each channel can be set to a wide range of input types depending on the application. The most
common of these is Type T thermocouple.
· Select Setup, then Edit Channel Configuration
· TQSoft v6 can support up to 128 channels, but most dataloggers have either 16 or 20. Each channel
that is to be used needs to be configured correctly.
· Select a Channel Configuration and give it a name of your choice. Universal Channel Configuration
is the default.
· Assuming the input will be from a thermocouple, select ‘Input T (0.01)’ or ‘Type T range 10mV’.
Ensure the units (e.g. °C) and decimal places are correct for your application. It is also possible to
change the Label (displayed on the chart), location and chart colour at this point. Once this is
complete, press ‘OK’
· If the Channel Type is changed, you will be asked if you wish to copy this configuration to all other
probes with a higher number. Select Yes if all the thermocouples will be of the same type and you
wish to do so
13
· Repeat for all other temperature channels by using the left and right arrows at the bottom
· To set up Pressure go to the last channel on your Datalogger (For Agilent is would be Channel 16,
For Fluke it would be Channel 20).
· Select the correct channel Type (for Agilent it would be +/-10V, for Fluke it would be 3V Range.
· Select the units required, and Decimal Places (this should be 0 if mB or mBA is used, 3 if Bar or BA
is used or 2 if KPa is used) and the chart colour of your choice. Press OK.
· Note You can create other devices such as Humidity etc. in exactly the same method as the
Pressure Channel by typing in the Units of your choice.
14
Test Specifications (Basic)
· Go to Setup and Edit Test Specifications.
· A list of all the Test Specifications appear, divided into Sterilising and Disinfection depending on the
type of test. To view or edit an existing Test Specification highlight it and click next or right click and
select ‘edit’
· To create a new Test Specification, press New. Note if you want to create a new Test Specification
that is very similar to an existing template (e.g. a 2nd Test Specification which is identical to the one
already created, except the Probe locations are in different positions), you can copy the existing
template, and then modify the new one. For example, if you want to use the ‘‘Porous Load 134C 3
probes’ Test Specification as the basis for the
new one, highlight it on the list, then press new. A message will then appear asking if you wish to use
this template as the basis for a new one.
15
· New Test Specifications are given a default name, for instance SY0022.pa2. Highlight this test, then
right click and select ‘Edit’
· The General area of the Test Specification allows you to edit a range of basic functions.
· Name is used to identify the test specification and should be changed to something easily
recognisable.
· Temperature Units and Pressure Units are specified for each test, but should match the Channel
Configuration.
· The scan interval is used to set the scan rate of the datalogger. It will be constant
throughout the test. This should usually be set to 1 second. The amount of data shown in the data list
can be modified elsewhere.
· Estimated Test duration is used only to size the chart for real time monitoring before the
test has started. (It resizes the chart automatically for you once the test is complete regardless of the
number entered here).
· Version and date of revision is a means of tracking modifications to test specifications.
· The thermocouple file specifies which set of calibration values will be activated and used
when the test is started (see advanced course). This will usually be Calibration Set 1 if you have a
single set of thermocouples calibrated.
· The channel configuration file is the channel configuration that will be loaded and used
once the test is started. Select the channel configuration file before selecting probes.
16
· Sterilising/Disinfection/Target temperature sorts the Test Specifications on the first screen. If the
box below marked ‘Stage Analysis’ is ticked, TQSoft will also automatically insert the correct Start and
End of stage markers when all probes are above the required temperature.
· The Use 24 hour clock option controls the format of time in the test record. If checked,
time will be stored as actual time of day, if unchecked time will be stored as 00:00:00 at the
start of the test.
· Auto stop logging after allows you to automatically switch off logging a set time after
a test has started. (NB Having this checked allows the continuous monitoring check box
to be used. This will have the effect that TQSoft will automatically re-start logging with the
next incremental test number available. Having continuous monitoring checked allows
the start new file at midnight option to be used.)
· Log off channel and log off temperature can be used to switch off logging when a
specified channel has exceeded and then drops below the specified value. (For Fluid load
type of cycles only- do NOT use on Porous Load cycles).
· The Data Listing button allows you to set parameters for the data listing
· Use Locations for Column headings is generally not ticked. It would say for example Drain
instead of Tmp1 depending on the settings in the Channel Configuration
· Print Stage Information should be ticked if you wish to see stage data in the Data Listing
· Landscape should be used if more than 13 columns are used.
17
· The Chart button allows you to set parameters for the Chart display
· To change the unit of the Chart select the units you want. For example if the temperature is
in °C, then select these units and then enter the Maximum and Minimum Temperature
Values required for the temperature axis
· If non-standard units are required, for example Humidity, you can type RH% into
the units and then add your scale and this will be entered onto your chart (on the right hand
side)
· The Probes area allows you to specify a location for each probe.
· Click on Select Probes and select the channels required by checking the box, then press ‘OK’
18
· Type in the Location for each probe and press ‘Enter’.
·For IPReports to perform some automatic thermometric analysis for you, specific naming
conventions should be used - note this is only important for Autoclave Testing.
· Chamber Pressure Sensor PRESSURE
· Drain/Vent Sensor DRAIN or VENT or DISCHARGE
· Chamber Free Space Sensor FREESPACE
· Test Pack Sensor PACK or LOAD
· Top Pack Sensor (Top Sheet) TOPSHEET
· Bottom Pack Sensor BOTTOM
· Water Reservoir Sensor RESERVOIR
·The Calculations area allows TQSoft to perform a range of automatic calculations on the data and
show these on the chart and/or data list. These are Scan Calculations (as opposed to Interval
Calculations or I-Calcs.) and therefore are a calculation performed on each
scan of data from the datalogger.
· Tick the boxes if you want these calculations to be added to your Chart and Data
Listing. If they are to be displayed on the chart you can choose the colour from the box here)
· Max Temp Channel and Min Temp Channel are good information for the hottest and
Coldest Channels for Washer Disinfectors.
· TQSoft includes Saturated Steam Tables. From these tables it can calculate the Theoretical
Saturated Pressure from a given temperature, or visa-versa (i.e. what the Theoretical temperature
from the Pressure reading assuming the steam was 100% saturated).
· For readings on the Theoretical Saturation Pressure from any given temperature click on
the Saturation Pressure box (Data List as shown above) and select which temp channel to
do the calculations from (usually the drain probe).
· For readings on the Theoretical Saturation Temperature from the given pressure click on
the Saturation Temperature box (Data List) and select which pressure channel to do the
calculations from.
19
·The Lethality area is covered in more detail in the Advanced Training Course. This allows either
F(0), A(0) or a custom lethality calculation to be displayed on the chart and/or data list from any or all
probes.
· The Stages area controls which Stage Lines will be available from the ‘Enter Stages’ button while a
cycle is being logged using this Test Specification. Note that all Stage Lines are available once a
cycle is complete.
· To add or remove stage lines, press ‘Select Stages’
· To delete a stage from this Test Specification, simply highlight it on the right hand side and press
‘Delete’. If a stage is deleted by mistake, it can simply be added again.
20
· To add a stage line to the Test Specification from the library on the left, highlight the required stage
on the left and the stage on the right which will follow it, then press ‘Insert. In this example ‘Leak Test
Start’ will be inserted between ‘Cycle Started’ and ‘negative Pulsing’
· By highlighting a stage, then selecting ‘Edit’ it is possible to change the Display Interval for the
stage. This controls how frequently data is displayed on the Data List while in Summary mode. Either
enter the required Interval directly, or use the arrow buttons to increase/decrease the timer. Once this
is correct press ‘OK’
·Note editing the Interval on the left side changes the Interval in the stage library, while editing the
Interval on the right will affect this Test Specification ONLY and the Interval in the library will remain
the same.
21
I-Calcs List This is covered in the Advanced Training Course (except Chart Line)
· This section of the Test Specification allows you to insert a line on the chart to indicate your Lower,
Upper and SuperHeat Limits.
· Highlight Default Sterilisation Limits 1, then select ‘I-Calc Specs’
· Enter Start Stage as Cycle Started and End Stage as Cycle Complete
· Click on Limit Values
· Enter your Upper and Limit values. For example for a 134C Porous Load, type in 134 for
the lower limit, 137 as the upper limit and °C as the Units. The line colour can also be selected here.
· Press on I Calcs List again and select Super Heat Limit
· If this is not required (e.g. for a Washer Disinfector), press ‘Delete’, otherwise follow the same
procedure again, entering the appropriate Super Heat temperature (e.g. 142°C for a 134°C Porous
Load cycle)
I-Calcs Specs This is covered in the Advanced Training Course (except Chart Line).
22
Setting Up the Agilent Logger
· Using the Agilent front panel, configure the data output as follows
· Press
together
· Select the RS-232 interface using rotary selector (not GPIB).
· Press
· Set 9600 as the baud rate
· Press
· Set the parity and number of data bits as None (8 data bits)
· Press
· Set the flow control method to None
· Save changes and Exit.
· Open TQSoft go to Logger and Select Logger
· Find Agilent 34970A from the drop down menu
· TQSoft will automatically set the correct Baud Rate, Databits and Parity
23
· Select the correct Comms Port from the dropdown menu and Press OK.
· Note In this example Com 1 is used, but this will vary depending on your PC. It is important that the
Com port used is number 16 or below.
· Select the correct Channel Configuration and press OK.
24
Setting Up the Fluke NetDAQ Logger
· Connect the NetDAQ to the PC using the Ethernet cable, then power on the NetDAQ. The PC now
requires configuring to communicate correctly.
· Insert the TQSoft CD, then ‘Open folder to view files’ when prompted
· Double Click on the Fluke 2680 Folder
· Double Click on the NTool32.dll file to install the Fluke NetDAQ drivers and follow the installation
instructions.
· When this is complete, press Finish
· Press the Start button and then open Control Panel
· Select ‘Network and Internet’
25
· Select ‘Network and Sharing Center’
· Select ‘Local Area Connection’
· Select ‘Properties’
26
· Highlight ‘Internet Protocol Version 4 (TCP/IPv4) and then select ‘Properties’
· Select ‘Use the following IP address’ and enter 198.178.246.100 as the IP address and
255.255.255.0 as the Subnet Mask.
· Press OK, then OK again (at Internet Protocol window) and then close Network
Connections.
27
· Go to TQSoft and then Press Logger and then Select Type of Logger
· Select on Fluke NetDAQ. TQSoft will automatically select the correct IP address and settings
· Press ‘OK’ and connection will be confirmed.
· Select the correct Channel Configuration and press OK.
28
· The Test Equipment Window will now open – check that the correct details are entered here and the
correct logger is selected, then press ‘Quit’
· Note If the PC is connected to the internet through the Ethernet cable at any point, Windows will
automatically attempt to create a working connection for you. This may lead to the IP settings being
changed back to ‘Obtain an IP address automatically’ and preventing communication with the
NetDAQ. In this case, simply follow the steps above to reconfigure the IP address to the correct
settings.
29
Calibrating Thermocouples
Calibration of a thermocouple requires at least three temperature points. These should be the lowest
and highest temperatures likely to be relevant to a test, and a checkpoint between these to ensure
that all parameters are met across the whole temperature band.
This calibration data will be used for all tests performed using this calibration file until another
calibration is performed. You will require a suitable temperature calibrator or thermal bath, and,
depending on the guidelines to which you are working, you may also require an independent
reference probe.
TQSoft is capable of communicating with a wide range of temperature baths and thermometers. This
allows TQSoft to drive the unit, controlling the temperature without requiring a manual input. If this is
coupled with a temperature reference probe that also communicates with TQSoft it also allows
automatic calibration of thermocouples, removing the need to enter or accept settings at each stage
and allowing other work to be undertaken while calibration takes place.
Setting up the Thermal Heat Source in TQSoft (if required)
·Select ‘Thermal Bath’ and then ‘Select type of Thermal Bath’
· Select the correct bath type from the dropdown menu. For example for a Jofra CTC320 select
‘JOFRA CTC/ITC/MTC’. TQSoft will select the correct Baud Rate, Data Bits and Parity automatically.
· Select the correct Comms port and press OK. Note The Comms port must be numbered 16 or
below.
· To check communications are working correctly, select ‘Thermal Bath’ and ‘Thermal Bath
Control’. Ensure a temperature reading from the thermal bath is showing, then enter a setpoint value,
send it to the bath and check that the bath changes temperature.
30
Setting up the Temperature Reference in TQSoft
· Select ‘Temperature Ref’ and press Select type of Reference Probe.
· Select the correct Reference Probe from the dropdown menu, for example Jofra DTI 50 -TQSoft will
select the correct Baud Rate, Data Bits and Parity automatically.
· Select the correct Comms port and press OK. Note The Comms port must be numbered 16 or
below.
· To check communications are working correctly, select ‘Temperature Ref’ and ‘Reference Probe
Control’. Ensure a temperature reading from the Reference Probe is showing
31
Temperature Calibration (Automatic)
· Click on ‘Logger’ and then ‘Calibration’ in the drop down menu.
· Type a suitable name in the ‘Job Reference’ box. The calibration file should usually be left as the
default. Note The Operator name, time and date are taken from the computer settings, and are not
editable - these should be checked before continuing. Select ‘OK’
· Select which thermocouple you wish to calibrate and turn OFF the Pressure Channel, then press
‘OK’
· Enter the required setpoints and stability parameters. The example below shows the standard
parameters used, along with usual checkpoints for an autoclave.
32
· For Automatic Calibration, ensure sure the ‘Calibration’, ‘Automatic’ and ‘Use Temperature
Reference’ options are selected, then press ‘OK’. If there is no communication between the
equipment and TQSoft, the ‘Automatic’ option will be greyed out, and calibration should be performed
manually – this is discussed further in the next section.
· TQSoft now automatically checks the stability of all the thermocouples and the reference
probe.
· ALL probes selected for calibration must achieve the stability criteria, here for example it
is 0.2 degrees for 2 minutes
· The allowed deviation from Reference is applied as soon as the calibration is calculated.
If the difference between any uncalibrated probe value, and the reference value, is
greater than this figure, then the probe is labelled as a BAD probe in the calibration
report and should not be used. The allowed deviation is applied at both the Low and High points.
· The reference stability criteria is simply the biggest drift allowed for the reference value
over one minute. A countdown is provided for this too, and is reset as soon as the
reference value drifts too far. If entered set points are being used as reference
values then this criteria is irrelevant.
· Once stability has been met, TQSoft then calibrates all thermocouples at the same time
and then carries out the tracking run.
· The report duration and interval are used to generate a (post calibration) report on the
calibrated values after High and Low point calibrations. The report max. deviation
allowed is a limit on the difference between each channel’s value and the reference
value during the report interval (i.e. after the probe has been calibrated). If the
difference is exceeded the channel will have a FAIL notice appear in the calibration
report results section.
· After the reporting is completed, TQSoft then sends a command to the thermal bath to
go to the next set point temperature, and the process is repeated.
33
· Once calibration has been completed on all setpoints, a new screen will appear to allow you to view
a preview of the calibration report.
· Once you have viewed the calibration report, press ‘OK’. A prompt will appear asking if calibration is
now complete. If you require pressure, it is important to select ‘No’ and proceed to pressure
calibration – this allows both sets of calibration data to appear on the same document.
· Note If you are using IPReports it is unnecessary to print the calibration report, as this can be
imported automatically into your completed Validation Report.
34
Temperature Calibration (Manual)
If there is no communication between available between TQSoft and your temperature bath and/or
reference probe, information about each stage of calibration should be entered manually.
· Click on ‘Logger’ and then ‘Calibration’ in the drop down menu.
· Type a suitable name in the ‘Job Reference’ box. The calibration file should usually be left as the
default. Note The Operator name, time and date are taken from the computer settings, and are not
editable - these should be checked before continuing. Select ‘OK’
· Select which thermocouple you wish to calibrate and turn OFF the Pressure Channel, then press
‘OK’
35
· Enter the required setpoints and stability parameters. The example below shows the standard
parameters used, along with usual checkpoints for an autoclave.
· Ensure the ‘Calibration’ option is checked, then press ‘OK’
· TQSoft now automatically checks the stability of all the thermocouples and the reference probe at
the first calibration point
· ALL probes selected for calibration must achieve the stability criteria, here for example it
is 0.2 degrees for 2 minutes. Once stability is achieved, a countdown will start. It is important to wait
for this to reach zero.
· The reference stability criteria is simply the biggest drift allowed for the reference value
over one minute. A countdown is provided for this too, and is reset as soon as the
reference value drifts too far. If entered set points are being used as reference
values then this criteria is irrelevant.
· Once both countdowns have reached zero, enter the reading from the Reference, and press
‘Proceed’
· The allowed deviation from Reference is applied as soon as the calibration is calculated.
If the difference between any uncalibrated probe value, and the reference value, is
greater than this figure, then the probe is labelled as a BAD probe in the calibration
report and should not be used. The allowed deviation is applied at both the Low and High points.
36
· TQSoft will now perform a tracking run for the time previously specified. During this period the
(uncalibrated) deviation from the reference will be displayed at the specified interval. Each probe can
be viewed individually by selecting it from the dropdown on the left.
·Once the Report timer has counted down to zero, TQSoft will automatically begin calibration at the
next setpoint. The Temperature bath should now be set to this temperature. Once stability is
achieved, the same procedure can be followed, again entering the reading from the Reference and
pressing proceed when the countdowns have reached zero.
.
· A second tracking run report will run, and then TQSoft will move to the Calibration Check Point.
· At this stage the thermocouples have now been adjusted to take into account any temperature
variation between the Reference and measured temperature. Adjust the Temperature bath to the
correct temperature and wait for the temperature to stabilise.
· Again, enter the correct reading from the Reference – as the thermocouples are now calibrated this
is now simply a check to ensure that they are within the required parameters. Once the stability
countdowns have both reached zero, press ‘Proceed’ to enter the final tracking report.
37
· Once calibration has been completed on all setpoints, a new screen will appear to allow you to view
a preview of the calibration report.
· Once you have viewed the calibration report, press ‘OK’. A prompt will appear asking if calibration is
now complete. If you require pressure, it is important to select ‘No’ and proceed to pressure
calibration – this allows both sets of calibration data to appear on the same document.
· Note If you are using IPReports it is unnecessary to print the calibration report, as this can be
imported automatically into your completed Validation Report.
38
Pressure Calibration
Calibration of a pressure transducer requires measurement at at least three pressure points. These
should be the lowest and highest pressure likely to be relevant to a test, and a checkpoint between
these to ensure that all parameters are met across the whole pressure band.
This calibration data will be used for all tests performed using this calibration file until another
calibration is performed. You will require a suitable pressure transducer and pressure reference unit.
· Click on ‘Logger’ and then ‘Calibration’ in the drop down menu.
· Type a suitable name in the ‘Job Reference’ box. The calibration file should usually be left as the
default. Note The Operator name, time and date are taken from the computer settings, and are not
editable - these should be checked before continuing. Select ‘OK’
· Click OK, then deselect all the temperature channels and select the pressure channel.
· Note In this example we are using millibar. If you are different units ensure you select accordingly.
39
· Standard pressure set points are as follows: - Low point 500, High point 3500, Check
point 3200. (All in millibar absolute). Ensure the ‘Do low first’ and ‘Calibration’ options are selected.
· For the low point of 500, select vacuum on the pressure calibrator and use the pump to apply 500
mBA. Once the reading is stable press PROCEED and wait for approximately 10 seconds while
TQSoft performs the required calculations. Note the values displayed in TQSoft for both the Low point
and High point are both Voltage readings NOT pressure readings.
· Select pressure on the pressure calibrator and use the pump to apply 3500 mBA. Once stable again
press PROCEED and wait approximately 10 seconds while TQSoft performs the required
calculations.
40
· Repeat the procedure for the Check Point (3200 mBA). Note that the displayed reading in TQSoft
has now converted to Pressure Units as TQSoft has worked out the conversion.
· When ‘View Calibration Records from’ is displayed with a new date/time/group click on
print preview to preview a copy of your pressure calibration report.
· Once calibration has been completed on all setpoints, a new screen will appear to allow you to view
a preview of the calibration report.
· Once you have viewed the calibration report, press ‘OK’. A prompt will appear asking if calibration is
now complete
· Note If you are using IPReports it is unnecessary to print the calibration report, as this can be
imported automatically into your completed Validation Report.
41
Performing a Test
· Click the ‘Start Logging’ button
· Select the correct chamber from the dropdown (e.g. which machine is being tested)
· Enter the correct cycle number for the cycle about to be run. Note TQSoft does not allow you to
enter the same cycle number twice for the same chamber
· Select an appropriate Test Specification and click ‘Next’
42
· Enter an appropriate Job Reference, then press ‘Next’. A reference to the type of test is useful (e.g.
‘ACT’ or ‘Thermometric Test 1’ when looking for data from this test at a later date.
·The ‘Start Logging’ button now appears. The timer below can be used to delay the start of logging if
required.
· When you are ready to start the cycle, click ‘Start Logging’. Note Logging should always be started
using TQSoft before the cycle begins to ensure no data is lost.
· Now the test has started, select Inputs Display and watch the cycle appear on the chart.
Entering Stage Lines While Logging
· Stage lines can be entered either whilst logging a cycle, or once the cycle has completed. However,
entering stage lines into TQSoft in real time removes the need to manually record machine stages
using a separate stopwatch and notepad.
· When the machine reaches the start of a new stage, select the ‘Enter Stage’ button
· A box will be displayed, and the next stage line programmed into the Test Specification will be
automatically selected, along with the time at which ‘Enter Stage’ was pressed. If this is correct press
‘OK’
43
· If you wish to select a different stage line select the correct one from the dropdown.
· If the time is incorrect (e.g the button was not pressed at the correct time), it can also be amended
here.
· Note If a stage is missed, or you wish to insert them after the test has finished, a full choice of all
possible stage lines is available once the cycle is complete.
· The Stage line will now appear on both the Chart and Data List
· This can now be repeated for all the other Stages. Please see the Appendix to see what
Stages need to be inserted into the test for different types of Cycles for templates to
work correctly in IPReports.
· Once inserted, stage lines can also be moved manually by hovering the mouse over the required
line, and then clicking and dragging using the ‘Values at Pointer’ reading to drop it at the correct time
· Once the machine has completed the cycle, press the ‘Stop Logging’ button. A confirmation that you
really wish to stop is then required.
· The Chart will be resized to fill the entire screen, regardless of the original x-axis parameters.
44
Viewing the Data List
· To view the datalist either during a cycle or for a historic test, select the ‘Data Listing’ button
· The datalist for the current cycle will be displayed.
· Full data (i.e. all scans recorded) or Summary data (based on the time intervals selected through the
Stage Line) can be selected.
45
Entering Stage Lines After Completing a Cycle
· Once a cycle is complete (or an older cycle has been selected through the Historic Tests menu),
press the ‘Chart Display button to bring up the graph.
· Press ‘Enter Stage’ and a list of all possible stages will appear (on the left), along with all stages
entered for this cycle (on the right).
· Highlight the required Stage from the list on the left, and press ‘Insert’
· Enter the correct time (using the format hh:mm:ss) and press ‘OK’
· As well as showing the time and temperature at the pointer position, the Chart Toolbar can also be
used to zoom in to a specific area of the graph, create a blank stage line, and edit the frequency at
which the line labels are displayed on the chart.
46
Calibration Checking (Validation)
Once a test is complete, the equipment used should have its calibration checked to ensure that it is
still within the required parameters. Thermocouples should be placed in the same holes as for
Calibration to improve accuracy.
· Click on ‘Logger’ and then ‘Calibration Checking (Validation)’ in the drop down
menu.
· Enter a suitable job reference and ensure the Calibration File is the same as that used for the test,
then press ‘OK’
· Select the correct channels and press 'OK'
· Enter a suitable check point and stability parameters. Note These should normally be the same as
the check point used for Calibration.
· Ensure the ‘Calibration Check’ option is selected, as well as the ‘Automatic’ if required, and press
‘OK’
47
· Follow the same procedure as Calibration (see above). For a Calibration Check, however, no low
and high point calculations are carried out – the check is simply to ensure that no significant drift has
occurred since the calibration was carried out.
· When TQSoft prompts you to say if you have finished checking calibration, select ‘No’ if you wish to
carry out a calibration check for pressure.
· Press OK
· When ‘View Calibration Records from’ is displayed with a new date/time/group click on
print preview to-preview a copy of your temperature calibration check report.
48
Pressure Calibration Check
· Click on ‘Logger’ and then ‘Calibration Checking (Validation)’ in the drop down
menu.
· Enter a suitable job reference and ensure the Calibration File is the same as that used for the test,
then press ‘OK’
· Select the correct pressure channel and press 'OK'
· Enter a suitable check point. Note This should normally be the same as the check point used for
Calibration.
· Ensure the ‘Calibration Check’ option is selected and press ‘OK’
49
· For the check point of 3200, select pressure on the pressure calibrator and use the pump to apply
3200 mBA. Once stable press PROCEED and wait for approx 10 seconds.
· TQSoft will ask have you finished Calibration Checking. Press Yes.
· Press OK
· When ‘View Calibration Records from’ is displayed with a new date/time/group click on
print preview-to-preview a copy of your pressure calibration check report.
Once a Calibration Check has been performed, the test is complete.
A new test can either be performed, or you can move on to IPReports.
50
The Current Test Menu
· After the Test is completed the cycle number of the test appears next to the Current Test
Menu. By clicking on the Current Test Menu a number of options are available
· Test Audit Trail. The Test Audit Trail shows the Audit Trail that is created when the test is started,
but is only associated with this test. When the Test is backed up the Test Audit Trail if requested (see
Company Name and General set up options) is also backed up so this audit trail follows the test
around and is added to no matter which computer you are working from.
· Test Report Print/Preview This allows usual information about the Test such as Machine
Details, Channel Configurations etc. to be printed out (this may also be imported into IPReports later)
· Test Details. Test Details shows Test Specification information specific to this Test. Once a test is
completed, critical information such as the cycle number, machine name, date and time cannot be
changed and are greyed out. However, non-critical details can be changed.
· In the General section for example, the Sterilisation temperature can be changed to Disinfector or
Target Temperature. The Data Listing or Chart can also be reconfigured
· In the Calculations section all options can be selected or deselected.
· In the Probes section locations of probes can be renamed.
· In the I-calcs section new I-calcs can be created and applied
· Chamber allows basic details (but not test critical ones) to be amended
· Calibration Report and Calibration Check Report allow these to be viewed at any time
· Channel Configuration allows the chart label and colour to be amended
· Stages performs the same function as pressing the ‘Stages’ button (see above)
51
· Defective Probes. If a probe goes open circuit or is redundant (e.g. a duplicate), this can be marked
as ‘Defective’. This removes the probe from the chart, data list and all calculations. Note this does not
delete any data, so the probe can be removed from the ‘Defective’ list at any point.
.
· Analyse Test. If any changes are made that affect calculations made on the data (for example in
the lethality settings), the test should be reanalysed. Select ‘Analyse Test’ and all calculations will be
refreshed.
· Crop Data. Selecting ‘Crop Data’ gives two options
· Crop on Cycle Start Cycle Complete removes unwanted data from your test results. This
is particularly useful if a delayed start is used, or for very long cycles that may be left running
unattended.
· Crop and Split after Cycle Complete removes data recorded after the Cycle Complete
stage line, moving it to a new file which can be accessed through the Historic Tests menu. The same
file name is used with the additional suffix _s1. Multiple splits can be performed on the same test by
moving the ‘Cycle complete’ stage line – the suffix will then reflect this by using _s2, _s3 etc.
52
Historic Tests
· After a test is completed it is automatically added to the Historic Tests folder.
· Press the ‘Historic Tests’ button
· A menu will be displayed showing all tests in the selected location on your PC
· To filter these results, or change the heading selection, press ‘Configure’. From this menu a different
source file can be selected, and headings can be selected as either ‘Shown’ or ‘Hidden’.
· Note For IPReports to import data, the ‘File Name’ header must be in the ‘Shown’ column. Double
click the header name to move it from one column to the other.
· To view a previously run test, either double click the required cycle or select it and then press ‘OK’
· The cycle number will appear next to the ‘Current Test’ menu at the top of the page. To view
information on this cycle, use the ‘Chart’ and ‘Data List’ buttons, or select ‘Current Test’ to view the
entire menu.
53
Data Management (Migrating to a new PC)
On the old PC
· Insert a memory stick into an available port
· Select ‘Data Management’, then ‘General’
· Select the correct drive for the memory stick on the right side
· Select ‘Configuration Files’
· Choose which files you wish to copy across
54
Basic Settings – which logger, heat bath is set to default etc.
Channel Configurations - including labels etc.
Security Settings – user IDs and passwords
Calibration Files – historic calibration data
Chamber Records – copies chamber records (but not historic data)
Test Specifications – including any user defined Test Specs
· Press OK. A folder called ‘Logsys will be created on your memory stick.
· Safely eject the memory stick from the first PC, and insert it into a spare slot on the destination PC
· Copy the Logsys folder from your memory card and paste into your C:/ drive. When warned that a
file with this name already exists, choose ‘Copy & Replace’
55
Setting Up Wireless Loggers In TQS v6
·
Install the Madgetech driver by running the ‘PreInstaller.exe’ application supplied (found in the
‘USB’ folder)
·
Open TQSoft and select ‘Logger’, then ‘Select type of Logger/Recorder
·
From the dropdown box, select ‘Battery Loggers (Madgetech, TMI, Gemini), ensure ‘Madgetech’
is ticket, then ‘OK’
The ‘Start Logging’ button will be replaced with a new icon. Please see ‘Programming Wireless
Dataloggers’ for more information on performing a test.
56
Programming wireless dataloggers through TQS v6
· Select the Wireless Logger button
·Select ‘Start Logging’
57
· Select the correct chamber from the dropdown menu (previously set up through ‘Chamber Records’,
and ensure the cycle number is correct, then press ‘Next’
· Select the correct test specification, then press ‘Next
· Enter a suitable Job Reference, then press ‘OK’
58
· Highlight the logger in the USB cradle (showing the green tick). Drag and drop into the required
location on the left.
· Set the start time as required, then press ‘Program’ to send this information to the logger
· Put the next logger in the cradle and repeat steps 5 and 6.
59
· Repeat steps 5 and 6 until all loggers have been programmed and allocated to a location, then
press ‘OK’
Red indicates this logger has been
placed in the cradle, but not
programmed
Green indicates this logger has been
programmed successfully
Tick indicates this logger is currently
in the USB cradle
Indicates which logger has been
assigned to this location
· The screen will revert back to the TQSoft home screen. Your loggers are now programmed and
ready to put into the chamber. Logging will start at the time specified, so ensure that the cycle is
started after this.
60
Downloading data from wireless loggers through TQS v6
· Select the Wireless Logger button
· Select ‘Download Tests’
· Highlight the test you wish to download. This will also show you which loggers have been allocated
to this test. If you have started multiple tests with different loggers, these will all show on the left
column. Click ‘Next’
61
· Highlight the connected logger (shown in bold type), and select ‘Download’
· Change the logger in the USB cradle and repeat the process until all loggers show the green
‘Downloaded’ arrow, then press ‘OK’ to collate the data from all loggers.
62
· You can now display the chart or datalist in TQSoft by selecting the ‘Chart Display’ or ‘Data Listing’
button as normal, and enter any required stage lines using the ‘Enter Stage’ button.
63
APPENDIX – Required stage lines for use in IPReports
· For all Sterilisers, the Verification of Calibration Stage is optional.
For Porous Load the following Stages must be used
· Cycle Started
· Negative Pulsing
· Positive Pulsing
· Heat Up
· Equilibration Start
· Sterilisation Start
· Machine Sterilisation Start
· Machine Sterilisation End (Drying)
· Sterilisation End
· Air Admission
· Cycle Complete
For Fluid Load the following stages must be used
· Cycle Started
· Free Steaming
· Heat Up
· Equilibration Start
· Sterilisation Start
· Machine Sterilisation Start
· Machine Sterilisation End (Cooling)
· Sterilisation End
· Vent
· Cycle Complete
For Laboratory Loads the following stages must be used
· Cycle Started
· Negative Pulsing (if applicable)
· Positive Pulsing (if applicable)
· Free Steaming (if applicable)
· Equilibration Start
· Sterilisation Start
· Machine Sterilisation Start
· Machine Sterilisation End (Cooling/Drying)
· Sterilisation End
· Air Admission
For N Type Autoclaves the following stages must be used
· Heat Up
· Equilibration Start
· Sterilisation Start
· Machine Sterilisation Start
· Machine Sterilisation End (Condensing)
· Sterilisation End
· Cycle Complete
For B Type Autoclaves the following stages must be used.
· Cycle Started
· Start Pulsing
· Heat Up
· Equilibration Start
· Sterilisation Start
· Machine Sterilisation Start
· Machine Sterilisation End (Condensing)
· Sterilisation End
· Drying
· Cycle Complete
64
For Washer Disinfectors the following stages must be used
· Cycle Started
· Disinfection Start
· Machine Disinfection Start
· Machine Disinfection End
· Disinfection End
· Cycle Complete
For LTS the following Stages must be used
· Cycle Started
· Leak Rate
· Negative Pulsing
· Heat Up
· Sterilisation Start
· Machine Sterilisation Start
· Machine Sterilisation End (Drying)
· Sterilisation End
· Air Admission· Cycle Complete
65


![CCM-LX [103-115108-02] for LW555](http://vs1.manualzilla.com/store/data/005891713_1-94f177118b12f5e24f93c1321ff002cf-150x150.png)