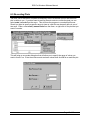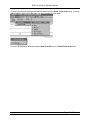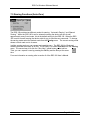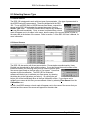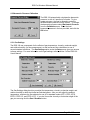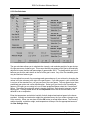
1
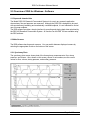
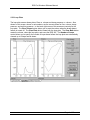
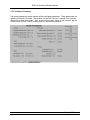
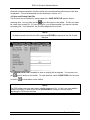
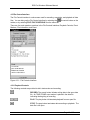
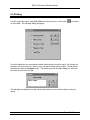
RSS for Windows® Software User’s Manual Research Pneumotach System January 21, 1999 Catalog No. 2000-10 Copyright 1997 KORR Medical Technologies Inc. Salt Lake City, Utah, U.S.A. 84109 All rights reserved. No part of this manual may be reproduced without the written permission of KORR Medical Technologies Inc. RSS For Windows Software Manual NOTE: Intended Use The RSS 100 Research Pneumotach System (and associated software) is for Research Purposes Only. It is not intended for clinical use on human subjects. Do not base clinical decisions on information from the research device. Technical Assistance Technical support for the RSS 100 for Windows software may be reached by calling KORR Medical Technologies, Inc. at (801) 483-2080, or by sending email to [email protected]. Technical support is available between 9 AM and 4 PM MST, Monday through Friday. Software Customization Services Since every researcher’s data collection needs are different, we provide a service for customizing the RSS for Windows software to your specific needs. KORR Medical Technologies specializes in innovative solutions to complex physiological monitoring problems. KORR Researchers, along with an excellent engineering staff provides a range of services from basic research to product development. Last Revised: 01/27/99 DOC000X Rev A Page 1 of 25 RSS For Windows Software Manual 1.0 Getting Started The Model RSS 100 Research Pneumotach System is for use in any research application where airway flow and pressure are measured. Although the RSS 100 is designed to be used with spontaneously breathing and mechanically ventilated subjects, it is not intended for clinical use on human subjects. Information from this research device should not be used as the basis for clinical decisions. The RSS 100 Research Pneumotach System measures gas flow using the differential-pressure method. As gas flows through the pneumotach, the microprocessor-based system converts the measured differential pressure to volumetric flow rate. Flow and pressure measurements are used to calculate several ventilator management parameters such as respiratory rate, lung compliance, tidal volume, minute volume, positive end expiratory pressure, etc. 1.1 • • • System Requirements 486x33MHz based PC or Higher Microsoft Windows 3.1 or later 8Mb of RAM recommended On slower computers the RSS software may not be able to display the real-time waveform data. If you are using a slower computer than recommended and a problem occurs, select "Parameters Only" from the Communications menu. The RSS software plotting (chart) functions have been optimized to work on the slowest computers possible. 1.2 Connecting to the RSS 100 The RSS 100 uses a standard 9 pin serial cable to connect to a PC. Simply, plug a serial cable into the RS232 port on the back of the RSS 100 and into a serial port on your PC (COMM1 or COMM 2). See Section 3.0 for more information on serial communications. 1.3 Installing the Software Turn on your PC and start Microsoft Windows. Insert the RSS 100 for Windows disk into a 3.25” disk drive on your PC. Select Run from the File Menu under Microsoft Widows 3.1. Select Run from the Start menu under Microsoft Windows 95. When the Run dialog box shows type in a:\setup, if the disk drive that you inserted the RSS 100 for Windows disk into is not “a:” then substitute its drive designation for “a:”. Click Ok. The Installation program for RSS 100 for Windows asks you several questions, before installing the program. You are given the option to specify where you want the program installed on your computer. If you are installing over a previous version of this software you will be asked where to back up old copies of your files. Also, you are asked where to put the icons for the RSS 100 for Windows program. Simply follow the instructions given by the installation program. If no changes are made to the default installation options RSS 100 for Windows will be installed to C:\RSS_WIN, and the shortcuts to the program will in the RSS 100 for Windows group. Last Revised: 01/27/99 DOC000X Rev A Page 2 of 25 RSS For Windows Software Manual 2.0 Overview of RSS for Windows Software 2.1 Purpose & Intended Use The Model RSS 100 Research Pneumotach System is for use in any research application where airway flow and pressure are measured. Although the RSS 100 is designed to be used with spontaneously breathing and mechanically ventilated subjects, it is not intended for clinical use on human subjects. The RSS software provides a simple interface for recording and playing back data calculated by the RSS 100 Research Pneumotach System. All functions on the RSS 100 are available using the RSS software. 2.2 Main Screens The RSS software has three main screens. You may switch between displayed screens by selecting the appropriate file tab on the bottom of the screen. 2.2.1 Synchrony Plots The synchrony plots screen shows plots of the three primary measurements: flow, airway pressure, and volume. Also, shown on this screen, shown in red numbers, are the current values for flow, volume, airway pressure, and auxiliary pressure. Last Revised: 01/27/99 DOC000X Rev A Page 3 of 25 RSS For Windows Software Manual 2.2.2 Loop Plots The loop plots screen shows plots of flow vs. volume and airway pressure vs. volume. Also, shown on this screen, shown in red numbers, are the current values for flow, volume, airway pressure, and auxiliary pressure. In the lower right corner of this screen are controls for the loop plots. The Clear Volume button allows you to reset the volume when the breath detect feature is turned off. The Clear Plots button clears both the loop plots. The Clear Both button resets the volume, clears the loop plots, and zeros the RSS 100. The Number of Loops control allows you to specify the number of loops drawn before the loop plots are automatically cleared, up to 4 loops can be drawn. Last Revised: 01/27/99 DOC000X Rev A Page 4 of 25 RSS For Windows Software Manual 2.2.3 Ventilator Parameters The breath parameters screen displays all the calculated parameters. These parameters are updated at the end of a breath. See section 3 of the RSS 100 user’s manual for a complete description of these parameters. Also, shown on this screen, shown in red numbers, are the current values for flow, volume, airway pressure, and auxiliary pressure. Last Revised: 01/27/99 DOC000X Rev A Page 5 of 25 RSS For Windows Software Manual 2.3 Toolbar Description The toolbar is provided for both convenience and speed. It provides a quick and easy way to call often used functions. A description of the buttons and their functions follows. Save to file button: This button calls up the ”save as” dialog and allows you to begin saving your data to a file. If a file is already open this button is disabled. Open file button: This button calls the “open file” dialog that allows you to begin reviewing a file. If a file is already open this button is disabled. Close file button: This button closes any open data files. If no file is open then this button is disabled Print button: This button gives you quick access to the print functions. Click this and the printer dialog appears. File controls button: This button calls up the “file controls” dialog. See section 4.0, Data and File Handling. Zero now button: This button forces the RSS 100 unit to zero immediately. See section 7.0 Zeroing. Re-scale button: This button forces all the plots to automatically re-scale immediately, rather than wait for the the auto scale to rescale them. Flow calibration button: This button gives you quick access to the RSS 100’s calibration features. See section 9.0 Calibration features. Breath Detection ON/OFF: This button toggles the breath detection on and off. Breath Detection Flow Threshold: This button brings up a dialog box for entering the breath detection flow threshold. Refer to section 10 of this software manual for more details. Help button: This button calls up the RSS 100 for Windows help file. Last Revised: 01/27/99 DOC000X Rev A Page 6 of 25 RSS For Windows Software Manual 2.4 Status Bar The status bar is provided give the user access to information at a glance. There are three boxes of information provided by the status bar. The panel on the far right displays the name of the currently selected sensor. The panel in the middle displays the current zeroing mode, either Automatic or Manual. The panel on the left displays the current mode that the RSS 100 is in. One of three messages is displayed here. “ZEROING” is shown while the RSS 100 is zeroing. “CALIBRATION” is displayed while the RSS 100 is in calibration mode. When the RSS 100 is in normal mode this panel displays the name of the file currently open, for either playback or recording. If no file is open this panel appear as above. 2.5 Pull-down Menus Like all Windows programs the RSS 100 for Windows provides you with a menu for easy access to the program’s functions. A brief description of the software’s menu structure follows. File This menu gives access to the file handling, and printing functions of this software. For a complete description see Section 4 of this manual. Communications The communications menu allows you to select the communications port, and select the serial data mode. For a complete description see Section 3 of this manual. Scale The scale menu provides access to the plot re-scaling functions. It allows you to change the scale on any of the plots, and turn on or off the automatic re-scaling. For a complete description see Section 6 of this manual. Zeroing The zeroing menu allows you to change between automatic and manual zeroing, and to order an immediate zero. For a complete description see Section 7 of this manual. Sensor Type The sensor type menu allows you to specify the flow sensor you are using. For a complete description see Section 8 of this manual. Calibration The calibration menu allows you to calibrate your flow sensor, as well as make adjustments for gas composition and barometric pressure. For a complete description see Section 9 of this manual. Setup The setup menu give access to the breath detect functions. These allow you to adjust the level of flow necessary for breath detection, or turn the breath detection on and off. For a complete description see Section 10 of this manual. Help The help menu calls up the RSS 100 for Windows help file. Last Revised: 01/27/99 DOC000X Rev A Page 7 of 25 RSS For Windows Software Manual 3.0 Serial Communications 3.1 Cable Requirements The RS232 serial communication is a 3-wire interface. The cable is a straight-through (not nullmodem) 9 pin male to 9 pin female DSUB cable. Pin PC Signal RSS 100 Signal 5 Ground Ground 3 Transmit Receive 2 Receive Transmit 3.2 Selecting COMM Port The RSS 100 can work on either COMM 1 or COMM 2 on your personal computer. If the RSS 100 is connected to your computer and turned on when the software is started, the software will automatically detect which COMM port the RSS 100 is on and then initiate data transfer between the RSS 100 and your PC. While running the RSS Software you may select COMMUNICATIONS from the menu bar to change communications options. 3.2 Selecting the Serial Communications Mode The RSS 100 has four modes for data transmission via the serial port. These are available from the Communications menu. The currently selected mode shows a check mark next to its name. None selects no data transmission. This stops all automatic data transmissions from the RSS 100. Wave Form starts the continuous transmission of waveform data from the RSS 100. Flow, volume, airway pressure, and auxiliary pressure data are received at a 50 Hz rate. Parameters starts the automatic transmission of parameters that are calculated at the end of a breath. These parameters are calculated on a breath-to-breath basis. Refer to the RSS 100 user manual Section 3: Monitor Operation: Definition of Calculated Parameters for a complete list of these parameters. Please note that no parameters are calculated, for a breath, if a zero occurs during that breath. Both starts the automatic transmission of both waveform data and parameter data, as described above. Last Revised: 01/27/99 DOC000X Rev A Page 8 of 25 RSS For Windows Software Manual 3.3 Protocol for Serial Communications See section 10 of the RSS 100 User’s Manual. Last Revised: 01/27/99 DOC000X Rev A Page 9 of 25 RSS For Windows Software Manual 4.0 Data and File Handling 4.1 File Structure - Background and Theory of Operation The RSS software files handle three kinds of data: Signals, Parameters, and events. Signals are the raw flow, pressure and volume time-series waveforms. Parameters are the breath-bybreath ventilator parameters calculated by the RSS 100 device. Events are information placed into the data files by the user. The RSS software provides an interface for the user to mark events during data collection. The RSS software can generate three different file types, namely: filename.RSS The .RSS files are generated when the user selects to save data to a file. These files contain signal, parameters, and event information. filename.SIG Signal file of raw waveforms. The .SIG files are generated from the .RSS files using a file conversion program. This is done by selecting FILE/GENERATE A SIGNAL FILE from the RSS software menu bar. Files must be closed to enable this option. The .SIG files are in ASCII format and can easily be imported into your favorite spreadsheet. filename.PAR Breath-by-breath calculated ventilator parameters. The .PAR files are generated from the .RSS files using a file conversion program. This is done by selecting FILE/GENERATE A PARAM FILE from the RSS software menu bar. Files must be closed to enable this option. The .PAR files are in ASCII format and can easily be imported into your favorite spreadsheet. The RSS software has a simple means to annotate data files. Each of the annotations will be marked as an "event" in the data file. When the data files are played back, the annotated text and the time of the event will be displayed on the screen. 4.1.1 EVENTS The RSS software supports 5 different types of events 1. START OF FILE 2. BEGINNING OF A RECORDING 3. TIME STAMP 4. ANNOTATE 5. END OF FILE 6. AUTOMATIC EVENT Each event is marked in the .RSS data file with a time stamp. For the beginning of a recording and for an annotated event, a dialog box will appear with a space provided for the user to type in his text annotation. "TIME STAMP" or an "ANNOTATE" events are initiated by the user by pressing a button that is provided for each. Each event is described below. A File Control Interface is provided to aid in data collection and data playback. Last Revised: 01/27/99 DOC000X Rev A Page 10 of 25 RSS For Windows Software Manual Automatic events are placed in the file to assist in the rewind and forward functions of the data file playback. This will be described in more detail later in section 4.3.3. 4.2 Open and Closing Data Files The file menu has two options for opening data files. SAVE DATA FILE opens a data for save to file button on the toolbar. The file may either recording data. You may also use the be a new or an existing file. If it is an existing file, you will be prompted if you want to overwrite the existing file. If you select NO, the file will be appended to at its end. NOTE No data is stored to the file until a file is open and RECORD is selected on the File Control Interface. The REVIEW DATA FILE is available to open an existing file for playback. You may also use the open file button on the toolbar. To close data files, select CLOSE FILES from the menu or use the file close button on the toolbar. NOTE The RSS software does not store data in a buffer (temporary file). If a file is not open and the software recording, no data will be saved. RECORDING is covered in the next section describing the File Control Interface. Last Revised: 01/27/99 DOC000X Rev A Page 11 of 25 RSS For Windows Software Manual 4.3 File Control Interface The File Control Interface is a sub-screen used for recording, annotating, and playback of data files. You can bring up the File Control Interface by selecting the file control button on the toolbar, or by selecting FILE / FILE CONTROLS from the menu bar. There are four main panels or sections in the File Controls Interface; Playback Controls, Event Markers, File Information, and Event Figure 4.3.1 - File Controls Interface 4.3.1 Playback Controls The following controls are provided to aid in data review and recording. RECORD: The record button initiates writing data to the open data file. An TIME STAMP event marker is placed in the data file indicating the begining of recording. PLAY: The play button initiates data playback from an open file. STOP: The stop button terminates data recording or playback. The data file is left open. Last Revised: 01/27/99 DOC000X Rev A Page 12 of 25 RSS For Windows Software Manual PAUSE: The pause button stops data playback temporarilly. Files should be paused before printing so that desired plot is captured for printing. BEGINING OF FILE: This button rewinds the data file to its beginning. This only affects data playback. All recording is done at the end of the data file. REWIND: This button will back up the data file during playback to the previous event marker in the file. Automatic event markers provide periodic events for the file to be rewound or forwarded to. CONTINUOUS PLAY: This button may be enabled during data playback to allow for continuous play. In continuous play the data file will automatically rewind to the begining of the file as soon as the end of the file is reached. FORWARD: This button advances the data file during playback to the next event marker in the file. Automatic event markers provide periodic events for the file to be rewound or forwarded to. END OF FILE: This button advances the data file to its end. This only affects data playback. SPEED CONTROL: The speed control is provided to adjust the playback speed. The number shown is the time in milliseconds (msec) between waveform samples. The data sample rate for the RSS 100 is 20 msec Therefore, a number larger than 20 will result in slower than normal playback and smaller numbers will yield a fast playback speed. 4.3.2 Event Markers Event markers have been provided to assist you during data collection. There are two events that you (the user) can place into the file: TIME STAMP and ANNOTATE. During file playback these events will appear in the "Event" panel on the File Controls Interface. Pressing this button during recording places a time stamp in the data file. A dialog box will appear showing the exact time that was written to the file. One use of this function is to correlate data collection in a laboratory notebook or data collection worksheet with the data in the file. Pressing this button during recording brings up a dialog box where you may enter notes (text). Upon pressing OK, your notes and a time stamp is placed in the data file. It should be noted that the time stamp is the time that the OK button was pushed, not the ANNOTATE button. Last Revised: 01/27/99 DOC000X Rev A Page 13 of 25 RSS For Windows Software Manual 4.3.2.1 Automatic Event Markers Automatic event markers are placed in data files to assist in the rewind and forward functions during playback. Recall that rewind and forward simply move the data file from event to event. In the absence of user events (i.e. TIME or ANNOTATE) there would simply be beginning and end of file events. You may adjust the time intervals between automatic events. To set the time interval select FILE / TIMED BREAKS form the menu bar. This will bring up the following dialog box: Select the desired time interval between automatic event markers and then select OK. Shorter times will allow you to see more of your data during playback. The software keeps a timer for the automatic event marker. If you (the user) insert an event by using TIME or ANNOTATE the timer is reset. This is to avoid having automatic events too close to user events. 4.3.3 File Information Panel The File Information Panel of the File Controls Interface is shown below. The first line in the information box contains the open file name. The next line is the time that the file was first created. The remaining lines contain the information that you (the user) provided when the file was created. Last Revised: 01/27/99 DOC000X Rev A Page 14 of 25 RSS For Windows Software Manual 4.3.4 Event Panel During file playback the software checks for event markers in the data files. The event panel displays information from the data file regarding the last event that was played back. This information will remain displayed until another event is reached. 4.4 Generating Signal (.SIG) Files A signal file is a data file of raw waveforms. Older versions of the RSS software generated thes files automatically. In the current version the .SIG files are generated from the .RSS files using a file conversion program. This is done by selecting FILE / GENERATE A SIGNAL FILE from the RSS software menu bar. Files must be closed to enable this option. The .SIG files are in ASCII format and can easily be imported into your favorite spreadsheet. They contain raw flow, pressure, volume, and auxiliary pressure time series collected at 20 msec time increments (50 Hz sample rate). 4.5 Generating Parameter (.PAR) Files Parameter files store the breath-by-breath calculated ventilator parameters. The .PAR files are generated from the .RSS files using a file conversion program. This is done by selecting FILE / GENERATE A PARAM FILE from the RSS software menu bar. Files must be closed to enable this option. The .PAR files are in ASCII format and can easily be imported into your favorite spreadsheet. Last Revised: 01/27/99 DOC000X Rev A Page 15 of 25 RSS For Windows Software Manual 5.0 Printing In order to print the charts, select File | Print from the menu bar or click on the on the toolbar. The following dialog will appear. Print button From this dialog box you are allowed to select which chart(s) you want to print. By clicking the checkbox next to the chart you want to print, you specify which will be printed. To add notes to the printouts select the Annotate button. This will bring up the Annotate dialog box, add up to four lines of notes then click Ok. The standard print dialog box is then shown which allows you to select the printer, and print quality. Last Revised: 01/27/99 DOC000X Rev A Page 16 of 25 RSS For Windows Software Manual 6.0 Re-scaling Plots The RSS 100 for Windows software automatically tries to scale each plot so that the entire plot is visible to you. If you don’t want to wait for the auto scale to re-scale the plots you can select scale | re-scale from the menu. This will force the program to re-scale all plots now. Should you want to specify a specific range to view on a plot this can be easily done in one of two ways. Either, select scale | manual scale from the menu, or right-click on the plot that you want to re-scale. This will bring up a re-scale dialog box that will allow you to specify the range of values you want to focus in on. Enter the minimum and maximum values then click Ok to re-scale the plot. Last Revised: 01/27/99 DOC000X Rev A Page 17 of 25 RSS For Windows Software Manual To return to automatic scaling mode select that plot from the Scale | Auto scale menu, or select Auto Scale by right-clicking the chart you want returned to auto scale. To return all the plots to auto scale select Auto Scale All from the Scale| Auto Scale menu. Last Revised: 01/27/99 DOC000X Rev A Page 18 of 25 RSS For Windows Software Manual 7.0 Zeroing Functions (Auto-Zero) The RSS 100 provides two different modes for zeroing: “Automatic Zeroing,” and “Manual Zeroing.” When the RSS 100 is set for automatic zeroing the device will zero its self approximately every five minutes, this is the default setting for the RSS 100. When the RSS 100 is set for manual zeroing the device waits for you to send the zero command. To change the zeroing mode select the desired mode from the Zeroing menu. The current zeroing mode shows a check mark next to its name. In either zeroing mode you can request an immediate zero. The RSS 100 for Windows software provides three ways to do this. The first way is to select Zero Now from the Zeroing menu. The second way is to click the “Zero Now,” speed button on the tool bar. Third, you can request a zero by pressing the Ctrl key and the Z key at the same time. For more information on zeroing refer to section 9 of the RSS 100 User’s Manual. Last Revised: 01/27/99 DOC000X Rev A Page 19 of 25 RSS For Windows Software Manual 8.0 Selecting Sensor Type 8.1 KORR Sensors The RSS 100 is designed to work with two types of pneumotachs. One type of pneumotach is the KORR fixed-orifice pneumotach. These are shipped with the RSS 100. To use a KORR Adult or KORR Neonate flow sensor, connect the sensor to the RSS 100 and select the appropriate sensor from the Sensor Type menu. The KORR sensors do not require any calibration and may be used immediately. Once, a sensor is selected then a check mark will appear next to its name in the menu, also the name of the current sensor is listed on the status bar at the bottom of the screen. Refer to section 7 of the RSS 100 User’s Manual, for more information. 8.2 Linear Sensors The RSS 100 also works with linear pneumotachs. Pneumotachs manufactured by Hans Rudolph can be selected by their model numbers. If you don’t know the model number of the linear flow sensor you are using then you may select a generic linear flow sensor type based on the flow rates of your sensor. Linear flow sensors do require calibration. The RSS 100 for Windows software will remind you to calibrate your flow sensor, by showing the dialog box to the right when you select it. By clicking the yes button you will be immediately taken to the flow calibration routine. If you choose not to calibrate your sensor at this time you can calibrate it later by selecting Flow Sensor from the Calibration menu. As with, the KORR sensors a check mark will appear next to the name of the sensor that you selected and the name of the sensor will appear on the status bar. Last Revised: 01/27/99 DOC000X Rev A Page 20 of 25 RSS For Windows Software Manual 9.0 Calibration Interface 9.1 Flow Calibration The RSS 100 allows the user to calibrate the flow measurement. If you are using a linear pneumotach, calibration is required. If you are using a KORR fixed-orifice pneumotach the RSS 100 is already calibrated. Refer to section 9 of the RSS 100 User’s Manual. To enter flow calibration mode select the Flow Sensor option from the Calibration menu. 9.1.1 Calibration Volume Flow calibration is performed by passing a known volume of gas through the pneumotach, using a calibration syringe. The first dialog to appear asks you to enter the volume of your calibration syringe, in milliliters. Click the OK button to continue with the calibration or click Cancel to abort this calibration. 9.1.2 Calibration Screen The calibration dialog box displays the volume of the syringe, the measured inspired volume, the measured expired volume, and an approximate flow rate. Pump the calibration syringe all the way in and all the way out until the three volumes are similar. Remember, to keep the approximate flow rate within the tolerances of your pneumotach. Once, the inspired and expired volumes are similar to the volume of the calibration syringe, click the Accept button, and you are done calibrating your pneumotach. If you want to quit calibration with out saving finishing click the Cancel button and the calibration is aborted. Last Revised: 01/27/99 DOC000X Rev A Page 21 of 25 RSS For Windows Software Manual 9.2 Barometric Pressure Calibration The RSS 100 automatically calculates the barometric pressure, to with in 2 percent of full scale. To give greater accuracy, the user is allowed to enter the local barometric pressure into the system. To change the barometric pressure select Barometric Pressure from the Calibration menu. Enter the local barometric pressure in the box provided, and click the OK button. 9.3.1 Gas Settings The RSS 100 can compensate for the effects of gas temperature, viscosity, molecular weight, and relative humidity, on flow measurement, as well as correct flow calculations to one of several standard conditions. The Gas Settings option under the Setup menu gives you access to these settings. For more information on the gas settings, refer to section 5 of the RSS 100 User’s Manual. The Gas Settings dialog box lets you adjust the temperature, viscosity, molecular weight, and relative humidity for both the inhaled and exhaled gases. Also you can adjust the ambient temperature, and have the flow adjusted to one of six standard modes (ATP, ATPD, ATPS, BTPS, STPD 0°C, and STPD 15°C). If you don’t know the viscosity or molecular weight of the gas you are using click the Gas Calculator button. Last Revised: 01/27/99 DOC000X Rev A Page 22 of 25 RSS For Windows Software Manual 9.3.2 Gas Calculator The gas calculator allows you to calculate the viscosity, and molecular weight of a gas mixture. One gas serves as a balance gas. This means that the percentage of this gas is automatically adjusted to insure that the total percentage of gases totals 100%. To change which gas is the balance gas click the radio button to the left of the gas’s name. Any of the five standard gases may be used as a balance gas. You can adjust how much of a percentage each gas makes up of your mixture by changing the values in the two columns to the right of the gas’s name. If you have a gas in your mixture that is not one of the standard five, you may use one of the user gases. The user gases have three predefined gas option and a user defined option. Select your gas from the list of predefined gases or if the gas you are using isn’t one of these predefined gases select the “user defined” option. Then enter the molecular weight, viscosity coefficient, and viscosity intercept, into the boxes given. Clicking the Air button or the Respiration button will set the calculator to the defaults for air or respiration. Enter the temperature and relative humidity for both inspired and expired gases in the boxes provided. Viscosity and molecular weight are calculated every time you make a change to any of the controls. When you are done click the OK button to accept these values. The viscosity, relative humidity, molecular weight, and temperature will be put into the appropriate boxes on the Gas Settings dialog. Last Revised: 01/27/99 DOC000X Rev A Page 23 of 25 RSS For Windows Software Manual 10.0 Breath Detect Setup The RSS 100 has a built-in breath detection algorithm. The algorithm determines the breath phase (i.e. inspiration, expiration, inspiratory pause, etc.) This algorithm is designed to reject signal noise and other artifact when determining the phases of a breath. 10.1 Breath Detect Threshold The RSS 100 breath detection algorithm uses a flow rate threshold that the flow must cross to trigger a change in the breath phase. Higher the flow rate thresholds yields less sensitive breath detection. Lower thresholds yield more sensitive breath detection. Typical breath detection thresholds are given below for the different sensor types. Flow Sensor Type KORR Neonatal KORR Adult Hans Rudolph 8430/8431 Hans Rudolph 8420/8421 Hans Rudolph 8410/8411 Hans Rudolph 8300/4311 Hans Rudolph 3500/4500 Hans Rudolph 3719/4719 Hans Rudolph 3700/4700 Hans Rudolph 3830/4830 Hans Rudolph 3813/4813 35 LPM 180 LPM 3 LPM 5 LPM 10 LPM 10 LPM 35 LPM 100 LPM 160 LPM 400 LPM 800 LPM Default 0.4 2.0 0.1 0.4 0.4 0.4 1.0 1.0 1.0 5.0 5.0 Flow Threshold (Liters per Minute) Minimum Maximum 0.2 2 0.5 10 0.1 1 0.2 1 0.2 2 0.2 2 0.5 5 0.5 10 0.5 10 1.0 25 1.0 25 Select Threshold from the Setup | Breath Detect menu to adjust the breath detection threshold. You may also use the button on the toolbar. Enter the desired flow rate for the breath detection threshold and select "OK". The threshold value will return to DEFAULT whenever the RSS 100 is turned on, or when a new flow sensor type is selected. Last Revised: 01/27/99 DOC000X Rev A Page 24 of 25 RSS For Windows Software Manual 10.2 Turning Breath Detection ON or OFF The RSS 100 breath detection will default to ON whenever the device is turned on, or when a new flow sensor type is selected. The breath detection may be turned off using the on the toolbar or by using the Setup | Breath Detect selection from the menu bar. Last Revised: 01/27/99 DOC000X Rev A button Page 25 of 25