1
VisualQuant
Getting Started Guide
Version 1.0.3827, 2010-07-10
Kevin Jameson
1
Introduction ....................................................................................................... 4
1.1
2
Goals of This Document .............................................................................................................. 4
VisualQuant Architecture.................................................................................. 4
2.1
2.2
2.3
2.4
2.5
2.5.1
2.5.2
2.5.3
2.5.4
2.5.5
2.5.6
3
The Current Generation of Trading Platform Architecture ......................................................... 4
The Main Problems to Solve ....................................................................................................... 4
VisualQuant -- The Next Generation Platform Architecture ....................................................... 5
VisualQuant Event Model ........................................................................................................... 5
Key Architectural Features and Advantages ............................................................................... 6
Functional Flexibility .............................................................................................................. 6
Functional Extensibility .......................................................................................................... 6
Data and Event Flow Transparency ........................................................................................ 6
More Specific Trading Architectures ...................................................................................... 6
Increased Efficiency and Performance .................................................................................... 6
Simpler User Interface ............................................................................................................ 6
Touring the IDE Interface .................................................................................. 6
3.1
Working With Dockable Window Panes..................................................................................... 7
3.1.1 The Solution Explorer Window Pane...................................................................................... 8
3.1.2 The Block Explorer Window Pane.......................................................................................... 8
3.1.3 The Properties Window Pane .................................................................................................. 9
3.1.4 The Output Window Pane ..................................................................................................... 10
3.2
Working With the Center Window Pane ................................................................................... 10
3.2.1 The Start Page Tab ................................................................................................................ 10
3.2.2 The Strategy Diagram Tab .................................................................................................... 11
3.3
Understanding the IDE Toolbars ............................................................................................... 11
3.3.1 The File Toolbar .................................................................................................................... 11
3.3.2 The Execution Toolbar .......................................................................................................... 12
4
Working with Existing Strategy Projects ....................................................... 12
4.1
5
Working with Blocks on Diagrams ................................................................. 12
5.1
5.2
6
Opening and Running Existing Strategies ................................................................................. 12
Zooming and Sliding the Diagram ............................................................................................ 13
Clicking and Dragging Blocks .................................................................................................. 13
Block Types and Functions ............................................................................ 14
6.1
Block Types ............................................................................................................................... 14
6.1.1 Binary Blocks ........................................................................................................................ 14
6.1.2 Code Blocks .......................................................................................................................... 14
6.1.3 Composite Blocks ................................................................................................................. 14
2
6.2
7
User DLLs (Dynamic Link Libraries) ....................................................................................... 15
Creating Your First Strategy ........................................................................... 15
7.1
7.2
7.3
7.3.1
7.3.2
7.4
7.5
7.6
7.7
7.8
8
Creating a New Solution............................................................................................................ 15
Creating a New Project .............................................................................................................. 16
Displaying Historical Data ........................................................................................................ 17
Using the Output/Console Block........................................................................................... 18
Using the Viewer/Console Block .......................................................................................... 19
Using a Chart Display................................................................................................................ 20
Editing MetaData Properties for Chart Links ............................................................................ 21
Generating Bars from Trade Data ............................................................................................. 22
Filtering Incoming Trade Data .................................................................................................. 23
Changing Block Interface Names .............................................................................................. 26
Capturing Live Data......................................................................................... 26
8.1
8.2
8.3
9
Creating a New Instrument ........................................................................................................ 26
Importing Data........................................................................................................................... 27
Diagram for Capturing Data ...................................................................................................... 27
Creating a Simple Moving Average Strategy ................................................. 28
9.1
9.2
9.3
9.4
10
10.1
Moving Average Indicators ....................................................................................................... 28
Trading Actions ......................................................................................................................... 28
Displaying Results ..................................................................................................................... 28
Viewing Results in the Center Tab ............................................................................................ 28
Advanced Features ......................................................................................... 28
Generating a Strategy Application ............................................................................................ 28
3
1 Introduction
VisualQuant is an IDE (integrated development environment) for designing and executing computerized
quantitative trading applications on either historical or live market data. It is the latest generation in a 10year evolution of IDE platforms for programming and executing event-driven computerized trading
strategies.
1.1
Goals of This Document
The main goal of this document is to provide a short introduction to the new architecture, most interesting
features, and some useful user interface most manipulations.
This is not intended to be a full blown user manual, because the product itself is still under development.
Instead, this document is only a short introduction to existing product features. We expect this document
to grow over time, as the product itself is developed further.
2 VisualQuant Architecture
2.1
The Current Generation of Trading Platform Architecture
The current generation of SmartQuant trading platform is illustrated by the two existing products
QuantDeveloper and OpenQuant. This generation of platform is based on an event-driven architecture in
which the events and data flows inside the framework are predefined by the product. This design enables
programmers to focus their coding efforts on the strategy itself, without worrying about having to code
the underlying event, data, and reporting information flows.
QuantDeveloper is an industrial-strength programming platform for institutions and hedge funds. It
contains several main programs for programming and backtesting trading strategies (QuantDeveloper),
for collecting and managing large quantities of trade and quote data for teams of programmers
(DataCenter), and for executing trading strategies in real time in a black box fashion (CATS Computerized Automated Trading System).
OpenQuant is a simplified, much less expensive retail product for individual traders and small hedge
funds. It only contains one main program, which is a single IDE that can perform all the functions of
collecting data and programming, backtesting, and executing strategies. This product uses a more modern
GUI library for a more modern look and feel.
2.2
The Main Problems to Solve
Even though the current generation products were very powerful and could harness all the power
provided by the underlying C# and .NET programming platforms, they still had some significant
limitations.
The first main problem (and probably the biggest limitation) to be solved was that both previous products
defined a "hard-coded" underlying trading engine architecture that managed flows of market data, orders,
and executions. The architecture was very useful because it allowed users to concentrate on their strategy
4
code only, and provided a powerful API to the functions of the trading engine. This was a great time saver
because traders were not required to code their own implementations for data and order flows (as they
were required to do before QD was first created 10 years ago).
But as with most models that evolve over time, the fixed-architecture model became too restrictive as
users developed more complex trading strategies. For some strategies, users wanted more functionality
than the framework could provide.
For example, the framework would not let users insert trade or quote filters between the market data
source and the trading engine, perhaps to clean up or augment incoming trades and quotes. Users could
only access the engine through the top-level API, and could not add their own code between the internal
parts of the engine. Of course they could not extend the functions of the engine either. As a second
example, users could not directly access order and execution data flows to create their own reports, or real
time analysis modules.
2.3
VisualQuant -- The Next Generation Platform Architecture
VisualQuant is based on the next generation of trading platform architecture.
The first major goal of VisualQuant is to provide a new development model that enables users to
assemble their own underlying framework using predefined (or user provided) building blocks. This way,
users can have full access to all functional blocks within the underlying trading engine, and can extend the
constructed engine as they please with their own building blocks, to support whatever advanced filters,
strategies, and reports that they can imagine.
A second major goal of VisualQuant is to provide a more convenient drag-drop-and-connect visual user
interface for assembling strategies from building blocks. This way, non-programmers can learn to create
and experiment with strategies without having to understand C# programming. Complete and functional
strategies can be created simply by dragging and interconnecting a suitable suit of building blocks on to
the development canvas.
2.4
VisualQuant Event Model
All blocks within VisualQuant communicate through events. When users link two blocks on the canvas,
VisualQuant passes an event emitted by the sending block to the receiving block. For example, a sender
block might emit bid/ask quotes, and a receiver block might be a quote filter that filtered the input stream
to remove bad quotes with zero prices. Or a receiver block might calculate an algorithmic indicator from
the quote stream, or might display the stream of quote events on a chart window.
Users can visually create complex trading applications from blocks that can be deployed in a co-located
fashion on servers at the brokers, or can be deployed on trader desktops. In principle, any trading
application that can be defined by event flows can be implemented with VisualQuant.
For example, using the new VisualQuant block model, it is possible to implement a similar version of the
second-generation fixed-architecture OpenQuant trading engine model.
5
2.5
Key Architectural Features and Advantages
Here are some key features and advantage of the new VisualQuant model, as compared to the previous
generation products QuantDeveloper (QD) and OpenQuant (OQ).
2.5.1 Functional Flexibility
With previous products, users could not change predefined data and event flows within the trading
engine. With VisualQuant, they can change blocks inside the trading engine to suit their needs.
2.5.2
Functional Extensibility
With previous products, users could not extend the functionality of the underlying trading engine. With
VisualQuant, they can add extensions by coding and adding their own functional blocks.
2.5.3
Data and Event Flow Transparency
Previous products hid much of the action behind the scenes within the trading engine, preventing users
from seeing or influencing the data, order, execution, and control flows within the engine. But with
VisualQuant, all event flows are visible and accessible to users on the design canvas.
2.5.4
More Specific Trading Architectures
Previous products implemented one generic and powerful trading engine to support all possible user
trading strategies. In contrast, VisualQuant enables users to add just the functionality that they require,
and no more, to their trading applications. Constructing dedicated engines that are optimized for specific
strategies is now possible.
2.5.5
Increased Efficiency and Performance
Previous products lost efficiency because their generic trading engines had to perform all functions all of
the time, whether or not users required the extra statistical calculations, the extra data manipulations, the
extra indicator calculations, the extra portfolio calculations, etc. In contrast, VisualQuant enables users to
implement the minimal and optimal functionality that is required by a strategy, so that no extra work is
performed and no extra CPU cycles are wasted. As a consequence, backtests can run faster and more
efficiently, in time (CPU) and space (memory).
2.5.6
Simpler User Interface
Previous products required all strategies to be created using C# programming methods. In contrast,
VisualQuant allows non-traders to create and run strategies using drag, drop, and connect methods.
3 Touring the IDE Interface
This section is an overview of the visual interface of the program.
6
3.1
Working With Dockable Window Panes
This section summarizes the functions of the various window panes in the IDE. All window panes are
“tear-off and dockable,” which means that you can tear off and relocate the window panes to suit your
preferences in visual display structure. Any window that can be torn off can also be floated over top of the
IDE, simply by not re-docking the window pane.
Here is a list of things you can do with dockable window panes:
To auto-hide a dockable window, click the pin icon to unpin the window. The window will slide
into the edge of the IDE, and will leave a tab showing.
To show a window temporarily, move your mouse over the tab to pop out the window.
To show a window permanently, click the pin icon to pin the window.
To tear off a window, click and drag the title bar. Pay attention—there is a difference between
using the TITLE BAR of a window, and using the TAB of a window when there are multiple tabs
in one pane.
If you drag and drop a TITLE BAR, you will see a PARTIAL set of drop indicators that will let
you select the WINDOW PANE to hold the window when you drop it. The dropped window will
occupy the whole window pane, and will show up as a TAB inside of the window pane.
But if you drag and drop a TAB, then you will see a FULL set of drop indicators that will let you
drop the tab in the upper / lower / left / right sections OF THE SAME WINDOW PANE. You
will have to practice to see the different kinds of drop indicators, and their effects.
To re-dock a window, tear it off and drop it (that is, drop your mouse arrow) on one of the 8 redocking indicators that appear. The four “outside” docking indicators located near the top,
bottom, left and right sides of the main window will cause the tear off window to occupy the
whole edge of the IDE.
The four “inside” docking indicators will cause the tear off window to share the associated
section of the center IDE window (e.g. dropping the tear off window on the top inside indicator
will split the center pane with a horizontal line, and will show the tear off window in the top half
of the center pane).
In all cases, the new area to be occupied is indicated by a light blue shadow.
To float a window, tear it off and drop it anywhere on a docking indicator.
To return a floating window to its previous docked location, double click its title bar.
You will probably have to practice for a while before you understand the meaning of all the
various drop indicators, and what the final result will look like.
7
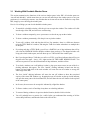
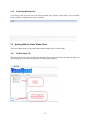
3.1.1
The Solution Explorer Window Pane
The solution Explorer window pane shows the currently active solution. Each solution can contain one or
more strategy projects. At execution time, each strategy project is run within its own separate
computational thread.
The screenshot below shows one strategy solution that contains six strategy projects. Each strategy
project will open up into its own top level diagram within the center window pane. Each strategy project
can be enabled or disabled, so you can run only the projects that interest you at run time. Each strategy
project has one top level Diagram that specifies the event flow within the strategy.
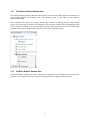
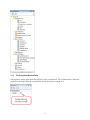
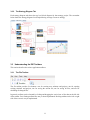
3.1.2
The Block Explorer Window Pane
The block Explorer window pane shows a hierarchical organization of all blocks that are known to the
program. The screenshot below shows the various categories that are shipped with the product.
8
3.1.3
The Properties Window Pane
The properties window pane shows the properties of the selected block. The screenshot below shows the
property for the Simple Moving Average block, which currently has a length of 14.
9
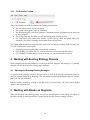
3.1.4
The Output Window Pane
Your strategy code can print text to the output window pane, which is shown below. The screenshot
below contains no output because none was printed.
3.2
Working With the Center Window Pane
The center window pane is a tab control that contains multiple tabs of various kinds.
3.2.1
The Start Page Tab
The first tab in the center pane is usually the start pane. If you want to NOT show the start pane when you
start the program, you can turn the start pane off in the program options.
10
3.2.2
The Strategy Diagram Tab
Each strategy diagram tab shows the top level block diagram for that strategy project. The screenshot
below shows the strategy diagram for a Simple Moving Average Crossover strategy.
3.3
Understanding the IDE Toolbars
This section describes the various application toolbars.
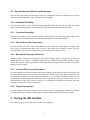
3.3.1
The File Toolbar
The file toolbar provides five buttons---one for creating new solutions and projects, one for opening
existing solutions and projects, one for saving the current file, one for saving all files, and one for
rebuilding all changed files.
In general, toolbars can be relocated by clicking and dragging the vertical row of four dots at the left side
of the toolbar. Free floating toolbars have not yet been implemented. Docking toolbars on the left or right
side of the screen is not yet implemented.
11
3.3.2
The Execution Toolbar
The execution toolbar provides four buttons and a training mode control.
The first button (arrow) runs the simulation.
The second button (square) stops the simulation.
The third button (gears with arrow) generates a standalone runtime application that can be moved
to other computers.
The trading mode drop-down box specifies the trading mode of the application.
The fifth button (pin) updates user interface controls such as charts and graphs during the
simulation. (For faster simulations, do not update charts and real-time.)
The Trading Mode dropdown box provides three choices for selecting your trading mode (currently only
Live and Simulation are implemented):
Simulation (historical market data, simulated trade execution)
Paper Trading (live market data, live trade execution on a test account with fake money)
Live Trading (live market data, live trade execution on a real account with real money)
4 Working with Existing Strategy Projects
Before describing the detailed mechanics of working with block diagrams and strategies, it is probably
useful to first describe how to run existing sample strategies.
4.1
Opening and Running Existing Strategies
To open an existing strategy solution so that you can run it, click on the strategy solution name in the list
of recent solutions shown on the Start Page. This will load the solution into the Solution Explorer window
pane in the top right of the IDE.
Run the example solution by clicking on the Run icon (an arrow/triangle). The chart controls should
update as the simulation runs.
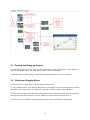
5 Working with Blocks on Diagrams
When you first open a new strategy project, the top-level block diagram for that strategy will appear in
the center window. In the diagram below, a simple moving average crossover strategy is shown.
12
5.1
Zooming and Sliding the Diagram
To zoom the diagram in or out, either use the zoom control on the top left corner of the diagram, or
simply use the mouse wheel. The mouse wheel method is far more convenient.
To slide the diagram after zooming it, right-click the diagram and drag it to your new location.
5.2
Clicking and Dragging Blocks
To select and move a single block, click and drag it by the title bar.
To select multiple blocks, click and drag somewhere on the diagram so the selection marquee covers the
blocks that you are interested in. As each block is selected, an outline is drawn around the block.
To add or subtract single blocks from an existing collection of selected blocks, hold down the control key
and click the single block of interest. It will be added to, or subtracted from, the selection set.
To drag a set of selected blocks, click and drag the title bar of one of the blocks in the selection.
13
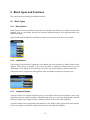
6 Block Types and Functions
This section describes block types and their functions.
6.1
6.1.1
Block Types
Binary Blocks
Binary blocks are blocks that do not expand into user-editable code when they are double clicked on the
diagram. They are not editable because they represent hardcoded aspects of the application that users
should not change.
Binary blocks look like light blue code blocks, but they won't open into code. Here is an example.
6.1.2
Code Blocks
Code blocks are blocks that do expand into user-editable code files when they are double clicked on the
diagram. These blocks are editable to give users the ability to modify the internal code to suit user
requirements. For example, all new block types created by users will normally be editable code blocks.
Code blocks can be recognized by their light blue color, and double clicking will open their code.
6.1.3
Composite Blocks
Composite blocks are container blocks that group a set of other blocks into one block that is more easily
manipulated by users. Double-clicking a composite block opens up a new block diagram that represents
the block contents of the composite block. Composite blocks can be nested within each other.
Composite blocks can be recognized by their dark blue color. Double clicking opens their block diagram.
Here is an example of a dark blue composite block and its associated block diagram.
14
6.2
User DLLs (Dynamic Link Libraries)
VisualQuant is implemented using the .NET framework, so VisualQuant code blocks can reference and
use any valid .NET assembly to perform simulation functions. For example, user code can call external
third party DLL assemblies, and users can create and use their own DLL assemblies.
7 Creating Your First Strategy
This section explains how to create and execute several simple block diagram strategies.
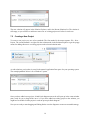
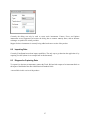
7.1
Creating a New Solution
To create a new solution, use the menu sequence File - New - Solution to get the new solution dialog
shown below. The new solution files will be stored in the normal Application Data space for your
operating system. The dialog below shows part of the pathname for Windows7.
15
The new solution will appear in the Solution Explorer, and in the Recent Solutions list. The solution is
still empty, so you will have to add one or more new or existing projects to it before it can be run.
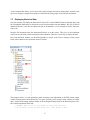
7.2
Creating a New Project
To create a new project, use one of two methods. The first method is the menu sequence File - New Project. The second method is to right click the solution node in the Solution Explorer to get the popup
menus for adding either new or existing projects to the selected solution node.
As with solutions, project data is stored in the normal Application Data space for your operating system.
The example pathname below is for a Windows7 system.
Once you have added a new project, a blank block diagram canvas tab will open up in the center window
pane, ready for you to drag blocks on to it. If you have added an existing project to the solution, you
might have to double click the project in order to open up its block diagram.
Now you are ready to start dragging and linking blocks on to the diagram to create an executable strategy.
16
In the examples that follow, we will start with simple strategies that merely display data, and then work
up to more complex examples that capture live data and run strategy logic to buy and sell instruments.
7.3
Displaying Historical Data
Our first example will display the historical ES Jun10 (ES = Emini S&P500 Futures) data that ships with
the VisualQuant distribution, to show how to access historical data from the database. We will use the ES
instrument because it has the least historical data in the database, so our examples will take much less
time to run.
Drag the ES instrument from the Instrument Explorer on to the canvas. This gives us the instrument
source, but we still need a block to display the data somehow. There are several ways to display the data.
First, from the Block window, see the different kinds of viewers in the Viewers category. In the picture
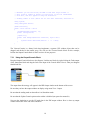
below, notice that there are two blocks named "Console".
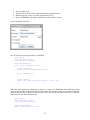
The Output/Console is a code block that prints incoming event information to the IDE console output
window using System.Console.WriteLine. You get to provide a prefix string to mark each line of output
that is written to the output window. Double click the Output/Console block in the Block Explorer to see
the code that implements this block.
// WARNING: This is way too slow except for very small data sets.
// We can use it for ES, because ES only has a tiny amount of data.
17
// Whenever you use this block, BE SURE to NOT send large streams of
// data (such as trades or quotes) to this block. It will be overwhelmed
// with data, and will appear to hang the simulation.
// Sending orders or bars (which are far less data intensive) should be ok.
using System;
using SmartQuant.Blocks;
[Name("Console")]
public class Console : Block
{
[ParameterInput("Prefix", "")]
public string Prefix;
[Input(">")]
public void OnInput(EventInfo eventInfo, object data)
{
System.Console.WriteLine(Prefix + " : " + data);
}
}
The Viewers/Console is a binary block that implements a separate GUI window object that can be
dragged and docked in the normal ways. We will use the Viewers/Console block for this example,
because the Output/Console block is WAY too slow for our purposes.
7.3.1
Using the Output/Console Block
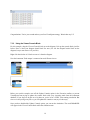
Drag the Output/Console block on to the diagram. Link the two blocks by right clicking the Trade output
of the Instrument block and drag the link to the Input of the Console block. Here is what your diagram
should look like.
The output from this strategy will appear in the IDE Output window at the bottom of the screen.
Be sure that you have the output window on display using menu View - Output.
Be sure that the trading mode on the toolbar is in Simulation mode.
Be sure that the Update Console option on the toolbar is disabled (no square box around it).
Now run the simulation to see the ES trade data in the IDE output window. Here is what my output
window looked like at the end of the simulation.
18
Congratulations! You've just created and run your first VisualQuant strategy. Wasn't that easy?
7.3.2
Using the Viewer/Console Block
For this example, drag the Viewers/Console block on to the diagram. Link up the console block just like
before. Here is what your diagram should look like now (I've left the Output/Console block on the
diagram, but you can remove it if you like).
Right click the title bar of a block to remove it from the diagram.
Now the instrument Trade output is connected to two different viewers.
Before you run this example, turn off the Update Controls option in the Execution toolbar, to prevent
VisualQuant from trying to update the console block with every incoming trade from the instrument
database! If you forget to do this on a big data set, you're in for a VERY slow running simulation. But
since we're only using a tiny ES set, you can update the controls or not (try it both ways).
Once you have disabled the Update Controls option, you can run the simulation. The word DISABLED
will appear in the Viewer/Console block while the simulation runs.
19
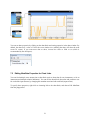
Once the simulation is complete, the DISABLED word will be replaced with trade data obtained from the
database, as shown below.
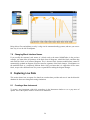
7.4
Using a Chart Display
To add a chart display to the simulation, drag and link a Viewers/Chart block on to the diagram, and link
the Trade output of the instrument to the input of the chart block. You can remove the other two viewers
if you like, or leave them on the diagram, as you please.
Right click the title bar of a block to remove it from the diagram.
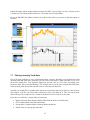
After you have the links in place, be sure to check the Update Controls toolbar option to disable it (unless
you want to see how it slows things down). Run the simulation. Here is what my chart looked like.
20
You can set chart properties by clicking on the chart block and setting properties in the chart window. By
default, the chart uses a value of 30 for the event window size (meaning the chart will show the most
recent 30 events). If you want more data to show, increase the value to 3000 or so (which is
recommended by the developers).
7.5
Editing MetaData Properties for Chart Links
You can feed multiple event streams into a chart block (such as chart data for two instruments, or for an
instrument and multiple technical indicators). You can tell the chart block what color and position to use
for each of the input streams, by changing the metadata associated with each link (input stream).
To specify these properties, right click an incoming link to the chart block, and choose Edit MetaData
from the popup menu.
21
When the metadata dialog appears, you can change the properties associated with the input stream.
7.6
Generating Bars from Trade Data
To generate bars from trade data, connect the Trade output of the instrument block to the Tick input of the
MarketData/Tick block. You can adjust the size of the time bars to a different value if you like, or just use
the default of 60 seconds (1 minute) bars.
In the diagram below, I have changed instruments to CSCO (to get more data than the ES instrument),
added a Time Bar block to generate bars, sent both Trade and Bar event flows to a chart, and sent the Bar
event flow to an Output/Console block as well. When the simulation is run, the chart will display both
22
trade and bar data, and the output window will show the OHLCV (open, high, low, close, volume) of each
1 minute bar. The simulation takes about 20 or 30 seconds to run on my machine.
Be sure to DISABLE the Update Controls icon on the toolbar, unless you want to see the chart update in
real time.
7.7
Filtering Incoming Trade Data
One of the many problems to solve in automated trading systems is defending your algorithm from bad
incoming trade and quote data. Sometimes you can receive a bad trade or quote value that is way off of
the current market price. Your algorithm might treat the bad value as a real value, and change your
position or order flow to your disadvantage. This example shows you can insert a simple data filter block
in the incoming trade flow to filter out bad values or values that you don't like.
Normally you would filter to exclude trades with prices and volumes that are not positive values. But for
this example, we'll filter out CSCO trades whose price value is less than 20.55. This will clip the trade
chart in the previous example at 20.55, so that no trades above 20.55 will show on the chart.
Here's how we will define a custom filter for our project:
Right click on the Block Explorer/Market Data folder to define a new filter block
Choose Market Data as the destination folder
Do not check Composite Block or Strategy Block checkboxes
Double click it to open up the code editor
23
Insert our filter code
Splice the filter into the Trade output link from the instrument block
Run the project to see the new chart (clipped above 20.55)
Be sure to DISABLE the Update Controls icon on the toolbar, as usual
Here is the dialog I filled out.
Here is the skeleton code generated by VisualQuant:
using System;
using SmartQuant.Blocks;
using SmartQuant.Framework;
[Name("NoBadTrades")]
public class NoBadTrades : Block
{
[Output("Output")]
public event OutputEventHandler Output;
public NoBadTrades()
{
}
[Input("Input")]
public void OnInput(EventInfo eventInfo, object data)
{
}
}
When this block appears on a diagram (see below), we want to see BadTrades and GoodTrades on the
input and output of the block instead of the default "Input" and "Output" labels, so we need to change the
strings in the code above. We'll also add in some code to filter out the unwanted trades. Here is what the
code looks like after these modifications.
using System;
using SmartQuant.Blocks;
using SmartQuant.Framework;
[Name("NoBadTrades")]
public class NoBadTrades : Block
24
{
[Output("GoodTrades")] // we changed the name of the output port
public event OutputEventHandler Output;
public NoBadTrades(){}
[Input("BadTrades")]
// we changed the name of the input port
public void OnInput(EventInfo eventInfo, object data)
{
// cast incoming event data as trade data
Trade trade = data as Trade;
//
if (trade.Price > 20.55)
; // discard all trades above 20.55
else {
// send all trades below 20.55 to the output port
Output(trade);
}
}
}
Next, save the code modifications, and build the modified block. To build a single modified block, right
click the block in the Block Explorer and choose Build from the popup menu. To rebuild all modified
blocks, click the Build icon in the File toolbar. Here is a picture of a block that needs rebuilding.
After the block has been rebuilt, you can drag it on to the diagram and link it in between the Instrument
block and the chart block. Here is what my diagram looks like, and here is the output that I saw when I
ran the new filtered data. All CSCO trades above 20.55 were filtered out, and do not appear on the chart.
25
Being able to filter out bad data so easily is a big win for automated trading systems, and now you can see
how easy it is to do with VisualQuant.
7.8
Changing Block Interface Names
If you modify the structural code names of a block--such as the name NoBadTrades in the previous
example, you must delete all instances of the block from all diagrams, rebuild the block, and then drag
and relink the block on all affected diagrams. This is because block structure modifications cannot be
automatically updated on diagrams. Since the interface signature of the block changes, VisualQuant sees
the modified block as a completely different block. Only you know that it is supposed to be the same
block, except with a different name. So you are responsible for making the diagram changes.
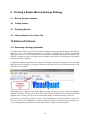
8 Capturing Live Data
This section shows how to capture live data from a market data provider and store it into the historical
database for future use during back testing simulations.
8.1
Creating a New Instrument
To create a new instrument, right click somewhere in the Instrument window to see a pop menu of
options. One of the options will be to create a new instrument.
26
Currently the dialog can only be used to create stock instruments. Futures, Forex, and Options
instruments are not supported yet because the dialog has no contract maturity dates, and no alternate
exchanges or symbols for various providers.
Support for these instruments is currently being added to the next version of the product.
8.2
Importing Data
Currently VisualQuant has no data import capabilities. The only way to get data into the application is by
capturing live data (shown in an example later in this document).
8.3
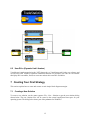
Diagram for Capturing Data
To capture live data into an instrument, connect the Trade, Bid, and Ask outputs of an instrument block to
the inputs of the Market Data Providers/Historical Database block.
<not available in this version of the product>
27
9 Creating a Simple Moving Average Strategy
9.1
Moving Average Indicators
9.2
Trading Actions
9.3
Displaying Results
9.4
Viewing Results in the Center Tab
10 Advanced Features
10.1 Generating a Strategy Application
VisualQuant has the ability to generate a complete, standalone strategy application that you can bundle up
and run on one or more different computers. For example, you might want to generate a standalone
application to run on a server computer that is not used for development, and where VisualQuant is not
installed. In another scenario, you might want to distribute various blocks of the strategy on to different
front-end and server computers.
To generate a standalone application, you must tell VisualQuant to generate ("compile") a new executable
application from the diagrams. Click on the Generate Application icon on the toolbar to generate a new
executable for the solution.
When generation is complete, a new Project Runner window will open up so you can run the standalone
solution. The Runner will show all the user-visible chart and table controls that were defined by the block
diagrams. Here is where you will see charts with trading signals, performance statistics, and so on.
If you want to see the charts update in real time as the simulation runs, click the Update UI icon (it is a
Pin icon) on the toolbar. Updating the UI during simulations REALLY slows down the simulations, so it
is not something that you want to do normally. But for these examples, turn on the updates.
28