1
MetScape Plugin
User Guide
© 2010 The University of Michigan
This work is supported by the
National Center for Integrative Biomedical Informatics
through NIH Grant# 1U54DA021519-01A1
CONTENTS
Contents
iii
Overview
About data sources
Workflow overview
1
1
1
Installing Cytoscape and the MetScape Plugin
Launching Cytoscape and the MetScape plugin from the Web
Installing Cytoscape and the MetScape plugin on your local computer
2
2
3
Entering Data
Option 1: Enter a list of compounds
Option 2: Load an experiment file
Option 3: Select a pathway
4
5
7
10
Choosing Attributes for Display in the Data Panel
Choosing attributes provided through MetScape
Rearranging attributes in the Data Panel
12
12
14
Navigating a Network
Navigating among networks
Navigating within a network
Locating compounds or reactions within a network by searching
Locating compounds or reactions using the Data Panel
15
15
16
17
21
Selecting Compounds and Reactions
For more information
23
24
Filtering Reactions by Pathway
24
Accessing Additional Compound and Reaction Information
Displaying compound and reaction details
26
26
Working with Networks
Expanding a network
Option 1: Expanding a network in the current network window
Option 2: Expanding a network in a new window
Collapsing a network
Creating a subnetwork
Destroying a network
28
28
28
30
31
31
33
Metscape Plugin User Guide · April 2010 · Page iii
Visualizing Changes in Experimental Data
34
Saving and Reopening a Session
Saving a session
Reopening a session
35
35
36
Using MetScape Plugin-Specific Features in Cytoscape
Switching network style for showing reactions
Labeling reactions shown as edges
Restoring the MetScape visual style
Accessing the MetScape plugin legend
36
36
36
37
39
Metscape Plugin User Guide · April 2010 · Page iv
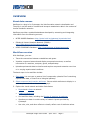
OVERVIEW
About data sources
MetScape is a plug-in for Cytoscape, the bioinformatics network visualization tool.
The plug-in can be used to visualize and interpret metabolomic data in the context of
human metabolic networks.
MetScape provides a metabolite database developed by extracting and integrating
information from the following sources:
•
NCIBI HUMDB Database—http://portal.ncibi.org/gateway/tryourtools.html
•
Edinburgh Human Metabolic Network (EHMN)—
http://www.ehmn.bioinformatics.ed.ac.uk/
•
KEGG COMPOUND Database—http://www.genome.jp/kegg/compound/
Workflow overview
With MetScape, you can:
•
Trace the connections between metabolites and genes.
•
Visualize compound networks and display compound structures, as well as
information for reactions, enzymes, genes, and pathways.
•
Upload experimental data to visualize and explore compound networks over time
or in varying experimental conditions.
The basic steps in the workflow include:
1. Enter data. You can type or paste a list of compounds, upload a file of containing
experimental data, or start from a biological pathway.
2. Select compound and reaction attributes. Choose which attributes to display in a
table as you work with a visual network graph.
3. Explore the visual network and table of attributes:
•
Expand and collapse a network.
•
Create a subnetwork.
•
Sort and filter data, including the filtering of reactions by pathway.
•
Visualize your data in a wide variety of network layouts provided by
Cytoscape.
•
Use color, size, and other effects to visually reflect a set of attribute values.
Metscape Plugin User Guide · April 2010 · Page 1
4. Display additional information not included as compound or reaction attributes.
5. Save your session and reopen it later.
INSTALLING CYTOSCAPE AND THE METSCAPE PLUGIN
You can use the MetScape plugin for Cytoscape in one of two ways:
•
By launching Cytoscape and the MetScape plugin from MiMI Web. With
this method, you launch a temporary copy of Cytoscape and the MetScape plugin
from a Compound Details page after performing a search on MiMI Web. Use this
method when you don’t have the administrative privileges to install software on
your computer. You will not have access to other plugins when you use this
method.
•
By installing Cytoscape and the MetScape plugin on your local computer.
With this method, you can use other plugins that work with MetScape data, such
as Shortest Path and MCODE.
Launching Cytoscape and the MetScape plugin from the Web
To launch Cytoscape and the MetScape plugin from MiMI Web:
1. Go to http://mimi.ncibi.org/MimiWeb/upload-page.jsp.
2. Click the Browse button and select a text file containing compound IDs, one per
line.
3. Click the Copy to Text Box button.
4. For Select type, choose Cids.
5. Click the MiMI Search button.
6. Click a compound ID link.
7. On the Compound Details page, click the View in Metscape link.
After launching the Web version, you can do anything described in this User Guide.
You can save your Cytoscape session on your local computer and reopen it at a later
time after launching the application from MiMI Web again.
Metscape Plugin User Guide · April 2010 · Page 2
Installing Cytoscape and the MetScape plugin on your local
computer
1. Install Cytoscape on your computer. For more information, go to:
•
The Cytoscape website at http://cytoscape.org/.
or
•
The NCIBI Virtual Workshop page at http://portal.ncibi.org/gateway/virtualworkshop.html.
2. After Cytoscape is installed, start the application.
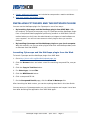
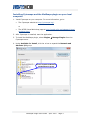
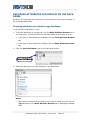
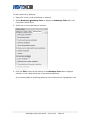
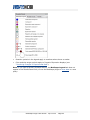
3. To install the MetScape plugin, select Plugins Æ Manage Plugins from the
Cytoscape menu.
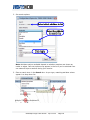
4. Under Available for Install, click the + box to expand the Network and
Attribute I/O group.
Click to expand the Network
and Attribute I/O group
Metscape Plugin User Guide · April 2010 · Page 3
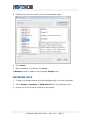
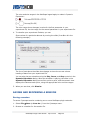
5. Find and click the most recent version of the MetScape plugin.
6. Click Install.
7. When installation is complete, click Close.
A MetScape option is added to the Cytoscape Plugins menu.
ENTERING DATA
1. To begin a Cytoscape session with the MetScape plugin, first start Cytoscape.
2. Select Plugins Æ MetScape Æ Build Network from the Cytoscape menu.
3. Choose one of the following methods to get started.
Metscape Plugin User Guide · April 2010 · Page 4
Option 1: Enter a list of compounds
Use to explore a network of compounds and reactions, starting from a list of
compounds.
1. Click the Enter Compound(s) tab.
2. To identify compounds, you can enter compound names or KEGG compound IDs.
To enter KEGG IDs, select KEGG IDs from the Input Type dropdown:
Metscape Plugin User Guide · April 2010 · Page 5
3. In the text box, enter or paste compound names or KEGG IDs, each on its own
line.
Examples:
Compound names
KEGG compound IDs
If you need to look up a compound name or ID, click Compound Lookup. On
the resulting NCIBI compound lookup page, use your browser’s Find (Ctrl-F)
command to enter the name or ID to find the row that contains both.
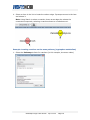
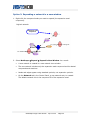
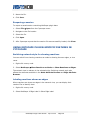
4. Select a network style by selecting either Show Reactions as Nodes or Show
Reactions as Edges.
Metscape Plugin User Guide · April 2010 · Page 6
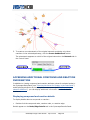
With Show Reactions as Nodes, the network will consist of the queried
compounds, reactions in which they participate, and any other compounds
involved in those reactions, all shown as nodes.
With Show Reactions as Edges, the network will consist of the queried
compounds and the nearest-neighbor compounds shown as nodes, and the
reactions they share shown as edges.
Examples of resulting networks:
Reactions and compounds as
nodes:
Reactions as edges,
compounds as nodes:
5. Click Search to query the metabolic database and create the network.
Option 2: Load an experiment file
Use to upload experimental data to visualize and explore compound networks over
time or in varying experimental conditions.
The data file must meet the following requirements:
•
The data should be normalized.
•
The file must be a text file with:
•
−
Columns separated by tabs.
−
Rows separated by new lines (each row on its own line).
The first row must be a heading row, in which:
−
The first column indicates the number of parameters.
−
The remaining columns in the first row are column headings to label the data,
one set of column headings for each parameter.
Metscape Plugin User Guide · April 2010 · Page 7
•
All other rows contain experimental data, in which:
−
The first column contains a KEGG compound ID.
−
The remaining columns contain data, one set of data values for each
parameter.
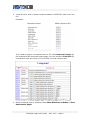
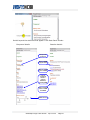
Example:
Number of parameters
Column headings for parameter 1
Column headings for parameter 2
Data
KEGG IDs
Data for parameter 1
Data for parameter 2
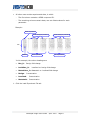
In this example, the column headings are:
•
Ben_fc:
Benign fold change
•
LocVsBen_fc:
•
MetasVsLoc_fc: Metastatic vs. localized fold change
•
Benign:
•
Localized:
•
Metastatic: Concentration
Localized vs. benign fold change
Concentration
Concentration
1. Click the Load Experiment File tab.
Metscape Plugin User Guide · April 2010 · Page 8
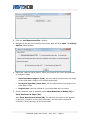
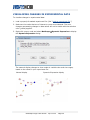
2. Click the Load Experiment File… button.
3. Navigate to the text file containing experiment data and click Open. The Scaling
Options dialog appears:
4. Optionally, select a scaling option, which may improve the visual representation
of changes in data:
•
Scale input data range to (0,10). Use this scaling method when the range
of the input data is large or not normally distributed.
•
Ln(natural logarithm) input data. Use this method when the range of the
input data is large.
•
Original data. Use this method to use original data with no scaling.
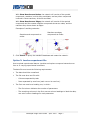
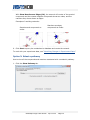
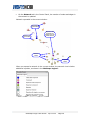
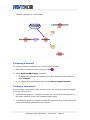
5. Select a network style by selecting either Show Reactions as Nodes (CR) or
Show Reactions as Edges (CO).
With Show Reactions as Nodes (CR), the network will consist of the queried
compounds, reactions in which they participate, and any other compounds
involved in those reactions, all shown as nodes.
Metscape Plugin User Guide · April 2010 · Page 9
With Show Reactions as Edges (CO), the network will consist of the queried
compounds and the nearest-neighbor compounds shown as nodes, and the
reactions they share shown as edges.
Examples of resulting networks:
Reactions and compounds as
nodes:
Reactions as edges,
compounds as nodes:
6. Click Start to query the metabolomics database and create the network.
To work with your experiment data, see “Visualizing Changes in Experimental Data.”
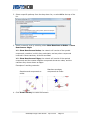
Option 3: Select a pathway
Use to view all the compounds and reactions associated with a metabolic pathway.
1. Click the Show Pathway tab.
Metscape Plugin User Guide · April 2010 · Page 10
2. Select a specific pathway from the drop-down list, or select All at the top of the
list.
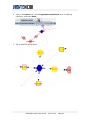
3. Select a network style by selecting either Show Reactions as Nodes or Show
Reactions as Edges.
With Show Reactions as Nodes, the network will consist of the queried
compounds, reactions in which they participate, and any other compounds
involved in those reactions, all shown as nodes.
With Show Reactions as Edges, the network will consist of the queried
compounds and the nearest-neighbor compounds shown as nodes, and the
reactions they share shown as edges.
Examples of resulting networks:
Reactions and compounds as
nodes:
Reactions as edges,
compounds as nodes:
4. Click Draw Pathway to create the network.
Metscape Plugin User Guide · April 2010 · Page 11
CHOOSING ATTRIBUTES FOR DISPLAY IN THE DATA
PANEL
Attributes of compounds and reactions you have selected in the network appear in
the Cytoscape Data Panel.
Choosing attributes provided through MetScape
To choose which attributes to view:
1. To choose attributes for compounds, click the Node Attribute Browser tab in
the Data Panel. Choose attributes for reactions based on the network style:
•
If the style is Show Reactions as Nodes, click the Node Attribute Browser
tab.
•
If the style is Show Reactions as Edges, click the Edge Attribute Browser
tab.
2. Click the Select Attributes icon in the Data Panel toolbar.
3. Select the attributes you want displayed in the Data Panel.
Notes:
•
When both compounds and reactions are shown as nodes, you can use the
Type attribute on the Node Attribute Browser tab to distinguish between
them.
Metscape Plugin User Guide · April 2010 · Page 12
•
Some attributes (such as Formula, Mass, and Smile) apply only to compound
nodes, while others (such as Enzyme, Pathway, and Reversibility) apply only
to reaction nodes.
•
Switching from one network style to another using Show Reactions as
Nodes or Show Reactions as Edges may leave behind reaction attribute
columns on either the Node Attribute Browser or Edge Attribute Browser
tab.
•
Other plugins used earlier in your Cytoscape session may leave behind
attributes that don’t apply to MetScape compound or reaction data.
4. When you are done, click anywhere outside the list.
5. Select compounds and/or reactions to view their attributes in the Data Panel (see
“Selecting Compounds and Reactions”).
Metscape Plugin User Guide · April 2010 · Page 13
Rearranging attributes in the Data Panel
To reorder attributes in the Data Panel, click an attribute column heading and drag it
to a new location:
To sort by an attribute, click the attribute column heading; to sort in the reverse
direction, click again.
Metscape Plugin User Guide · April 2010 · Page 14
NAVIGATING A NETWORK
Navigating among networks
To navigate among multiple open networks, use the Network tab in the Cytoscape
Control Panel.
To view a network, click on its entry on the Network tab.
Note: The default network title is a list of its initial seed compounds. To edit a title,
right-click the network entry and select Edit Network Title.
For more information about working with networks and the Network tab, see the
Cytoscape User Manual.
Metscape Plugin User Guide · April 2010 · Page 15
Navigating within a network
To navigate within a network, use the network overview pane at the bottom of the
Network tab in the Cytoscape Control Panel.
To view another part of the network, click on the shaded area in the network
overview pane and drag it into place.
To adjust the view magnification, use the Zoom tools in the Cytoscape toolbar:
and Zoom In
.
•
Zoom Out
•
Zoom Selected Region
. Make one or more selections using any Cytoscape
method, then click this tool to display the region that encompasses all of them.
•
Zoom Entire Network
.
For more information about zooming and using the network overview pane, see the
Cytoscape User Manual.
Metscape Plugin User Guide · April 2010 · Page 16
Locating compounds or reactions within a network by
searching
You can locate and select a specific compound or reaction within a network by using
the Search feature of Cytoscape. You can also use search to find a group of
compounds or reactions with common attribute values. Search is especially useful
with large, complex networks.
Limitations of the Search feature in Cytoscape:
•
•
•
For a successful match, the search term must match the entire attribute value.
For example, the following Enzyme attributes do not match:
−
2.3.1.65 [Bile acid-CoA:amino acid N-acyltransferase.]
−
2.3.1.65 [Bile acid-CoA:amino acid N-acyltransferase.]; 6.2.1.- [Acid--thiol
ligases.]
For a successful match, the search term must match the attribute value from the
start of the string—you cannot match a substring within an attribute value. For
example, the search term taurine matches the first attribute value below, but
not the second:
−
taurine+deoxycholoyl-CoA = CoA+H('+)+3"a",12"a"-dihydroxy-5"b"-cholan24-oyl-taurine
−
(5-L-Glutamyl)-peptide+Taurine=Peptide+5-Glutamyl-taurine
Search does not support logical operators, wildcards, or other advanced search
features.
Note: For more flexible and powerful searching, including logical operators and
wildcards, you can use the Enhanced Search plugin for Cytoscape. For more
information, see the Analysis group of plugins on the Cytoscape Plugins page.
To search for compounds or reactions:
1. Click
(Configure search options) to the right of the Search box in the
Cytoscape toolbar.
Metscape Plugin User Guide · April 2010 · Page 17
2. Set search options.
Note: Attribute options available depend on whether reactions are shown as
nodes or edges. Left-over options may appear in the list if you’ve switched from
one network style to another during your session.
3. Enter a search term in the Search box. As you type, matching attribute values
appear in a drop-down list.
Metscape Plugin User Guide · April 2010 · Page 18
4. Select an item in the list to locate the node or edge. Cytoscape zooms to the item
and selects it.
Note: Using Search to select a reaction shown as an edge also selects the
connected compounds; selecting a reaction shown as a node does not.
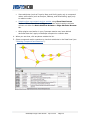
Example: Locating reactions on the same pathway (tryptophan metabolism)
1. Select the Pathway attribute for reactions (in this example, shown as nodes).
Metscape Plugin User Guide · April 2010 · Page 19
2. Type in the Search box, select Tryptophan metabolism (with 5 matching
reactions), and press Enter.
3. The 5 reactions are selected.
Metscape Plugin User Guide · April 2010 · Page 20
4. The Data Panel displays attributes for the selected reactions.
Locating compounds or reactions using the Data Panel
You can locate compounds and reactions in the network by selecting their attributes
in the Data Panel.
1. Click the Node Attribute Browser or Edge Attribute Browser tab in the Data
Panel.
2. Select attribute rows for the nodes or edges you want to locate.
•
Click on a single row to highlight a single compound or reaction.
•
Use Ctrl-click to select multiple discontiguous rows.
•
Use Shift-click to select a range of contiguous rows.
Metscape Plugin User Guide · April 2010 · Page 21
3. For selected rows, the corresponding compounds and/or reactions are highlighted
in green in the network view. (See “Selecting Compounds and Reactions.”)
Metscape Plugin User Guide · April 2010 · Page 22
SELECTING COMPOUNDS AND REACTIONS
Use Cytoscape methods to select nodes representing compounds and reactions
(when shown as nodes) and edges representing reactions (when shown as edges).
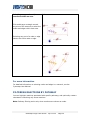
Selecting a single compound or
reaction shown as a node
Click the compound or reaction
node.
A selected node appears in yellow.
Selecting a single reaction
shown as an edge
Click and drag a rectangle around
any segment of the reaction edge,
then release the left mouse button.
A selected edge appears in red.
Selecting multiple compounds
and/or reactions
Hold down the Shift key while
clicking on nodes and/or edges
and/or while dragging rectangles
around them.
Metscape Plugin User Guide · April 2010 · Page 23
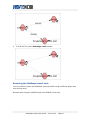
Selecting compounds and/or
reactions within an area
Before
Click and drag a rectangle around
any area of the network to select the
nodes and edges within that area.
Selecting any part of a node or edge
selects the entire node or edge.
After
For more information
For detailed information on selecting nodes and edges in a network, see the
Cytoscape User Manual.
FILTERING REACTIONS BY PATHWAY
You can highlight reactions associated with specific pathways, and optionally create a
subnetwork containing only those reactions.
Note: Pathway filtering works only when reactions are shown as nodes.
Metscape Plugin User Guide · April 2010 · Page 24
To filter reactions by pathway:
1. Right-click on any node (compound or reaction).
2. Select MetScape Æ Pathway Filter to display the MetScape Filter tab in the
Cytoscape Control Panel.
3. Select one or more pathways of interest.
4. Click the Filter button at the bottom of the MetScape Filter tab to highlight
reactions in the network that are in the selected pathways.
All connected edges to matching reactions and compounds are highlighted in red.
Metscape Plugin User Guide · April 2010 · Page 25
5. To create a new subnetwork of the original network containing only those
reactions in the selected pathways, click the Create SubNetwork button.
The subnetwork appears as a child of the original network on the Network tab in
the Control Panel.
ACCESSING ADDITIONAL COMPOUND AND REACTION
INFORMATION
In addition to viewing compound and reaction attribute values for selected nodes in
the Cytoscape Data Panel (see “Choosing Attributes for Display in the Data Panel”)
and displaying attributes by hovering the mouse cursor (see “MetScape plugin
selection behavior”), you can display additional information and link to external
databases.
Displaying compound and reaction details
To display details about a compound or reaction:
•
Double-click the compound node, reaction node, or reaction edge.
Details appear on the Node/Edge Details tab in the Cytoscape Results Panel.
Metscape Plugin User Guide · April 2010 · Page 26
Details beyond the attributes that appear in the Data Panel include:
Compound details:
Reaction details:
Compound
synonyms
Links to KEGG
enzyme entries
Links to related
genes in MiMI
Links to
compound
entries in
external
databases,
including MiMI
Links to reaction
entries in MiMI
and KEGG
KEGG structure
Metscape Plugin User Guide · April 2010 · Page 27
WORKING WITH NETWORKS
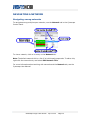
Expanding a network
From a compound node, you can expand the current network to include additional
reactions and related compounds.
Option 1: Expanding a network in the current network window
1. Right-click the compound node you want to expand (the expansion seed
compound).
Original network:
Expansion seed
compound
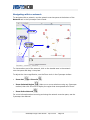
2. Select MetScape Æ Expand Æ Expand in Current Window. As a result:
•
The current network view may be redrawn.
•
The expansion seed compound may appear in a different location in the
redrawn network view.
•
Additional compounds and reactions are added to the current network.
Metscape Plugin User Guide · April 2010 · Page 28
•
On the Network tab in the Control Panel, the number of nodes and edges in
the network is updated.
Network expanded in the current window:
Compounds in
original network
Expansion seed
compound now
appears here in the
redrawn network
Reactions in
original network
Reactions
added
Compounds
added
When you expand a network in the current window, the network view includes
additional symbols, as shown in the MetScape Legend:
Metscape Plugin User Guide · April 2010 · Page 29
Option 2: Expanding a network in a new window
1. Right-click the compound node you want to expand (the expansion seed
compound).
Original network:
Expansion seed
compound
2. Select MetScape Æ Expand Æ Expand in New Window. As a result:
•
A new network is created in a new network view window.
•
The new network includes only the expansion seed compound and its related
compounds and reactions.
•
Nodes and edges appear using standard symbols, not expansion symbols.
•
On the Network tab in the Control Panel, a new network entry is created.
The default network title is the compound ID of the expansion seed.
Metscape Plugin User Guide · April 2010 · Page 30
Network expanded in a new window:
Collapsing a network
To collapse a network expanded in a current network window:
1. Right-click an expansion seed compound node
.
2. Select MetScape Æ Collapse, and then:
•
To collapse only the branch expanded from that expansion seed compound,
select Collapse.
•
To collapse all expanded branches, select Restore Original Network.
Creating a subnetwork
You can create a subnetwork (child network) of the current network that will appear
in its own network view:
•
A subnetwork based on a compound includes the compound and all reactions in
the parent network in which the compound participates.
•
A subnetwork based on a reaction includes the reaction and all compounds in the
parent network that participate in the reaction.
Metscape Plugin User Guide · April 2010 · Page 31
Note: A subnetwork will include any nodes and edges highlighted (nodes in yellow,
edges in red) at the time you create the subnetwork. This includes any nodes or
edges that are currently selected. If you want a subnetwork based on a single
compound or reaction as described above, first clear all selections by clicking any
blank area of the network view.
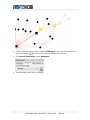
1. In the network view, select the compound or reaction on which you want to base
the subnetwork. Nodes highlighted in yellow and edges highlighted in red will
become part of the subnetwork.
2. Right-click the node and select MetScape Æ Create Subnetwork. Be careful
not to move the cursor outside the bounds of the gray menu panels while
navigating the cascading menu—doing so will remove the highlighting of the
nodes and edges and the result will be an empty subnetwork.
Correct
Incorrect
Cursor outside
menu
Metscape Plugin User Guide · April 2010 · Page 32
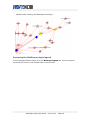
The newly created subnetwork appears in its own network view window, and is
added as a subnetwork (child) of the original (parent) network on the Network
tab in the Control Panel:
See also “Filtering Reactions by Pathway” for information on creating a subnetwork
from a pathway filter.
Destroying a network
To destroy a network you no longer need:
1. Make sure you want to destroy the network:
•
Cytoscape will not ask you to confirm the deletion.
•
Destroying the network is irreversible.
•
Note: If you want to destroy a network view without destroying the network
itself, use Destroy View instead of Destroy Network. See the Cytoscape
User Manual for more information.
2. On the Network tab in the Control Panel, right-click on the network you want to
destroy (the network does not need to be selected), and select Destroy
Network.
Note: If you destroy a network that has subnetworks, the subnetworks are not
destroyed. They are promoted up one network level.
Metscape Plugin User Guide · April 2010 · Page 33
VISUALIZING CHANGES IN EXPERIMENTAL DATA
To visualize changes in experimental data:
1. Load a properly formatted experiment file. (See “Load an experiment file.”)
2. Make sure the nodes that are of interest to you are not selected. The color
changes representing changes in data values will not be visible with the selection
color (yellow) applied.
3. Right-click on any node and select MetScape Æ Dynamic Expression to display
the Dynamic Expression dialog:
The network display changes to show nodes in variable color and size ranges,
based on the values in your experiment file:
Normal display
Dynamic Expression display
Metscape Plugin User Guide · April 2010 · Page 34
The color and size ranges in the MetScape legend apply to nodes in Dynamic
Expression:
The color range shows changes in value for the first parameter in your
experiment file, the size range for the second parameter in your experiment file.
4. To visualize your experiment file data, you can:
Show values of a particular data set by moving the slider (from 0 to 1 in the
following example):
The line of text above the slider also changes to show the current column
heading of data from your experiment file.
You can also play an animation using the Play, Pause, and Stop controls in the
Dynamic Expression dialog. When an animation is playing, the slider in the
Dynamic Expression dialog moves from point to point, and the network view
displays the values at each point, using the appropriate color and size ranges.
5. When you are done, click Dismiss.
SAVING AND REOPENING A SESSION
Saving a session
To save a Cytoscape session containing one or more MetScape plugin networks:
1. Select File Æ Save (or Save As…) from the Cytoscape menu.
2. Browse to a location for the session file.
Metscape Plugin User Guide · April 2010 · Page 35
3. Name the file.
4. Click Save.
Reopening a session
To reopen a saved session containing MetScape plugin data:
1. Select File Æ Open from the Cytoscape menu.
2. Navigate to the file location.
3. Select the file.
4. Click Open.
5. After Cytoscape reports that the session file was successfully loaded, click Close.
USING METSCAPE PLUGIN-SPECIFIC FEATURES IN
CYTOSCAPE
Switching network style for showing reactions
You can switch from showing reactions as nodes to showing them as edges, or vice
versa.
1. Right-click on any node.
2. Select MetScape Æ Show Reactions as Nodes or Show Reactions as Edges.
The network view is redrawn in the selected style. Switching network style also
affects the attributes available in the Node Attribute Browser and Edge Attribute
Browser.
Labeling reactions shown as edges
When reactions are shown as edges in the network view, you can display their
reaction IDs to identify them.
1. Right-click on any node.
2. Select MetScape Æ Edge Label Æ Show Edge Label.
Metscape Plugin User Guide · April 2010 · Page 36
3. To hide the IDs, select Hide Edge Label instead.
Restoring the MetScape visual style
You may need to restore the MetScape visual style after using a different plugin that
uses its own style.
Network after using the MCODE plugin with MCODE visual style
Metscape Plugin User Guide · April 2010 · Page 37
1. In the Cytoscape Control Panel, click the VizMapper™ tab. You may need to use
at the top of the Control Panel to see the tab.
the scroll arrows
2. For Current Visual Style, select MetScape:
3. The MetScape visual style is restored:
Metscape Plugin User Guide · April 2010 · Page 38
Network after resetting the MetScape visual style
Accessing the MetScape plugin legend
In the Cytoscape Results Panel, click the MetScape Legend tab. You may need to
use the scroll arrows in the Results Panel to see the tab.
Metscape Plugin User Guide · April 2010 · Page 39
•
Reaction symbols in the legend apply to reactions when shown as nodes.
•
Color and size range symbols apply to Dynamic Expression displays (see
“Visualizing Changes in Experimental Data”).
Note: If you open a saved Cytoscape session, the MetScape Legend tab does not
appear in the Results Panel until you use the MetScape plugin to enter data in a new
query.
Metscape Plugin User Guide · April 2010 · Page 40