1
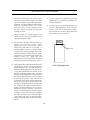
Table of Contents
Introduction to the PetroFLAG Hydrocarbon Analysis System . . . . . . . . . . . . . . . . . . . . . . . . . . . . . . . 3
Using the PetroFLAG System . . . . . . . . . . . . . . . . . . . . . . . . . . . . . . . . . . . . . . . . . . . . . . . . . . . . . . . . . . . . 5
Choosing the Correct Response Factor . . . . . . . . . . . . . . . . . . . . . . . . . . . . . . . . . . . . . . . . . . . . 5
Analyzing High Concentration Samples . . . . . . . . . . . . . . . . . . . . . . . . . . . . . . . . . . . . . . . . . . . 6
Converting Response Factors for Data Already Collected . . . . . . . . . . . . . . . . . . . . . . . . . . . 6
Temperature Effects on Measurements . . . . . . . . . . . . . . . . . . . . . . . . . . . . . . . . . . . . . . . . . . . . 6
Effects of Soil Water Content on PetroFLAG Result . . . . . . . . . . . . . . . . . . . . . . . . . . . . . . . . . 7
Sample Preparation . . . . . . . . . . . . . . . . . . . . . . . . . . . . . . . . . . . . . . . . . . . . . . . . . . . . . . . . . . . . . 8
Calibration . . . . . . . . . . . . . . . . . . . . . . . . . . . . . . . . . . . . . . . . . . . . . . . . . . . . . . . . . . . . . . . . . . . . 8
Preparing Blanks and Standards . . . . . . . . . . . . . . . . . . . . . . . . . . . . . . . . . . . . . . . . . . . . . . . . . . 8
QA/QC
...................................................................... 8
The PetroFLAG Test Procedure . . . . . . . . . . . . . . . . . . . . . . . . . . . . . . . . . . . . . . . . . . . . . . . . . . . . . . . . . . 10
Analyzer Operation . . . . . . . . . . . . . . . . . . . . . . . . . . . . . . . . . . . . . . . . . . . . . . . . . . . . . . . . . . . . . . . . . . . . . 11
Selecting a Calibration Curve . . . . . . . . . . . . . . . . . . . . . . . . . . . . . . . . . . . . . . . . . . . . . . . . . . . . 11
Reading the Blank and Standard . . . . . . . . . . . . . . . . . . . . . . . . . . . . . . . . . . . . . . . . . . . . . . . . . . 12
Taking a Reading . . . . . . . . . . . . . . . . . . . . . . . . . . . . . . . . . . . . . . . . . . . . . . . . . . . . . . . . . . . . . . . 12
Power Requirement . . . . . . . . . . . . . . . . . . . . . . . . . . . . . . . . . . . . . . . . . . . . . . . . . . . . . . . . . . . . . 12
Analyzer Operation Examples . . . . . . . . . . . . . . . . . . . . . . . . . . . . . . . . . . . . . . . . . . . . . . . . . . . . . . . . . . . . 13
Standard Operation . . . . . . . . . . . . . . . . . . . . . . . . . . . . . . . . . . . . . . . . . . . . . . . . . . . . . . . . . . . . . 13
Standard Operation - Changing Response Factor Without Recalibrating . . . . . . . . . . . . . . . 13
Standard Operation With Recalibration . . . . . . . . . . . . . . . . . . . . . . . . . . . . . . . . . . . . . . . . . . . . 14
Special Operating Conditions . . . . . . . . . . . . . . . . . . . . . . . . . . . . . . . . . . . . . . . . . . . . . . . . . . . . 15
Replacing Battery . . . . . . . . . . . . . . . . . . . . . . . . . . . . . . . . . . . . . . . . . . . . . . . . . . . . . . 15
Operation of the Meter After the Battery Has Been Disconnected . . . . . . . . . . . . 15
Meter Left to Turn Off in Other Mode . . . . . . . . . . . . . . . . . . . . . . . . . . . . . . . . . . . . . 15
Helpful Suggestions and Safety Precautions . . . . . . . . . . . . . . . . . . . . . . . . . . . . . . . . . . . . . . . . . . . . . . . 16
Appendix A: PetroFLAG Response Curves . . . . . . . . . . . . . . . . . . . . . . . . . . . . . . . . . . . . . . . . . . . . . . . . 18
Appendix B: Comparison with Laboratory Methods . . . . . . . . . . . . . . . . . . . . . . . . . . . . . . . . . . . . . . . . . 19
Appendix C: Determining the Response Factor for Hydrocarbons Not Listed in Table 1 . . . . . . . . . . 20
Appendix D: Error Conditions . . . . . . . . . . . . . . . . . . . . . . . . . . . . . . . . . . . . . . . . . . . . . . . . . . . . . . . . . . . . 21
Appendix E: Meter Specifications . . . . . . . . . . . . . . . . . . . . . . . . . . . . . . . . . . . . . . . . . . . . . . . . . . . . . . . . 22
Meter Warranty
. . . . . . . . . . . . . . . . . . . . . . . . . . . . . . . . . . . . . . . . . . . . . . . . . . . . . . . . . . . . . . . . . . . . . . 23
PetroFLAG is a registered trademark of Dexsil Corporation, US Patents 5,756,357 & 5,928,950 and 6,117,682
Ver.1 Rev. 1 04/09
1
2
Introduction to the PetroFLAG® Hydrocarbon Analysis System
NOTE: PLEASE READ THE ENTIRE MANUAL
BEFORE ATTEMPTING TO RUN THIS TEST
many other factors such as the soil type, water
content, pH, etc. Many EPA SW-846 methods use
chlorinated solvents or Freon as extraction solvents.
These solvents were originally chosen for their
extraction efficiency of polar organic compounds and
may not be appropriate for hydrocarbons.
Furthermore, special measures need to be taken with
these lab methods when the soil is wet.2 The
extraction efficiencies may be as low as 1% 3 in some
cases.
The PetroFLAG hydrocarbon analysis system is a
broad spectrum field analytical tool suitable for any
type of hydrocarbon contamination regardless of the
source or state of degradation 1. Unlike other field
screening methods, the PetroFLAG system does not
target specific compounds such as BTEX (Benzene,
Toluene, Methylbenzene and Xylene) or PNAs (PolyNuclear Aromatics) that may be part of some
hydrocarbon mixture. This makes the PetroFLAG
system a very versatile analytical method that can be
used on most hydrocarbon spills without prior
knowledge of the BTEX or PNA content of the
contaminant. The PetroFLAG system uses patented
chemis try to respond to the broadest range of
hydrocarbons possible. The PetroFLAG system is
most sensitive to heavier hydrocarbons such as oils
and greases and less sensitive to the lighter more
volatile hydrocarbon fuels. The specially designed
PetroFLAG analyzer allows the user to select, in the
field, the response factor that is appropriate for the
suspected contaminant at each site. The response
factors for a number of contaminants are listed in
Table 1. Using the selected response factor, the
analyzer compensates for the relative response of
each analyte and displays the correct concentration
in ppm. The response curves for some typical
hydrocarbon contaminants are plotted in Appendix
A.
The extraction solvent used in the PetroFLAG system
has been carefully developed to give consistent
extraction efficiencies over the range of soil types
and conditions most commonly encountered in the
field. The PetroFLAG solvent system contains no
chlorofluorocarbons or chlorinated solvents. The
extraction efficiency is unaffected by soil moisture
and, in most cases, is up to 15%(w/w).4
Because the PetroFLAG system has such a broad
response spectrum, there are situations where it will
indicate a higher hydrocarbon concentration than
other methods. This can be due to the higher
extraction efficiency of the PetroFLAG extraction
solution or the broader response range of the
detection system. SW-846 method 8015B, for
example, targets only a very narrow range of
2
USEPA SW846 Method 3550A Ultrasonic
Extraction Rev 1, November 1992
All chemical methods for hydrocarbon analysis in
soil that are currently in use, whether they be field
screening or laboratory methods, depend on solvent
extraction to remove the hydrocarbons from the soil
sample. The extraction efficiency for each method is
a function of the solvent used and the extraction
procedure. This efficiency is also dependent on
3
Lee, W.E. III, Houchin, C.A. and Albergo, N.,
"TRPH Discrimination of Petroleum and Nonpetroleum Organic Materials", American
Environmental Lab, December 1993.
4
The presence of water will cause a dilution
effect resulting in a lower response. This effect
can be corrected for, if the water content is
known. (For a more complete discussion see
“Using the PetroFLAG System: Effects of Soil
Water Content on PetroFLAG Result”)
1
Brake fluid, phosphate ester based hydraulic oil,
and other soluble fluids, will not be detected by
the PetroFLAG system.
3
hydrocarbons typically in the "Diesel" or "Gasoline"
range (DRO or GRO). This method does not detect
oils or greases unless the analyst changes the
method and specifically looks for the heavier
compounds. Requesting 8015B for diesel range
hydrocarbons may result in under reporting of the
actual total hydrocarbon contamination when oils or
greases are present. Method 418.1 is a more general
method and detects any Freon extractable
compounds that contain a C-H bond. This method
has relatively poor extraction efficiencies with many
soil types. For a more complete discussion of the
comparability of hydrocarbon methods see Appendix
B.
specification for the method. When using a lab that
is new to you, send them proficiency samples of
known concentrations and varying water content.
Lab results often contain one or more samples that
are designated "ND" (none detected) without a
qualifier. This type of reporting is misleading
because information on the limit of quantification is
not included. The designation "ND" never means
zero ppm and should be followed by an indication of
the detection limits of the method used to obtain the
result, e.g., ND<40 ppm. In many cases the detection
limits for a method will vary with sample size, dilution
factors or extraction procedures and may not be the
same for all samples in the sample batch. The
detection limits for some of the common lab TPH
methods are on the order of 40-50 ppm. Therefore,
when comparing laboratory data it is important to
know the realized detection limits implied in any
"ND" results.
Since the PetroFLAG system responds to the full
range of hydrocarbons it will also detect some
naturally occurring hydrocarbon-like compounds.
(Method 418.1 uses a silica column to remove some
of these compounds, but will still detect naturally
occurring terpenes and creosotes, etc.) Therefore, in
situations where high organic content is suspected,
background levels outside the spill site should be
determined. This will help to identify any naturally
occurring sources of hydrocarbons that may cause a
positive interference with the test. In cases where
there exists a high natural organic background, a
"Background Correction" can, in limited
circumstances, be used to correct readings for this
positive interference. Note: Because of the broad
spectrum screening nature of the test, naturally
occurring waxes and oils can cause high readings;
however, false negatives or under-reported levels are
very unlikely.
The PetroFLAG system is a valuable field analytical
tool when used as part of a systematic sampling plan.
As part of any site work, always have the
hydrocarbon contamination characterized at some
point during the project by for example, sending
confirmation samples for closure to a certified
laboratory. Since each laboratory method for
petroleum hydrocarbons has a different target
analyte and different response characteristics, use
only appropriate methods for comparison.
Furthermore, since the proficiency of laboratory
methods for petroleum hydrocarbons varies from one
laboratory to another; it is important to verify that the
lab you use is proficient with the method you
request. Always ask for QA/QC data and verify that
the blanks, duplicates and spikes are within
4
Using the PetroFLAG System
The PetroFLAG analyzer has been specifically
Choosing the Correct Response Factor
designed to be used with the unique patented
chemistry of the PetroFLAG system. The meter is
The microprocessor in the PetroFLAG analyzer uses
shipped fully calibrated, preset with response factor
the calibration data to convert the optical reading
5. This calibration is sufficient to begin screening
into a preliminary concentration. The selected
measurements; however, in
response factor is then
Table 1: Response Factors and Method
order to achieve optimum
used to calculate the
Detection Limits for Common
performance we recommend
correct concentration for
Hydrocarbons
that the analyzer be calibrated
the analyte of interest.
with each batch of samples, or
Therefore, it is important
Hydrocarbon Type
Method
Response
at least daily. The PetroFLAG
to choose the response
Detectio
Setting
analyzer is easy to calibrate and
factor that is appropriate
n Limit
a calibration standard is
for the particular
(ppm)
included with every refill pack.
hydrocarbon or class of
Transformer Oil
15
10
hydrocarbons present at
The PetroFLAG analyzer stores
the site. The response
Grease
15
9
two independent calibration
factor can be changed at
equations in separate memory
Hydraulic Fluid
10
8
any time without affecting
locations. Each calibration has
the stored calibrations.
Transmission Fluid
19
8
a unique designation, "1C" or
(See “Analyzer Operation
"2C". One way to effectively
Examples: Standard
Motor Oil
19
7
use this feature is to use one
Operation-Changing
#2 Fuel Oil
25
7
for a “low temp.” calibration
Response Factor Without
and one for a “high temp.”
Recalibrating”)
#6 Fuel Oil
18
6
calibration. This practice is
very useful when working at
If the contaminant is
Diesel Fuel
13
5
field locations where the
known or suspected,
Gear Oil
22
5
ambient temperature varies by
choose the appropriate
more than 10oC over the course
response factor from
Low Aromatic Diesel
27
4
of the day. One calibration, run
Table 1 and set that
Pennsylvania Crude
20
4
at the lower temperature in the
response factor on the
Oil
morning, could be stored under
analyzer. (See “Analyzer
“1C” and later as the
Operation” below.)
If
Kerosene
28
4
temperature rises, triggering a
there is a mixture of
temperature warning, a new
Jet A
27
4
hydrocarbons, use the
calibration can be run and
most conservative
Weathered Gasoline
200* +
2
stored under “2C”. (See below
response factor (i.e. the
under “Temperature Effects”)lowest) for the
*See Appendix A
+Due to the non-linear response curve of Gasoline, quantification below
contaminants known to be
1000 ppm may underestimate the true contamination
present.
If the
contaminants are
unknown, choose a conservative response factor
based on those hydrocarbons that are likely to be
on the site. Examination of Table 1, indicates that
the majority of typical contaminants are in response
category 5 or above.
5
Analyzing High Concentration Samples
Converting Response Factors for Data Already
Collected
The PetroFLAG Hydrocarbon Analyzer is preprogrammed to warn the user of an over-range
condition. If the over-range reading is outside of
the linear range (±10 precision), but still within the
quantifiable range (±20% precision), the reading will
be displayed blinking. This reading can be used as
an indication that the concentration in the sample is
not less than the displayed value. Since the
response curve for most analytes is non-linear at
high concentrations, the concentration in the
sample may be higher than the displayed value. If
the over-range condition is outside of the
quantifiable range of the meter, the display will
show a blinking "EEEE". Either error indication can
be cleared by simply inserting the next vial and
pressing the <READ/ON> key.
Collected data can be easily converted to the correct
reading when it has been determined that the wrong
response factor has been used. To make this
conversion, multiply the measured value by the
response factor initially used to make the
measurement and divide by the new response
factor.
Temperature Effects on Measurements
The PetroFLAG analyzer is equipped with an
onboard temperature sensor to measure the ambient
temperature while measurements are being made.
The software uses the temperature readings to
correct the optical readings for drift caused by the
temperature fluctuations. The corrections have
been determined for their effects on the turbidity
development and the temperature drift of the
electronics.
Accurate results can be difficult to obtain when 10
gram soil samples with high contaminant
concentrations are used since they may cause a
over-range condition on the PetroFLAG analyzer.
To quantify these high contaminant samples,
extract fresh soil samples of 1 gram size and
reanalyze. Then multiply the result by 10 to obtain
the concentration in the sample. Using this
procedure, it is possible to measure oils containing
up to 50,000 ppm of light hydrocarbon
contamination or 10,000 ppm of a heavier
hydrocarbon.
For readings at higher
concentrations, a “high range kit” is available.
The PetroFLAG analyzer can be used at
temperatures from 4oC to 45 oC. The temperature
corrections are valid for temperatures within 10oC of
the calibration temperature. If a calibration is run
with each batch of samples, the temperature
correction is not significant and measurements can
be made at any temperature within the usable range
of the instrument. However, if no calibration is run
and the ambient temperature deviates from the
calibration temperature by more than 10oC, an error
condition will result. The analyzer will display
"Err4" which can only be cleared by pressing the
<NEXT> key. Pressing of the <NEXT> key will clear
the error and display the current reading. This
reading can be recorded but it should be noted that
the ambient temperature was outside of the
acceptable 10oC window. Any other samples
remaining in the series can be read, however, the
same error condition will most likely occur. The
meter must be recalibrated to eliminate this error
condition.
NOTE: The use of either smaller samples or “high
range kits” will affect the precision and accuracy of
the method as well as raise the MDL (Minimum
Detection Limit) in proportion to the dilution factor.
The ambient temperature should be checked before
starting to avoid a temperature error when a
calibration is not run with the samples,. This can be
6
done by taking a reading without inserting a vial
into the meter. If a reading is displayed, the
temperature is within range and additional readings
can proceed. If an error is displayed, the meter must
be recalibrated before proceeding.
FW=(Wet Weight - Dry Weight)/Wet Weight
or:
FW = %water/100
The equation below can be used to achieve an
overall correction that includes both the conversion
of the PetroFLAG result to a “dry weight” value and
the correction for the dilution effect:
As previously mentioned, the storage of two
calibrations, each at a different temperature, will
reduce the number of recalibrations necessary as
the temperature changes. If the two calibrations are
stored under “1C” and “2C” and are run at
temperatures levels 20oC apart, the effective
temperature range for measurements now becomes
40oC.
R’=R((2/FS) - 1)
where:
R’ = “Dry Weight” Corrected Result
R = Result displayed by PetroFLAG unit
FS = Fraction Solids
where:
FS = (100 - %water)/100
Effects of Soil Water Content on PetroFLAG
Result
The presence of water in a soil sample will have a
definite effect on the reporting value in the final
PetroFLAG result. As with all field measurements,
the PetroFLAG system result is calculated based on
the sample weight “as received”. If there is water
present in the sample, this will produce a “wet
weight” result causing an apparent under reporting
by the PetroFLAG technique when compared to a
laboratory reporting on a “dry weight” basis.
The above correction is applicable for typical soil
types containing up to approximately 15% water by
weight. For heavy clays or samples with higher
water content, the effect of water content will vary
with the analyte and should be determined
specifically for each site.
In many cases, the effects of water content can be
overcome by using a smaller sample size. This
approach is the simplest and can be used effectively
when a reduction in precision resulting from a
smaller sample size still satisfies the overall data
quality objective.
To correct for the difference between “wet weight”
vs. “dry weight” results, simply divide the
PetroFLAG value by the “fraction solids” (FS),
where fraction solids is:
FS = Dry Weight/Wet Weight
In some soils with high water content, the
PetroFLAG response will be reduced both by the
poor extraction efficiency of the analyte and a
simple dilution. In these soils, the effect of water
content on the extraction efficiency can sometimes
be reduced by the addition of anhydrous sodium
sulfate.
or:
FS = (100 - %water)/100
Furthermore, when reporting the wet weight vs. dry
weight results, the presence of water in a soil sample
will cause a “dilution effect”. Since the PetroFLAG
solvent system is miscible with water, the water in
the soil will be extracted into the solvent phase. The
aliquot filtered into the developer vial will, therefore,
be diluted by the presence of the water. To a first
approximation, the correction for this “dilution
effect” is made by multiplying the PetroFLAG result
by one plus the “fraction water” in the sample,
R’=R(1+FW), where fraction water (FW) is:
To treat such soils with sodium sulfate, weigh out
the appropriate amount of soil sample (10 grams for
a standard analysis) followed by the addition of up
to 10 grams of anhydrous sodium sulfate. Mix the
system thoroughly by stirring and/or shaking the
sample until a free-flowing mixture is formed. Add
the extraction solvent from a break-top ampule and
then, follow the standard analysis procedure.
7
Treatment with sodium sulfate can improve the
extraction efficiency, but will not correct for either
the dilution effect or the wet weight/dry weight
reporting error. The actual water content in the
sample should be determined at some point so that
the above corrections for wet weight and the
dilution effect can be applied to the final result.
Read the step-by-step instructions below
completely before beginning the calibration process.
To prepare a blank and a calibration standard, first
label two soil tubes, one as the "blank" and the
other as the "standard". Add to the blank tube the
contents of a break-top ampule labeled “Extraction
Solvent”. Add the contents of the break-top ampule
labeled "Calibration Standard" to the standard soil
tube. Process the blank and standard exactly as soil
samples as described below. (See “The PetroFLAG
Test Procedure”)
Sample Preparation
Each 10-pack of soil reagents contains reagents and
supplies for 10 tests. In addition, one blank and one
calibration standard are included. Samples can be
run individually or by batch. For optimum
performance and throughput, samples should be run
in groups of 10 samples, once the meter has been
calibrated with a blank and a standard. The meter
does not need to be recalibrated, provided that the
operating conditions and reaction times are
maintained. Total time to analyze 10-15 samples is
approximately 20-25 minutes.
QA/QC
Performing periodic calibrations of the PetroFLAG
meter is one of the most important quality control
checks that can be made. In addition to calibrating
the PetroFLAG meter, performance of periodic
calibration also serves as a quality control check of
the entire analysis system. Each time a calibration
is performed the individual operator needs to
prepare a fresh set of standards following the entire
analysis procedure. To complete a valid calibration,
the resulting test standards must meet the QC
acceptance criteria stored in the meter. Each time a
calibration is carried out, the meter verifies if the
operator is performing the test correctly, e.g.,
following the correct order of steps in sample
preparation, holding to the timing requirements,
operating the meter correctly, etc. while the meter
checks its basic operation. As each calibration is
made, the intensity of the test solution is compared
to the stored values for acceptance. If the optics
have degraded or the electronics are out of
specification the calibration will be flagged as an
error.
Calibration
To insure accurate quantification and repeatable
results, it is recommended that the PetroFLAG meter
be recalibrated with each batch of 10 samples or, at
least, daily. The meter is easily calibrated using an
extraction solvent ampule as a blank and the
calibration standard (supplied with each ten-pack of
reagents).
After exiting the calibration mode, all additional
readings made by the PetroFLAG analyzer will
automatically incorporate the selected response
factor. Therefore, rereading of the calibration
standard will result in an incorrect reading unless
the response factor being used is 10 and within the
correct development time of the sample.
The most important factor affecting the accuracy of
PetroFLAGmeasurements is operator error followed
by the ambient temperature determination. If the
temperature varies by more than 10oC from the
calibration temperature, the accuracy of the
resulting measurement will be affected. Therefore,
during each measurement made by the meter, the
current ambient temperature is compared to the
temperature determined at calibration. If the
difference is more than 10oC, a warning is flashed
alerting the operator of the temperature drift. This
QC check is transparent to the user unless an error
condition exists.
NOTE: Once the blank and calibration standard
have been read, discard them. They will fade with
time and cannot be reused; DO NOT USE THEM TO
RECALIBRATE THE METER OR TO CHECK THE
EXISTING CALIBRATION.
Preparing Blanks and Standards
The following description summarizes the procedure
for preparing the blank and calibration standard.
8
The internal check of the optical system is also
transparent to the user. The PetroFLAG meter is
designed with two independent optical channels. If,
during a measurement, both channels do not agree,
an error condition will be generated.
Along with these QC checks, which are performed
automatically by the PetroFLAG meter, additional
QA/QC procedures should be developed to provide
assurances that the data quality objectives for each
project are met. The most important part of any SOP
(Standard Operating Procedure) should include
provisions for ensuring that confirmatory samples
are sent to a qualified lab for verification as to the
type of hydrocarbon contamination present. This
will also serve as a check of the response factor
being used. When PetroFLAG meter results are
determined to be either high or low when correlated
to laboratory data, then a new response factor
should be calculated and used. If the PetroFLAG
results are not well correlated with the lab, then the
field techniques should be examined to determine
possible sources of error. A lack of correlation may
be the result of inhomogeneous samples or may be
due to splitting technique, etc.
A program of field QA/QC should be developed that
is compatible with the competing requirements of
each user. It should include, a minimum of periodic
soil blanks, equipment blanks, soil spikes, and
dupes. Other procedures should be implemented
depending on the specific requirements of each site.
9
The PetroFLAG Test Procedure
1) Label the soil extraction tubes (plastic tubes
with colored caps) and developer vials (small
glass vials with black caps) with the appropriate
sample ID. Use the self-adhesive labels to label
the screw cap of the developer vial. Do not
write in the center 1/3 of the developer vial as
this may obscure the optical path when the
readings are made
5) If meter is off, turn on the meter by pressing
<READ/ON> key and calibrate (optional, see
Analyzer Operation).
6) To read, wipe the vial, place into the meter and
press the <READ/ON> key. Be sure that the
outside of the vial is clean before reading.
Record result on work sheet. Read vials in the
same order as they were prepared.
2) Weigh 10 grams (± 0.1 gram) samples of all
unknown soils into each of the labeled colorcapped polypropylene tubes.
3) Set timer for 5 minutes. Add one break-top
ampule of extraction solvent (blue
polypropylene top) to the first tube. Start 5
minute timer and shake for 15 seconds. A
separate ampule of extraction solvent is added
to each of the remaining sample tubes when
additional samples are being analyzed. Shake
each tube for 15 seconds ensuring that the soil
samples are fully wet. Shake each tube
intermittently for a total of 4 minutes, then allow
each tube to stand for the remaining 1 minute.
Fill Level
4) Verify that the filter disk is firmly attached to the
syringe barrel. Remove the cap from the first
labeled developer vial. Carefully decant the
liquid from the polypropylene soil tube into the
syringe barrel minimizing the transfer of soil
particles, as this may plug the filter. Insert the
plunger into the syringe barrel. Discard the first
few drops from the filter into a waste container
by pressing the plunger. Next, add the soil
extract drop-wise to the developer solution until
the meniscus just enters the neck of the vial
(see figure). Shake the vial for 10 seconds, start
the 10 minute timer and proceed to the next
sample. Read the samples as close to the 10
minute time period as possible. Record this
reading. Do NOT attempt to reread the sample
as sample variation will occur due to fading of
the solution over time. Do not let the developer
vials stand longer than 20 minutes before
reading, as this may result in lower than actual
values.
6 mL Developer Vial
10
Analyzer Operation
The PetroFLAG analyzer is controlled by a lowpower consumption micro-computer with a preloaded operating program which is stored in
EEPROM memory. The program cannot be lost
regardless of battery condition. The meter stores
two calibration curves in separate memory locations.
These calibration curves can be independently
updated and the response factors can be changed
without losing the calibrations.
push the <READ/ON> key. The display will initially
indicate the calibration curve (either “1C” or “2C”) and
the response factor (1-15) that is currently selected.
Next, the term “CALC” will flash on the screen and
after 5 seconds, the measured concentration in ppm
will be displayed.
NOTE: If the battery is disconnected and then
reconnected, the meter will automatically return to the
MAIN MENU. If the calibration curve and response
factor displayed are the desired parameters, the MAIN
MENU can be exited while retaining the calibration
data by pushing the <NEXT> key. To return to the
read mode, continue pressing the <NEXT> key until
the display shows the calibration curve and the
response factor continuously without blinking.
The PetroFLAG meter is configured to allow easy
access to the program modes. The currently active
mode is indicated on the LCD display while a
reading is in progress. The response factor and the
active calibration can be changed from the MAIN
MENU using the four keys on the keypad. The four
keys are:
SCROLL
NEXT
If you wish to exit the read mode, push the <NEXT>
key and the operation is returned to the MAIN MENU.
The <NEXT> key is also used to skip a step where a
menu selection is required. To change a flashing
menu option, push the <SCROLL> key while the
option is flashing. To store the currently flashing
menu choice, push the <SELECT> key. This stores
the current choice and moves the flashing cursor to
the next program mode.
Scrolls through menu choices.
Exits the read mode or skips a
menu option without changing or
executing. (Also used to clear
error conditions.)
Selecting a Calibration Curve
READ
ON
SELECT
OFF
Turns the meter on and starts a
reading.
Either of the two calibration curves, identified as "1C"
and "2C", can be selected from the MAIN MENU.
From either calibration curve any response factor can
be selected. To change the response factor or to recalibrate the unit, use the <NEXT> key to enter the
MAIN MENU screen. Immediately upon entering this
menu three decimal points and the response factor are
displayed. Next, the first two characters on the screen
indicates the calibration curve that is currently
selected (“1C” or “2C”) is displayed. They will blink,
indicating that a new curve may be selected. Use the
<SCROLL> key to scroll to the next calibration curve.
Push the <SELECT/OFF> key to select the curve.
Selects a menu choice. Manually
turns meter off (only in the read
mode).
When the PetroFLAG analyzer is turned on, the unit
will return to the last mode it was in prior to being
shut down. Under normal operating conditions, the
analyzer will power up in the read mode. When the
analyzer powers up in the read mode, the screen will
display the last measured value for two seconds,
and then, display the currently selected calibration
curve (“1C” or “2C”) and response factor (1-15).
The meter is now ready to resume measurement.
Simply insert a new sample vial into the meter and
The response factor will then blink. Use the
<“SCROLL> key to scroll to the desired response
factor for the target analyte and press the
<SELECT/OFF> key.
11
Reading the Blank and Standard
unit, place the screw cap over the vial, and while
pressing down on the cap (depressing the spring in
the bottom of the vial holder), rotate the cap
clockwise. Turn the cap until it is snug, but do not
over-tighten.
After the response factor has been selected, the
screen will read “CALC” for five seconds and then
display the calibration temperature.
This
temperature will remain on the screen until either the
<NEXT> key or the <READ/ON> key is pressed.
The screen will then prompt you for the "blank" vial
by displaying "-bL-". Insert the blank vial in the
meter and press the <READ/ON> key (See
"Preparing Blanks and Standards" under "Using the
PetroFLAG Hydrocarbon Analysis System). After
5 seconds the screen display should read "0" for 2
seconds. The screen will then prompt for the
calibration standard, "-CSd". Insert the calibration
standard in the meter, press the <READ/ON> key
and after 5 seconds, the calibration is complete. The
meter will then re-read the calibration standard to
verify a valid calibration and display "1000". If the
concentration of the calibration standard is not
correct using the newly calculated equation, an error
message will flash until the <NEXT> key is pushed.
If an error condition exists, the previously stored
calibration constants will be retained until a valid
calibration is completed (See Appendix C, Table 1:
Error Conditions).
Power Requirement
The PetroFLAG analyzer is powered by one 9V
alkaline battery (included). This battery should last
for several thousand readings. If a low battery
condition exists "LP" will appear on the display.
Taking a Reading
After calibration, the meter will then display the
calibration curve in use (“1C” or “2C”) and the
current response factor selected. The meter is ready
to read the first sample by inserting the sample vial
into the meter and pressing the <READ/ON> key.
After reading the sample, the meter will display the
concentration in parts per million (ppm) until either
the <READ/ON> key or the <NEXT> key is pushed.
If no key is pushed for a period of five minutes, the
meter will turn off automatically. If the meter turns
off automatically, the meter can be reactivated by
pressing the <READ/ON> key and the unit will
return to the operation mode last used. The meter
can be turned off manually by using the
<SELECT/OFF> key, while in the read mode only.
The optical system on the PetroFLAG analyzer is
covered with a screw cap to keep out stray light. To
remove this screw cap from the vial holder, simply
unscrew it 1/4 of a turn counter-clockwise. To make
a measurement, insert the developer vial into the
12
Analyzer Operation Examples
Outlined below are step-by-step examples of how to
use the PetroFLAG analyzer. Under normal
operating conditions the meter will power up in the
read mode. The examples given here categorized as
"standard operation" assume that the meter was last
operated in the read mode. If the meter was left in
another mode for longer than five minutes or the
batteries were removed, see below for special cases.
Standard Operation/Changing Response Factor
Without Recalibrating:
(Whenever the last operation mode was read and a
different response factor is desired.)
1) Turn the meter on by pressing:
READ
ON
Standard Operation:
(Whenever the last operation mode was read, the
calibration data is current and the last-used
response factor is valid.)
2) Return the operation to the MAIN MENU by
pressing:
1) Turn the meter on by pressing:
READ
ON
The last reading will be displayed
for 2 seconds. The display will
show the calibration curve and
response factor currently selected.
The meter is now in the read
mode.
NEXT
Three decimal points will be
displayed along with the current
response factor. The calibration
curve designation will begin
blinking.
3) The response factor entry mode is activated by
pressing:
2) Remove the screw cap, insert developer vial to
be read and retighten cap.
3) To begin reading press:
READ
ON
The last reading will be displayed
for 2 seconds. The display will
show the calibration curve and
response factor currently selected.
The meter is now in the read
mode.
NEXT
The display will show the
calibration curve and response
factor currently selected (blinking),
the display will read “CALC” for 3
seconds, and the final result will
be displayed.
The response factor will begin to
blink indicating that it may be
changed.
4) Scroll to the desired response factor by
pressing:
SCROLL
4) The result will be displayed until the next
reading is taken. To make the next reading:
remove the vial and repeat steps 2 and 3 above.
13
The next response factor will be
displayed. Continue pressing the
<SCROLL> key until the desired
response factor is displayed.
(Response
factors scroll in
descending order, i.e., 15-1)
5) When the desired response factor is reached,
select it by pressing:
SELECT
OFF
1) Turn the meter on by pressing:
READ
ON
The new response factor has been
selected. The meter will calculate
and
display
the
current
temperature.
The last reading will be displayed
for 2 seconds. The display will
show the calibration curve and
response factor currently selected.
The meter is now in the read
mode.
6) Move to the next screen by pressing:
NEXT
2) Return the operation to the MAIN MENU by
pressing:
The meter will prompt for the
blank to be entered and the
calibration procedure to begin by
displaying “-bL-“.
NEXT
7) Skip this calibration procedure and move directly
to the read mode, saving the new response
factor but not recalibrating, by pressing (This
exits the calibration mode without affecting the
current calibration data):
NEXT
Three decimal points will be
displayed along with the current
response factor. The calibration
curve designation will begin
blinking, indicating that it may be
changed.
(If the displayed calibration curve is the one to be
redetermined, skip directly to the response factor
input by pressing the < NEXT> key.)
The meter will display the current
calibration curve and the selected
response factor and is ready to
read a sample using the new
response factor.
OTHERWISE
3) Scroll to the calibration curve that is to be
redetermined by pressing:
8) Proceed with the reading of a sample by
following the above procedure for "Standard
Operation" beginning at step 2.
SCROLL
The display will show the next
calibration curve designation.
Standard Operation With Recalibration:
4) When the desired calibration
determined, select it by pressing:
(Where the last operational mode was the read
mode and the meter is to be recalibrated.)
Prior to performing this calibration procedure,
prepare the blank and standard as described in the
manual under "Using the PetroFLAG Hydrocarbon
Analysis System - Preparing Blanks and Standards".
They may also be prepared along with the unknown
samples in order to save time.
SELECT
OFF
curve
is
The calibration curve is selected
and the meter will prompt for the
input of the response factor.
5) If the response factor displayed is not the
desired one, use the <SCROLL> key as
described the previous section above under
"Standard Operation - Changing Response
Factor Without Recalibrating". If the response
factor is correct, skip this step by pressing:
NEXT
14
The meter will calculate and
display the current temperature.
6) Move to the next screen by pressing:
NEXT
Special Operating Conditions:
The meter will prompt for the
blank to be entered and the
calibration procedure to begin by
displaying “-bL-“.
Replacement of Battery:
NOTE: Use ONLY 9V Alkaline or 9V Lithium
battery. Use of carbon/zinc battery will cause the
PetroFLAG meter to malfunction.
7) Remove the screw cap and insert the prepared
blank vial, replace the cap and begin calibration
by pressing:
READ
ON
Open the battery compartment by sliding the
compartment door back (indicated by the arrow on
the back of the unit). Lift out the old battery from
the compartment and carefully unsnap the battery
from the wire harness/connector. Replace with a
fresh alkaline battery by snapping the wire
harness/connector onto the new battery making
sure the polarity is correct (The snaps will only go
on one way). Reinsert the battery and connector
into the compartment being careful not to twist/
damage the connector wires. Replace compartment
door by sliding the door forward until the latch
clicks.
The display will blink showing the
selected calibration curve and
response factor. The meter will
display "0" for three seconds and
prompt for the calibration standard
by displaying “-CSd”.
8) Remove the screw cap and blank vial and insert
the calibration standard vial.
Read the
calibration standard by pressing:
READ
ON
The display will blink showing the
selected calibration curve and
response factor. The display will
read "1000" for three seconds and
display the currently selected
calibration curve and response
factor continuously. The meter is
now in the read mode.
Operation of the Meter After the Battery has been
Disconnected:
When the battery has been disconnected the microprocessor will automatically return to the MAIN
MENU once the battery has been reconnected. The
meter, however, will not be in a read mode but is
calibrated for use, unless other factors warrant
recalibration. The operations to be performed will
determine the exact steps to be followed. The steps
to follow are described above in the various
sections of “Analyzer Operation Examples.”
9) Proceed with reading the unknown samples by
following the procedure for “Standard
Operation” above, beginning with step 2.
Meter Left to Turn Off in Other Mode:
When the meter is left in any "screen" for five
minutes the meter will shut off automatically. The
meter will return to last active screen when the
<READ/ON> key is pressed.
15
Helpful Suggestions and Safety Precautions
When PetroFLAG test results indicate no
hydrocarbons are present, the sample can be sent in
for certified laboratory confirmatory analysis. All
environmental soil sampling used for final closure
should be performed using methods that are
approved by the local regulating agency.
Avoid sampling directly beneath creosote bushes,
sage brush and other oil bearing plants.
Personal protection should be worn during soil
sampling and testing. A minimum of latex gloves
and goggles should be worn.
A response factor (RF) is the relationship between
the analyte of interest and the calibration standard.
The turbidity formed in the development solution by
the sample is compared to the calibration standard
followed by a calculation which determines the
correct concentration for your contaminant. For
Example: Equal concentrations of diesel and mineral
oil do not produce the same level of turbidity. A RF
value of 10 for mineral oil divided by the RF value of
5 for diesel produces a result of 2. This means that
mineral oil forms twice the turbidity of diesel at the
same concentration. Stated another way, 250ppm
mineral oil forms the same turbidity as 500 ppm
diesel. For more information please see Appendix A
in the Manual.
Commonly Asked Questions
What are the response factors?
Decontamination stations should be set up using
appropriate cleaners and rinsing solutions. Soil
sampling equipment not supplied with the reagent
pack should be decontaminated between sampling
locations to prevent the possibility of cross
contamination.
All reagents and sampling scoops supplied with the
kit are single-use disposable items. Therefore, do
not reuse spoons, tubes, filters, or vials. The
electronic balance is NOT disposable.
Checkambient temperature BEFORE extracting soils,
when a calibration procedure is not planned for the
current batch of test samples.
Why doesn’t my calibration standard read 1000ppm
when I re-read it after calibrating?
Make sure the filter disks are screwed on tightly
before adding the soil extract to a filter syringe.
This is directly related to the first question. The
calibration standard is 1000 ppm mineral oil,
therefore, if you read it on any RF other than 10 you
will get a different number.
Do not leave the PetroFLAG analyzer in direct
sunlight when not in use. Store the instrument in the
protective carrying case with the lid closed.
How long are my samples good for after they
develop for 10 minutes?
Make sure that the contamination at the site is
characterized at some time during the investigation.
The PetroFLAG development process is a temporary
reaction, therefore, readings should be taken right at
the end of the 10 minute development period. The
turbidity will continue to develop for period of time,
after which the solution will begin to fade. Do NOT
attempt to reread the sample as results may vary due
to these changes in the solution. No measurements
should be taken after 20 minutes. This means you
must record your data as it is generated because
you cannot save your sample vials for future
analysis.
Avoid sampling organic matter. Scrape away
organic material (leaves, sticks, etc.) before
sampling.
Avoid sampling directly under pine, cedar, and fir
trees unless the sample is collected below the
organic layer. Do not collect samples from areas
where tree roots have been encountered.
16
Caution
When opening the break-top ampules DO NOT
remove the plastic sleeve from the top. It is there for
your protection. Removing it may result in personal
injury.
After I prepare a set of calibration solutions how
long are they good for?
Since the PetroFLAG development chemistry fades
over time they are only good for a single use and
the 10 minute time window should be adhered to.
The Extraction Solvent and Calibration Standards
contain methanol and are Flammable and Poisonous.
The screen is displaying an error code, what does
it mean?
Wear rubber gloves and safety glasses while
performing tests.
See the reference table in Appendix D for a list of
“Error Conditions”.
Dispose of all used reagents and soil properly.
What can I do if my reading is over-range?
Read the Material Safety Data Sheet before
performing test.
Process a new sample using a 1 gram soil sample
and multiply the end result by 10. This sample
dilution will allow you to read up to 10,000-15,000
ppm on most samples (1-1.5%).
Manufacturer's Warranty
The reagents and supplies used in the PetroFLAG
test are warranted to be free of defects in material
and workmanship until the expiration date stamped
on the box. Manufacturer's sole and exclusive
liability under this warranty shall be limited to
replacement of any materials that are proved to be
defective. Manufacturer shall not be liable for any
incidental or consequential damages.
The meter is “stuck” in the calibration program
mode with the “1C” or “2C” characters flashing?
The meter will not allow normal calibration
procedure or sample measurement when the
<READ/ON> key is pressed, but returns to a
flashing “1C” or “2C” screen. This is usually
caused by use of a non-alkaline battery.
Replacement with a fresh 9V Alkaline battery should
eliminate the problem and the meter should return to
normal operation.
Reliable test results are highly dependent upon the
care with which the directions are followed and,
consequently, cannot be guaranteed.
17
Appendix A: PetroFLAG Response Curves
Most fuels, lubes and greases are complex mixtures of various hydrocarbons having a broad range of physical
and chemical properties. The PetroFLAG system will detect a majority of the ecologically important hydrocarbon
mixtures. The PetroFLAG responses to some typical hydrocarbon contaminants are plotted in figure 15.
1
Mineral Oil
Grease
Motor Oil
Gear Oil
Diesel
Jet A
0.9
Relative Turbidity
0.8
0.7
0.6
0.5
0.4
0.3
0.2
0.1
0
0
200
400
600
800
1000
Concentration (ppm)
Figure 1: Relative Intensity Data for Common Analytes
5
The lower limit of quantification, using a 10 gram sample size, is 1000 ppm for gasoline (linear range from 1000
ppm to 5,000 ppm). Brake fluid, phosphate ester based hydraulic oil, or other water soluble compounds will not
be detected by the PetroFLAG system.
18
Appendix B: Comparison with Laboratory Methods
In field trials, the PetroFLAG system was used at
sites contaminated with diesel fuel or with oil and
grease. In both cases the PetroFLAG results
correlated very well with EPA laboratory methods.
Both EPA methods 8015B and 418.1 were used to
analyze the samples from the diesel site. The
resulting correlations were 89% and 92%
respectively 6. The samples from the oil and grease
site were analyzed using EPA method 418.1 for soil.
The lab results confirmed the PetroFLAG results
with no false negatives and only 2 false positives
(10%). When comparing the field results and the lab
results for the field split samples, the correlation
between the PetroFLAG data and EPA method 418.1
for the laboratory split samples was 90% 7 .
of soil samples. Whenever possible, homogenize
samples using standard methods 8 before taking
"splits" to send to the lab for confirmation.
When comparing the PetroFLAG field results with
laboratory results using EPA methods it is important
to keep in mind that EPA laboratory methods for
TPH are known to have variable extraction
efficiency. The extraction efficiency achieved using
EPA laboratory methods varies with soil type and
moisture content. In addition, the degree to which
moisture affects the extraction is dependent on how
the individual laboratory is implementing the
method. It is, therefore, important to verify that the
lab used for comparison is performing the method
properly and that the recovery is known.
Another important factor affecting laboratory
confirmation analysis is the inhomogeneous nature
6
Wright, Keith A., "Evaluation of a New Field
Test Kit for Determining Total Petroleum
Hydrocarbon Concentrations in Soil at a Site
Contaminated by Diesel Fuel", Presented at the
AEHS Conference on "Hydrocarbon
Contaminated Soils", January 11-13, 1995, New
Orleans, LA.
7
Wright, Keith A. and Jermstad, David B.,
"Evaluation of a Rapid Field Analytical Test Kit
for Assessing Hydrocarbon Soil
Contamination", Presented at the "Third
International Conference On-Site Analysis",
January 22-25, 1995 Houston, TX.
8
See for example: Pitard, Francis F. , Pierre Gy's
Sampling Theory and Sampling Practice,
Volumes 1 and 2, CRC Press, Inc., Boca Raton,
FL, 1992).
19
Appendix C: Determining the Response Factor for Hydrocarbons Not
Listed in Table 1
The response factors listed in Table 1 are calculated
from response curves similar to those in Figure 1 in
Appendix A. The response factor is equal to the
slope of the response curve multiplied by 10. The
slope of the response curve for the analyte is
calculated from the response of the specific analyte
relative to the response of the calibration standard.
The calibration standard has a slope of one and a
response factor of 10 on the PetroFLAG meter.
Multiplying the slope of a specific analyte's
response curve by 10 yields the appropriate
response factor for that analyte.
spiked standard does not read higher than 1000 ppm
on the PetroFLAG meter.
When the contaminant is unknown and a sample of
the pure product is not available, then an alternative
method can be used. The PetroFLAG results, with
the meter set to response factor 10, can be compared
with laboratory results from split samples analyzed
in triplicate. This method requires extreme care in
the homogenizing of the bulk material and also, the
preparation of the split samples. Improper sample
preparation can result in errors of 100 to 200% or
greater. To minimize the effects of this sample
variation, as many samples as possible should be
analyzed (greater than 20) and the concentrations
used should be evenly distributed over the range of
100 to 1000 ppm. Once the data has been collected,
plot the data as described above using the
laboratory reference method results as the known
concentration. The slope of the regression line
multiplied by 10 is then the response factor.
When a suspected contaminant is not listed in
Table 1, there are a few methods that may be used to
determine the response factor. The method used is
determined by the information and facilities
available. The most accurate method would be to
replicate the data in Figure 1 for the specific analyte,
and then calculate the response factor from the
slope of the response curve.
Initially, prepare soil standards from a single
homogeneous batch of clean soil spiked at a
minimum of 5 different concentrations between 100
and 1000 ppm. (For light hydrocarbons, a higher
concentration range can be used.) Next, analyze the
soil standards in triplicate using a calibrated
PetroFLAG meter set to a response factor of 10. Plot
the results with the true spiked concentrations on
the "X" axis and the meter readings on the "Y" axis.
The slope of the regression line (least squares line)
through the data points multiplied by 10 is the
response factor that should be used for this analyte.
To avoid a low bias and false negatives, round the
resulting number down to the nearest whole number
when selecting the response factor for the meter.
This method can be used if either the contaminant
is known or a sample of the neat product is
available.
NOTE: This method is not as precise as the spike
method and any bias in the laboratory method will
result in an error in determining this response factor.
It is important to check both the laboratory method
and the lab performing the analysis thoroughly
before using it as the reference method. (See
Appendix B)
If the facilities are not available to perform these
tests contact Dexsil for advice.
NOTE: When the soil used to prepare the spiked
soil standards is not actually clean but contains
some hydrocarbons, the curve will have a positive
intercept. This result should not affect the
calculated response factor provided that the highest
20
Appendix D: Error Conditions
Table 2: Error Conditions
Message
Cause
Flashing Concentration
Reading
Over range condition.
[Applies to Unknown
Measurements]
Solution
Sample concentration outside of linear
range.
Use smaller sample (1 gram
recommended) and rerun.
Flashing "EEEE"
Sensor over range condition.
[Applies to Unknown
Measurements]
Sample concentration too high.
Use smaller sample (1 gram
recommended) and rerun.
"Err0"
Blank and Calibration Standard vials mixed
up.
Check calibration vials. Rerun
and/or make up new ones.
[Applies to Calibration
Mode]
"Err1"
Blank or Calibration Standard outside of QC
window ( bL too high or CSd too low).
Readings from the two optical channels do
not agree.
Check vial and reread. If error
remains, rerun using another
vial.
Sample is reading lower than the blank, e.g.,
Calibration Blank soil unusually high
background or not zero.
Recalibrate using true Blank
soil.
Blank or Calibration Standard outside of QC
window (bL too low or CSd too high).
Recalibrate using fresh
calibration solutions.
Absolute temperature difference between
calibration and reading exceeds 10oC.
Recalibrate at current
temperature.
Ambient temperature outside of operating
range. (4oC - 45oC)
Remove meter and reagents to
climate controlled environment
to recalibrate/rerun.
Low Power
Replace battery.
[Applies to All Modes]
"Err2"
[Applies to Unknown
Measurements]
"Err3"
[Applies to Calibration
Mode]
"Err4"
[Applies to Unknown
Measurements]
"Err5"
[ Applies to All Modes]
"LP"
21
Appendix E: Meter Specifications
A/D Resolution:
0.5 ppm
Display Resolution:
1 ppm
Precision:
Analyte Dependent
From MDL to Max Linear Range (MLR) ±10% +5 ppm
From Max Linear Range to Max Quantifiable Range (MQR) ± 20%
Measurement Range:
10-10,000 ppm (linear range analyte dependent)
Operating Temperature:
4oC to 45oC
Quantification Limit:
Analyte Dependent
Response Factor
15
10
5
2
Approx.
MLR (ppm)*
730
1,000
2,000
5,000
Approx.
MQR (ppm)*
1,460
2,000
4,000
10,000
*Actual limits realized in the field are temperature and device dependent. PetroFLAG meter automatically warns
user when each limit has been reached.
Program Storage:
EEPROM
Calibration Storage: EEPROM
Display:
4 digit ½ inch seven segment LCD
Batteries:
One 9V Alkaline (included) [Use only Alkaline or Lithium type]
Battery Life:
Approx. 4000 measurements or 1 year (using a 550 mAh alkaline battery)
Dimensions:
length=5.75" width=3.5" height=2"
Weight:
9.85 oz ( 280 g)
22