1
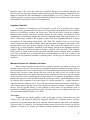
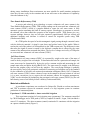
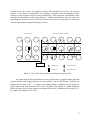
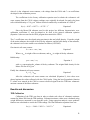
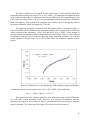
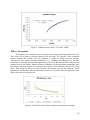
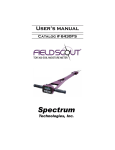
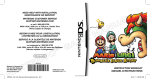
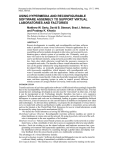
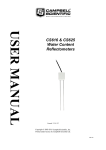
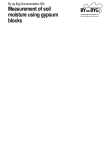
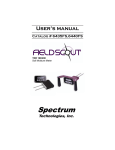
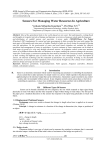
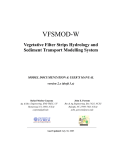
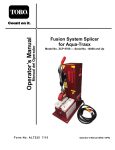
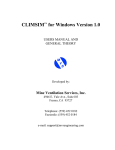
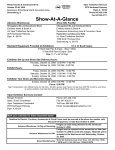
Controlling Irrigation with Tensiometers and Time Domain
Reflectometry (TDR)
Final Report
Dorota Z. Haman - Agricultural and Biological Engineering
Thomas H. Yeager – Environmental Horticulture
University of Florida
Introduction
In 1990, agriculture accounted for the largest use of freshwater in Florida. Agricultural
water withdrawals amounted to 3,805 million gallons per day and provided irrigation water for
2.15 million acres (Carriker 2000). It is generally understood that water conservation is the best
way to increase the water management efficiency of agriculture and reduce potential negative
environmental impacts. Because of this need for conservation combined with other factors such
as economics, labor, and product quality requirements, irrigators are under increasing pressure to
manage water more efficiently. More precise irrigation management that uses reliable moisture
sensors and irrigation controllers can significantly improve irrigation scheduling techniques that
will result in higher irrigation efficiency.
Irrigation scheduling may be accomplished by a number of different methods that strive
to keep the soil moisture within proper limits. Proper irrigation scheduling is the application of
water to crops only when needed and only in needed amounts. This requires the answer to two
questions: when to irrigate and how much water to apply (Smajstrla, et al. 1997). No irrigation
system will apply water without some waste or losses, since the cost to prevent all losses is
prohibitive. An excellent method to reduce water use consists of utilizing soil moisture
monitoring devices in conjunction with rainfall records and knowledge of plant water needs
(Muñoz-Carpena, et al. 2002). The objective of this research project was evaluate two soil
moisture sensors and make a progress in development of a useful and easy-to-use irrigation
controller for container production of ornamental plants in Florida’s nurseries.
Irrigation in Nurseries
Most of the irrigation systems used in Florida container nurseries are pressurized
irrigation systems, such as overhead sprinklers or some type of microirrigation. However, mainly
due to the economics, the majority of Florida nurseries use overhead sprinkler systems,
especially for small containers. Typically, the application efficiencies of these systems are low
(20-50%) due to container spacing that is necessary for proper plant development (Haman, et al.
1996). Using microirrigation can increase the efficiency, however, these systems are more costly
and require higher management skills.
A big advantage of microirrigation is a fact that water is delivered directly to the root
zone of the plants. For plants that are sensitive to foliar diseases, dry foliage will also be an
advantage. Microirrigation systems are suited for chemigation (chemical application with
1
irrigation water). The water and chemicals are applied directly to the container substrate and
there are no losses between containers, minimizing the runoff from the nursery. Furthermore, the
danger of chemical loss and contamination is reduced (Haman, et al. 1997). However, the control
of these irrigation systems is more complicated and a reliable device to monitor the water content
of the substrate is needed for efficient water application.
Irrigation Controller
A controller is an integral part of an irrigation system. It is an essential tool to apply
water in necessary quantity and at the right time to sustain agricultural production and to achieve
high levels of efficiency in water and energy uses. These devices have evolved into complex
computer-based systems that allow accurate control of water, energy and chemicals while
responding to environmental changes and various development stages of the crop (Zazueta, et al.
1993). Closed loop controllers for irrigation systems base their irrigation decisions on direct
measurement of soil-moisture using sensors like TDR. The simplest form of a closed loop
control system is a timer with a moisture sensor that interrupts an irrigation cycle based on the
moisture status or the soil, growth substrate, or plant water status. The system can be set to
irrigate at a very high frequency, depending of the settings entered in the datalogger/controller
program. When the controller attempts to irrigate, irrigation will occur only if the moisture
sensor allows it, which in turn occurs only when substrate moisture dropped below acceptable
level. The acceptable level is determined from recommendations for the type of plant to be
cultivated, the environmental conditions, cultural practice, and the type of substrate used in the
containers.
Moisture Sensors for Container Substrate
Many current irrigation systems used in container nurseries are based on timers and
moisture sensors. However, few systems are controlled by moisture sensors in real time. Most of
the soil moisture sensor have been developed for field conditions and function well when used in
mineral soils. However, many sensors that work well in the field are not very reliable in the
container substrate due to the poor contact between the substrate and the sensor. A good example
of the sensor that often has problems due to poor contact is a tensiometer. In addition to contact
problem the amount of water that filters from the tensiometer ceramic cup to the substrate could
be relatively high compared to the total volume of a small container (i.e. 1 gallon container),
especially when the substrate is dry. As a result, the container with the tensiometer could show a
water content greater than the actual water content of containers without a tensiometer. Other
devices, such as gypsum blocks are also affected by the porosity of the substrate used in
containers. In addition, gypsum blocks dissolve with time and have to be replaced often after one
year of operation (Muñoz-Carpena, et al. 2002).
Tensiometer
Tensiometers are usually capable to read in the range of water tensions between Field
Capacity (FC) and Maximum Allowable Depletion (MAD) for a substrate used in container
production. The main problem that can be expected with tensiometers when used with substrates
with more than 70% porosity, is to maintain enough contact between the ceramic cup and the
substrate. To improve the contact, the substrate around tensiometer must be carefully pressed
2
during sensor installation. Short tensiometers are more suitable for small container production
since they fit more easily in the container and do not add water to the substrate via capillarity
when the substrate is dry.
Time Domain Reflectometry (TDR)
A precise and relatively new technology to assess volumetric soil water content is the
Time Domain Reflectometry (TDR). TDR voltage readings can be converted into volumetric soil
water content (VSWC) which is a popular method to report the soil water status. A fully
automatic system containing this kind of sensors requires a datalogger or computer to activate
the solenoid valves that control the operation of the irrigation system. TDR sensors give very
accurate readings, however, they are still quite expensive (approximately $200 per sensor) and
additional hardware and software is needed to control an irrigation system using TDR
(Charlesworth 2000).
In a TDR probe the speed of an electromagnetic signal passing through a material varies
with the dielectric material. A signal is sent down steel probes buried in the media. When it
reaches the end of the probes it is reflected back to the TDR receptor unit. The difference in time
that takes the signal to return is caused by the dielectric constant that is affected by the water
content of the substrate that surrounds the probes. The levels of voltage received by a TDR probe
are converted into volumetric soil water content (VSWC).
Soil Water Content
The gravimetric soil water content (GSWC) is expressed by weight as the ratio of the mass of
water to the dry weight of the soil sample. To determine this ratio for a particular soil sample, the
water mass must be determined by drying the soil to constant weight and measuring the soil
sample mass after and before drying (Black 1965). The water mass (or weight) is the difference
between the weights of the wet and oven dry samples. The oven-drying technique is probably
the most widely used of all gravimetric methods for measuring soil moisture and is the standard
for the calibration of all other soil moisture determination techniques (Black 1965). Volumetric
soil water content (VSWC) relates volume of water in the sample to the total volume of soil and
it is a more convenient way to express the soil moisture content for irrigation management.
VSWC can be calculated by multiplying the gravimetric soil water content (GSWC)) by the soil
bulk density (mass of soil solids per unit volume) (Charlesworth 2000).
Materials and Methods
A greenhouse experiment was conducted in Gainesville, Florida to evaluate tensiometer
and TDT as moisture sensors for automatic control of a drip irrigation system in container
production of ornamental plants.
Experiment I – TDR controlled vs. timer controlled irrigation
This experiment consisted of two irrigation zones (treatments). The treatment controlled
by CR10 Datalogger and a TDR probe (CS616) (Campbell Scientific, Logan, Utah) included a
zone of 15 containers. The other treatment (control) consisted of 9 containers with the irrigation
on a preset schedule (timer) (Figure 1).
3
The irrigation zone for each sensor included a 24 V solenoid valve. The water was
supplied through a 0.75 in PVC line, and spaghetti drip tubes with one 2 GPH emitter and two
dribble-rings per drip tube to have a more uniform water distribution in the container.
Six pressure transducer tensiometers were used to monitor water potential of the
substrate. Two sizes of tensiometers were used: a mini tensiometer, 3 in in length and 1 in in
diameter, and a more typical tensiometer, 6 in long with 0.5 in diameter. All tensiometers were
equipped with low-tension ceramic cups and were produced by Irrometer Company® (Riverside,
California). The ceramic cup of low-tension instruments has different porosity and is more
sensitive to changes in soil moisture conditions when the substrate is close to the saturation
point. Low tension instruments are recommended for use between 0 and 40 cb (kPa) (Irrometer
2003). Three tensiometers of each size where installed. The tensiometers were placed vertically
halfway between the base of the plant and the container’s side. Both types of tensiometers
incorporated a pressure transducer that could register changes of pressure in the instruments as a
change in voltage that was transmitted to the datalogger. This signal was later converted back to
the pressure (vacuum) units.
Timer Controlled
TDR and Computer Controlled
Solenoid valve
Water supply
TDR sensor
Tensiometer
Figure1. Time controlled and TDR controlled plots (Experiment I).
Experiment II – TDR Controlled, Tensiometer Controlled and Timer Controlled Irrigation
A follow-up experiment was conducted to compare Timer, TDR, and Tensiometer
controlled irrigation systems (Figure 2). The project consisted of three different irrigation
systems, each one controlled by one type of sensor, TDR, Long Tensiometer, and Short
Tensiometer. In addition, there was a timer controlled “control” treatment. Each of the sensors
was connected to a CR10 that stored the information acquired by the sensors and controlled the
4
solenoid valves for each of the irrigation systems. The threshold level of the soil moisture
content, or the number of atmospheres (soil tension) at which to start the irrigation and the
duration of each irrigation event were also controlled by a CR10 program. All threshold values
could be set individually for each sensor (Figure 3). Within each treatment, only one sensor was
controlling the irrigation system. The other sensors where used for monitoring to evaluate the
accuracy and variation among each group of sensors.
Timer Controlled
TDR and Tensiometer Controlled
Water supply
Solenoid valve
Long Tensiometer
TDR sensor
Short Tensiometer
Figure 2. Time, TDR, and tensiometer controlled plots (Experiment II).
The plants used in both experiments were the Spathiphyllum, a popular indoor plant that
is grown commercially using hot houses covered in plastic, even in South Florida. Typically, the
temperatures are kept at 90 o + F degrees under high humidity conditions and the plants are
grown under shade with minimal air movement. The plants were planted in 3-gallon containers
filled with Metro-500 growing substrate consisting of pine bark, Canadian peat, and sand (2:1:1
by volume) mix (Haman, et al. 1998).
5
Figure 3. Experiment set-up.
TDR Based Irrigation System
The CS616® water content reflectometers (Figure 1) from Campbell Scientific Inc. were
used to measure volumetric water content using the time-domain reflectometry method. The rods
where cut from 12 in to 6 in to fit in the 3 gallon container since the manufacturer advice is to
leave at least 1.5 in between the probes and the container walls to avoid interference (noise) in
the voltage levels retrieved by the probes.
The CS616 do not directly measure the wave-guide signal reflection time like a common
TDR. Instead, the signal returned from the guides causes a circuit to change states between two
discrete values. The output of the sensor is a frequency that reflects the number of state changes
per second (Hz) (CSI 2002). As with all TDR sensors, a wetter soil will cause a longer signalreturn time, and will cause the CS616 circuit to vibrate at lower frequency. The wave-guides can
be buried for “in situ” readings or used as a portable probe. The CS616 was inserted in the
container under a 45-degree angle to cover more substrate volume with the electromagnetic
signal.
A CR10® datalogger from Campbell Scientific Inc. was used to collect the readings from
the CS616 probe. A program using PC208 software (CSI 1997) was developed to control the
water content reflectometer (CS616), to store voltage data, and to record volumetric soil water
content and the time of the measurements. The program activated the probe at a specified time
interval and saved the information collected in a text file in the CR10 memory. The program also
allowed for setting the range of volumetric soil water content (VSWC) values at which the CR10
switched ON or OFF the solenoid valve to start or stop irrigation. The file stored in the CR10
memory was downloaded to a personal computer for editing and analysis.
Determining Gravimetric Soil Water Content
An electronic scale was used to record the weight of the pot containing the plant (Figure
4). The scale had a capacity of 10 kg, a readability of 1g, and a linearity of +/- 1g (Acculab
2002). It also had a RS-232 (serial port) port that allowed it to communicate with a personal
6
computer through a program specially written for this project using LabVIEW®, a graphical
programming language that uses icons instead of lines of text to create applications (LabView
2001).
Figure 4. Container on electronic scale
The program collected the reading from the scale at a specific time interval and showed it
on the computer screen using a graphic interface (Figure 5). The time interval when the readings
are recorded was be adjusted as needed and the data-files produced can be imported as a text file
easily into any spreadsheet software.
Figure 5. LabVIEW Program
The weights collected by the scale were used to calculate the gravimetric moisture
content that was later converted to volumetric moisture content and compared against the VSWC
registered by the TDR.
Calibration of TDR Using Gravimetric Soil Water Content
The general calibration curve to obtain the volumetric soil water content from the CS616
voltage readings has a following form:
θv(τ) = C0 + C1 * τ + C2 * τ2
Equation 1
7
where θv is the volumetric water contents, τ the voltage from the CS616 and Cn are coefficients
developed in the calibration process.
The coefficients in the factory calibration equation used to obtain the volumetric soil
water content from the CS616 voltage readings ware originally developed for sandy-clay-loam
soils with bulk density of 1.6 g cm-3 and an electrical conductivity at saturation of 0.4 dS m-1.
θv(τ)= - 0.187 + 0.037 * τ + 0.335 * τ2
Equation 2
Since the Metro-500 substrate used in this project has different characteristics, new
calibration coefficients Cn were developed to be used in the general calibration equation
(Equation 1) that was used in the CR10 program that controls the CS616.
The Cn coefficients were developed using gravimetric data and a bulk density. From the weight
of the moist substrate, the weight of the oven dry substrate, and the bulk density of the substrate,
the volumetric soil water content was calculated as follows (CSI 2002).
Gravimetric soil water content:
θv = mwet – mdry / mdry
Equation 3
Where: mwet is weight of the wet substrate, and mdry is weight of the dry substrate.
Bulk density:
ρbulk = mdry / vdry
Equation 4
with vdry representing the volume of the dry substrate. The original bulk density for the
Metro-500 was 0.36 g cm-3.
Finally the volumetric soil water content:
θv = θg * ρbulk
Equation 5
After the volumetric soil water content was calculated (Equation 5), this values were
plotted against the values collected with the CS616 probe. Using the best-fit quadratic function
Cn values were entered in the CR10 to convert electrical signal from the TDR into volumetric
moisture content of the Metro substrate.
Results and discussion
TDR Calibration
Calibration of the TDR was done in order to obtain real values of volumetric moisture
content for Metro 500 from the TDR readings. Volumetric moisture values were calculated using
weight differences measured by an electronic scale. Using regression analysis a new quadratic
function was calculated to correct the TDR readings. The final calibration equation form was:
θv(τ) = - 2.644 + 5.056 * τ - 2.065 * τ2
Equation 6
8
The above equation was developed for the entire range of data collected during the
experiment, and represents the range of 7% to 55% VSWC. It is important to mention that there
are several factors that affect the calibration curve for this TDR sensor. The original length of the
CS616 rods was reduced from 12 in to 6 in to accommodate sensor placement in the containers
filled with substrate. This resulted in the sampling space reduction by 50% and greatly affected
the factory calibration, which is designed for 12 in rods.
The graph representing the equation that fits the sampled values is presented in Figure 6.
It shows that there is less resolution in the instrument reading at the extremes of the soil moisture
values recorded in this experiment. Above 40% and below 20% of VSWC, larger changes in
moisture content correspond to smaller changes in the recorded voltage. However, this reduction
in instrument accuracy is not critical since typically, under production conditions, an irrigation
system operates in the rage from 15% to 50% VSWC where the calibration equation is more
precise.
Figure 6. Calibration curve developed using TDR readings (voltage) and Weights
A calibration equation for the segment from 15% to 40% VSWC is presented below.
θv(τ) = - 3.044 + 6.098 * τ -2.706 * τ2
This equation provides a better response for most application using a CS616 TDR probe
as a soil water content measuring device. However, it is important to emphasize that this
equation is developed for the 6 in rods. In figure 7, the calibration curve for the typical operation
range is presented. The values out of the range (15% to 40%) have been removed.
9
Figure 7. Calibration curve from 15% to 40% VSWC.
TDR vs. Tensiometer
Tensiometers are common sensors to monitor water status (matrix potential) in the soil.
They work well in soils or growing substrate with less than 70% porosity, since permanent
contact between the ceramic cup and substrate is needed to obtain accurate readings.
Tensiometers also require constant maintenance (i.e., refilling and calibration). If all those
conditions are met, they perform with high accuracy. However, the characteristics of the growing
substrate used in the nursery industry presents challenges for the tensiometer technology since
low density and large particle size increases the porosity of the substrate, and the size of the
pores. That results in reduced contact between the ceramic cup and the substrate, which
translates to reading errors when the substrate is to too wet or too dry, since the empty spaces are
filled with water or air respectively.
Figure 8. Volumetric soils moisture compared to tensiometer readings.
10
TDR Based Irrigation Control System
A part of this project was to develop a TDR controlled irrigation system. Several
approaches were attempted before desirable results were obtained. The first TDR controlled
system was set up to use the readings from the TDR to turn the system ON and OFF. In one test,
volumetric soil moisture values of 17% and 25% were used as lower and upper limits
respectively. A sample of the data collected is presented in Figure 9.
This means that if the TDR reading reached 17% the irrigation system turned on, and
remained on until the TDR reading reaches 25%. It was clear from the amount of drainage that
under this management there was an excess of water being applied (Table 1).
OFF
ON
Figure 9. TDR controlling lower and upper threshold limits
The second set of moisture values used as lower and upper limits were 22% to 25%, and
the third was 25% to 27%. The results were similar to the ones noted above. The system still was
applying more water than was needed to maintain proper moisture in the substrate. The time
between irrigation events was long, varying from 4 to 5 days depending on the conditions
prevailing in the greenhouse that affected plant water use.
Table 1. Comparison of applied water and drainage using VSWC thresholds
17 % - 26 % VSWC
Irrigation Frequency
(days)
4.5
22 % - 25 % VSWC
3.5
Method
25 % - 27 % VSWC
2.5
Water Applied
(cm3)
Water Drained
(cm3)
Water Retained
(cm3)
3975
2850
1125
2400
1250
1150
1900
1260
640
The approach that showed more success was to use the TDR to start the irrigation event
and to let it run for a given period of time. This was possible by using a program that allows
setting the lower limit for the TDR to turn the irrigation system on, and allow the user to preset
11
the duration of the irrigation event. This system permitted a better control of the amount of water
applied, diminishing the waste of water as drainage.
Several attempts were made to establish the best point to turn the system on. Analyzing
the irrigation and water use patterns observed with the previous method, values between 25 and
30% (VSWC) were utilized and tested, along with four different irrigation duration times of, 60,
75, 90 and 120 seconds (Table 2).
Differences in water use between the TDR controlled system and the timer-controlled
system are presented in Table 2. To measure the applied water, the water from one emitter was
collected for the TDR controlled system, and for the timer controlled plot. Drainage water from
one container for each plot was collected. It can be assumed that the retained water was absorbed
by the plant, evaporated from the substrate surface, or was retained in the substrate.
Table 2. Comparison of average applied water and drainage per irrigation event
Method
Irrigation
Frequency (days)
Water Applied
(in3)
Water Drained
(in3)
Water Retained
(in3)
Timer (3 times * 120 seconds)
Daily
11
7.9
3.1
26 % VSWC / 120 seconds
1.4
11
5.5
5.5
26 % VSWC / 90 seconds
1.6
5.8
0.6
5.2
26 % VSWC / 75 seconds
1.6
5.2
0
5.2
26 % VSWC / 60 seconds
1
4.3
0
4.3
The variation in the intervals between irrigation events depends on the water
consumption affected by environmental factors. Even when the conditions in the greenhouse are
more or less stable variation is present. Since the system will automatically turn on at a given
substrate moisture content, the time when the irrigation occurs is different among irrigation
events, which also reflects the water use patterns. In Figures 10 through 12, different rates of
water use (due to evapotranspiration and drainage) can be observed.
Figure 10. TDR at 26% VSWC, and 120 seconds per irrigation event
12
Figure 11. TDR at 26% VSWC, and 75 seconds per irrigation event
Figure 12. TDR at 26% VSWC, and 60 seconds per irrigation event
Figure 13. Comparison between TDR and timer controlled irrigation systems
13
A comparison between the TDR and Timer controlled systems is presented in Figure 14.
The main difference is that the TDR system fluctuates around moisture content of 27%. At the
same time the moisture content on the substrate of the plot controlled by the timer keeps
increasing while the drainage collected also increases. The increase in moisture content is also
and indicator that the plant is not using all that water and the irrigation system is just saturating
the substrate. This increase in water content can diminish the availability of oxygen for the roots,
and also promote development of bacterial and fungal diseases.
Tensiometer Based Irrigation Control System
In the second experiment, the tensiometers were also used to control the starting point of
an irrigation system. The system was programmed to start irrigation when the signal from the
tensiometers reached the 17.24 kPa mark. The system was less precise under tensiometer control
then under TDR control (Figure 14), turning irrigation on later than the set limit.
Figure 14. Comparison of tensiometer controlled irrigation systems
The three types of sensors and a timer used as irrigation system controllers are compared
in Table 3. Compared to the Timer plot, the TDR set at 18% VSWC applies almost 80% less
water, with an application efficiency of 0.38. Application efficiency is the ratio of retained water
available for the plant roots to the total water applied (Smajstrla, et al. 2002).
Table 3. Comparison of average applied water per sensor
Method
Irrigation Water Applied Change (%) Water Drained Water Retained Application
Events
Applied Water
(in3)
(in3)
(in3)
Efficiency
Timer
28
1676
0
1033
643
0.38
TDR (18% VSWC)
17
359
- 78
137
222
0.61
Short Tens. (17.24 kPa)
19
593
- 64
309
287
0.48
Long Tens. (17.24 kPa)
21
824
- 50
429
395
0.47
14
Recommendations and Future Work
Time domain reflectometry can be used to measure volumetric soil water content in
coarse organic substrate with some success. TDR works more precisely between 20% and 35%
VSWC. It should be used with caution with VSWC values above or below those limits for this
type of substrate. Nevertheless, the use of a soil water content monitoring device reduces the
volume of water applied in nursery production compared to a timer-controlled system. Using a
TDR controlled system reduced water use by more than 60%, and with some settings (18% or
20% VSWC) almost 80%. The savings were approximately 60%, and 50% with the short and
long tensiometers respectively. The efficiencies are 0.61 for short tensiometers, 0.48 for long
tensiometers, and 0.47 for TDR.
Literature
Acculab. 2002. VIR-10kg Scale User Manual. Acculab Inc.
Black, C.A. 1965. Methods of Soil Analysis: Part I Physical and mineralogical properties.
American Society of Agronomy, Madison, WI.
Burt, C.M. and Styles, S.W. 2000. Irrigation System Series, Updating Drip Irrigation
Knowledge. Irrigation Journal pp. 10, March-April 2000.
Carriker, R.R. 2000. Florida's Water: Supply, Use, and Public Policy, FE 207, EDIS. UF/IFAS.
FL.
Charlesworth, P. 2000. Irrigation Insights, Soil Water Monitoring. CSIRO Land and Water.
Lismore, Australia.
CSI. 2002. Water Content Reflectometer Model CS616-L. Campbell Scientific Inc. Logan, UT.
CSI. 1997. CR10 Measurement and Control System User Manual. Campbell Scientific Inc.
Logan, UT.
Haman, D.Z., Yeager, T.H., Beeson, R.C and Knox, G.W. 1998. Multiple Pot Box Container
Plant Production. J. Environ. Hort 16 (1): 60. March.
Haman, D.Z. and Yeager, T.H. 1997. Irrigation System Selection for Container Nurseries, AE263, EDIS. UF/IFAS. FL.
Haman, D.Z., Smajstrla, A.G. and Pitts, D.J. 1996. Efficiencies of Irrigation Systems Used in
Florida Nurseries, Bulletin 312, EDIS. UF/IFAS. FL.
Irrometer. 2003. Low-tension and Mini low -tension Irrometers, remote sensing tensiometer.
Irrometer Company. Riverside, CA.
LabView. 2001. Getting Started with LabView. National Instruments. TX.
Lebeau, B., S. Barrington, and R. Bonnell. 2003. Micro-tensiometers to monitor water retention
in peat potted media. Soil and Water Division. ASAE. 19(5): 559-564.
Muñoz-Carpena, R., Yuncong-Li, and Olczyk, T. 2002. Alternatives of Low Cost Soil Moisture
Monitoring Devices for Vegetable Production in South Miami-Dade County, ABE 333,
EDIS. UF/IFAS. FL.
15
Smajstrla, A.G., Boman, B.J., Haman, D.Z., Izuno, F.T., Pitts, D.G. and Zazueta, F.S. 1997.
Basic Irrigation Scheduling in Florida, Bulletin 249, EDIS. UF/IFAS. FL.
Smajstrla, A.G., Boman, B.J., Haman, D.Z., Izuno, F.T., Pitts, D.G. and Zazueta, F.S. 2002.
Efficiencies of Florida Agricultural Irrigation Systems. Bulletin 247, EDIS. UF/IFAS.
FL.
Zazueta, F.S., Smajstrla, A.G. and Clark, G.A. 1993. Irrigation System Controllers, SS-AGE-22,
EDIS. UF/IFAS. FL.
Zazueta, F.S. and Xin, J. 1993. Soil Moisture Sensors, SS-AGE-27, EDIS. UF/IFAS. FL.
16