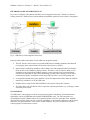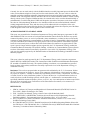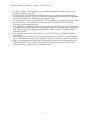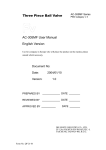
1
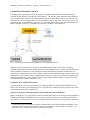
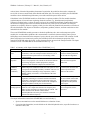
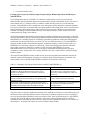
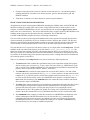
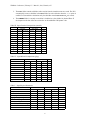
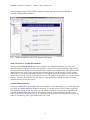
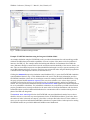
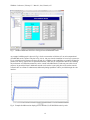
WM2011 Conference, February 27 – March 3, 2011, Phoenix, AZ
Cementitious Barriers Partnership (CBP) Phase I Code Integration – 11446
Kevin G. Brown*, Frank Smith**, Gregory Flach**, and Sohini Sarkar*
*Vanderbilt University, School of Engineering, CRESP III, Nashville, TN 37235
**Savannah River National Laboratory, Aiken, SC 29808
Keywords: probabilistic, simulation, code integration, cementitious barriers
ABSTRACT
The Cementitious Barriers Partnership (CBP) Project is a multi-disciplinary, multi-institutional collaboration
supported by the United States Department of Energy (US DOE) Office of Waste Processing. The objective of
the CBP project is to develop a set of integrated tools to improve understanding and prediction of the longterm structural, hydraulic, and chemical performance of cementitious barriers used in nuclear applications. The
tools developed under this project have been used to evaluate and predict the behavior of cementitious barriers
used in near-surface engineered waste disposal systems, e.g., waste forms, containment structures,
entombments, and environmental remediation, including decontamination and decommissioning analysis of
structural concrete components of nuclear facilities. The periods of cementitious performance being evaluated
are up to or longer than 100 years for operating facilities and longer than 1000 years for waste management.
The CBP project is focused on reducing the uncertainties of current methodologies for assessing cementitious
barrier performance and increasing the consistency and transparency of the assessment process. Prediction
uncertainties are reduced when appropriate models are coupled over relevant spatial and temporal scales. Stateof-the-art models were identified that provide predictions of barrier performance over well-defined regimes
that represent critical areas of interest. In Phase I of the CBP code integration, these models have been linked
to a GoldSim model to better characterize model prediction uncertainties and to provide the first necessary step
to coupling the models over relevant spatial and temporal solution domains to provide much more accurate
predictions of barrier performance over the relevant periods of performance. The GoldSim model also provides
a common graphical user interface to the underlying external codes. Ultimately, the results of this project will
enable improved risk-informed, performance-based decision-making and support several of the strategic
initiatives in the DOE Office of Environmental Management Engineering & Technology Roadmap.
INTRODUCTION
The integration of software already developed by the CBP partners was determined to be the most efficient
means of satisfying the CBP goal of providing a set of computational tools to improve prediction of the longterm behavior of cementitious materials. The partner codes selected for the Phase I integration effort were
STADIUM® developed by SIMCO Technologies, Inc. [1] and LeachXS™/ORCHESTRA developed by the
Energy Research Centre of the Netherlands (ECN) [2, 3]. These codes were selected based on their maturity
and their ability to address important issues related to the use of cementitious materials for nuclear
applications. GoldSim [4] was selected as the code integration platform [5]. GoldSim is a Windows-based
graphical object-oriented computer program that provides a flexible environment for model development.
Linking GoldSim to external codes has previously been demonstrated [6, 7].
GoldSim can perform both deterministic and probabilistic simulations including radionuclide decay and
transport. As part of the CBP project, a general dynamic-link library (DLL) interface was developed to link
GoldSim with external codes [8, 9]. The DLL uses a list of code inputs provided by GoldSim to create a text
input file for the external application, runs the external code, and returns a list of outputs (read from text files
created by the external application) to GoldSim. GoldSim thus provides: 1) a unified user interface to external
applications, 2) the capability of coupling external codes in a synergistic manner, and 3) the capability of
performing probabilistic uncertainty analysis using the external codes. A free GoldSim “Player” is available
from GoldSim Technology Group that allows running but not editing GoldSim models. The free version makes
the software readily available to a wider cohort of users who wish to use the CBP application but do not have a
GoldSim license.
1
WM2011 Conference, February 27 – March 3, 2011, Phoenix, AZ
GOLDSIM FRAMEWORK OVERVIEW
The CBP Phase I code integration effort has produced a GoldSim model linked to the STADIUM® and
LeachXS™/ORCHESTRA codes through a DLL interface 1 . The interface passes arguments from GoldSim to
the codes and extracts output from the code-generated result files. In the Phase I interface, the codes are run
independently with no coupling between codes. The GoldSim interface allows the user to create a one- or twodimensional mesh (via the Mesh2d program) for use in the computations and provides limited capabilities for
plotting simulation results. Fig. 1 illustrates the structure of the Phase I code integration.
Fig. 1. Schematic representation of CBP Phase I code integration framework
GoldSim provides a framework for performing probabilistic analysis with external codes by utilizing
stochastic distributions of important model parameters within GoldSim. This is currently accomplished using
built-in GoldSim capabilities to create and sample stochastic distributions and make repeated model runs
(realizations) in conjunction with the DLL interface’s ability to send sampled parameter values as inputs to the
external codes. The standard version of GoldSim allows the user to run up to four realizations simultaneously.
If the GTG distributed processing module is licensed, an essentially unlimited number of realizations can be
run simultaneously to enhance productivity [10].
SUMMARY OF COMPONENT CODES
A brief description of the selected component codes (STADIUM® and LeachXS™/ORCHESTRA) for the
Phase I code integration is provided in this section. This material is summarized from a previous report where
more detailed descriptions are available [11].
Software for Transport And Degradation In Unsaturated Materials (STADIUM®)
SIMCO Technologies, Inc. has developed a numerical model called Software for Transport and Degradation in
Unsaturated Materials (STADIUM®) that can be used to predict the transport of ions and liquids in reactive
porous media [1]. The model has been used to predict the behavior of numerous existing structures exposed to
1
A third external code, Thermodynamic Hydration And Microstructure Evolution Simulator (THAMES), will be
coupled to GoldSim during the second phase of integration. THAMES is currently under development by U.S.
NIST and acts as a virtual microprobe for cementitious materials [5].
2
WM2011 Conference, February 27 – March 3, 2011, Phoenix, AZ
various forms of chemical degradation phenomena. In particular, the model has been used to estimate the
service life of concrete under attack from chloride and sulfate ions. The results provided by the STADIUM®
model have been validated through laboratory test results and field exposure observations.
Calculations in the STADIUM® model are divided into two primary modules. The first module simulates
coupled transport of ions and water neglecting chemical reactions (e.g., dissolution and precipitation).
Transport is modeled using a volume-averaged version of the extended Nernst-Planck equation that includes
the electrical coupling between the ions and the chemical activity of the species in solution. The transport
equations are coupled to Poisson’s equation, which gives the electrical potential in the material as a function of
the ionic distribution. The impacts of fluid flow, temperature gradients, moisture, and heat conduction are also
included in the first module.
The second STADIUM® module represents a chemical equilibrium code. After each transport step (first
module), the second module equilibrates the concentrations at each finite element with the phases present.
Solid phases can be formed from the transport of species into the pores of the material. This variation of solid
phases will lead to local variations in porosity that will likely affect the local transport properties of the
material. STADIUM® takes this locally varying phenomenon into account in the transport module. The inputs
needed to execute a STADIUM® run are described in Table I [1, 11].
Table I. A Summary of the Inputs Needed to Run STADIUM® [1, 11]
Inputs
Geometry and
Time
Description
Separate sets of calculations are performed for ionic transport
and chemistry. The ionic transport model consists of a set of
partial differential equations that are solved using a finite
element method.
Material
The characteristics of the material to be modeled must be
Properties
entered. The properties to be entered for the material fall into
the following categories: mixture proportions, transport
properties, binder chemical composition, and initial state.
Exposure
Many types of exposure conditions for concrete structures can be
Conditions
modeled. Exposure conditions include the ionic species as well
(Boundary
as temperature and humidity boundary conditions. The user can
Conditions)
modify parameters including average temperature, relative
humidity, salinity of seawater, or concentration of the ionic
contaminant.
Initial Values
Initial values are divided into three sections: moisture and
temperature (initial degree of material saturation and initial
temperature), concentration (initial composition of the pore
solution), and solid phases (initial content of the solid phases
forming the hydrated cement paste for the material).
Corrosion and
The output frequency is defined. How and where corrosion
Printing Options results are to be computed are defined. The frequency and
number of rebar positions to be analyzed can be entered. The
model calculates total chloride content and the
chloride/hydroxide ratio in the pore solution at each rebar
position at the defined frequency.
Additional Information
User provides the space and
time discretization parameters
for the numerical algorithm.
Selected characteristics can be
entered via the integration
framework.
When chloride or sulfate attack
is selected, the user enters the
initial composition of the
solution at the surface.
Initial values must be provided
for each variable in the model
including data on the initial
composition of the hydrated
cement paste.
These options control how
various output files will be
generated.
The output information returned after STADIUM® executes includes [1]:
•
Species concentrations over the material thickness as a function of time,
•
Corrosion-related quantities, in total chloride or the chloride/hydroxide ratio, at specific locations as a
function of time, and
3
WM2011 Conference, February 27 – March 3, 2011, Phoenix, AZ
•
Corrosion initiation results.
Leaching eXpert System (LeachXS™)/Objects Representing CHEmical Speciation and TRAnsport
(ORCHESTRA)
The Leaching eXpert System (LeachXS™) is a database coupled with an expert system for material
characterization and environmental impact assessment based on estimated contaminant release rates derived
from leaching tests [2]. Databases used by LeachXS™ include leaching results for over 600 materials,
scenarios, and regulations to allow comparisons of test data against specific utilization or disposal conditions.
The expert system assists in evaluation and experimental guidance, data management, source term description,
impact evaluation, and decision analysis. Many materials of interest to the CBP have been assessed using
LeachXS™ including: treated and stabilized wastes, construction materials, cement mortars and concrete,
contaminated soils, sludge, and sediments.
Geochemical speciation and chemical reaction/transport modeling capabilities are integrated into LeachXS™
using the ORCHESTRA (Objects Representing CHEmical Speciation and TRAnsport) modeling environment.
ORCHESTRA is a modeling framework for defining geochemical equilibrium models and combining these
models with mass transport (diffusion, convection, etc.) for user-defined scenarios [3]. The ORCHESTRA
chemical module calculates chemical thermodynamic equilibrium similarly to other speciation codes (e.g.,
PHREEQC) but is internally organized very differently. Instead of defining needed equations within the
source code, equations are defined in a separate text file accessed by ORCHESTRA at run-time.
ORCHESTRA has been used in practice for a wide range of applications including aqueous speciation,
precipitation, surface complexation, ion exchange, diffusion, convection, solid solutions, colloid adsorption,
and biotic uptake.
All LeachXS™/ORCHESTRA models contain at least one chemical equilibrium module that describes the
chemical reactions and distribution of elements over different physical-chemical forms in a material. The
inputs needed to run a LeachXS™/ORCHESTRA simulation are described in Table II [2].
Table II. A Summary of the Inputs Needed to Run LeachXS™/ORCHESTRA [2]
Chemical Equilibrium
A set of chemical equilibrium reactions representing the material.
LeachXS™ contains predefined reaction sets for typical
materials in the database; however, alternative sets may be
provided by the user.
A set of total (or available) element concentrations estimated
from total composition measurements or from pH dependent
leaching test results.
The amounts of adsorbing surfaces (including organic matter,
hydrous ferric oxide, aluminum hydroxide, and clay) that can be
estimated by determining oxalate extractable Fe and Al.
Liquid to solid (L/S) ratio.
Reactive Transport
Physical dimensions of the system must be
entered. Flow rates or refresh rates must be
entered for a column simulation or a tank test,
respectively.
Physical properties of each material including
porosity, density and effective tortuosity.
The chemical composition for each solid material
and each solution, including amounts of
adsorbing surfaces.
Water saturation/gas volume.
The main result of a chemical equilibrium calculation is the distribution of elements over the different physical
and chemical forms (including different dissolved, adsorbed, precipitated, and gaseous species) according to
the set of thermodynamic equilibrium reactions provided as input. Other generated outputs are: pH, REDOX
potential, ionic strength, and electrical conductivity. The reactive transport models generate a chemical
composition that is essentially the same as that for a single chemical equilibrium reaction, but as a function of
time and space. In summary the outputs for reactive transport models include:
4
WM2011 Conference, February 27 – March 3, 2011, Phoenix, AZ
•
Chemical composition of the system as a function of time and space (i.e., concentration profiles)
including distribution of elements (over mineral, aqueous, gaseous, and other phases), pH, and
REDOX conditions.
•
Total fluxes of elements over chosen internal or external system boundaries.
PHASE I CODE INTEGRATION DESCRIPTION
All applications involved in the integrated CBP model (including the GoldSim model, the STADIUM® and
Mesh2d executable files, and the DLL code) reside in a single folder that can be stored anywhere on the
computer; LeachXS™/ORCHESTRA is the one exception and must be saved in the Application Data
folder in the user’s home directory. The various calls and files used to couple LeachXS™/ORCHESTRA to the
GoldSim model incorporate the appropriate directory information. The STADIUM® and
LeachXS™/ORCHESTRA programs are subject to licensing considerations.
The various files needed to run the integrated GoldSim model can be separated conceptually into those that
would not normally be modified by the user or simulation software, and those that would be. The files and
directories representing the integrated GoldSim program are structured with this concept in mind. Files that
would normally not be modified include the source code for the Mesh2d program and DLL interface.
The code interface user is expected to work almost exclusively in a single folder (named Template). The full
GoldSim model is provided in this directory in the file named GoldSim_CPB_PhaseI_Rev_8.gsm. The
folder also contains four versions of the DLL code interface. Separate DLL’s are provided for the two- and
three-layer models for STADIUM® and LeachXS™/ORCHESTRA. The differences among these four DLLs
are primarily in the dimensioning of the input and output arrays used to exchange data between GoldSim and
the external programs (via the DLLs).
There are six subfolders in the Template directory that are used for the following functions:
1. The Materials folder contains three spreadsheets that provide composition and physical property
data for various types of concrete (e.g., Types 1 and 2), salt waste forms (e.g., SRS Saltstone Types 1
and 2), and soils to the GoldSim simulation [12]. The initial chemical and mineral compositions and
property values are provided in Table III, Table IV, and Table V.
2. The STADIUM folder contains the input template file used by the DLL interface. Line and column
numbers referenced in the instructions file (e.g., DLL.dat) must conform to the data locations in this
template file [8, 9]. The DLL interface will use this template and the instructions file (e.g., DLL.dat)
to create an input file that will be used to run STADIUM® (and is placed in a realization folder in
Runs folder described below). The STADIUM folder also contains the mesh coordinate and element
files required as input to STADIUM®.
3. The Mesh folder contains the data files used to define the computational grid and output files created
from running the mesh generation program from the GoldSim interface. Creating the mesh also
generates files that can be used to view the grid using Tecplot Viewer and gnuplot, and as a
Visualization Tool Kit (VTK) graphics file suitable for viewing with VisIt and Paraview plotting
software. Mesh files formatted for use by STADIUM® and Porflow are also created in this folder.
4. The ORCHESTRA folder contains two batch files needed to run ORCHESTRA and duplicates of the
folders containing the ORCHESTRA models to be run. Selected files (e.g., containing initial
composition data and physical properties) are updated by the DLL and copied to the appropriate
ORCHESTRA directory for execution, and then the results files are copied to the Runs directory
(described below) for processing by GoldSim using the DLL.
5
WM2011 Conference, February 27 – March 3, 2011, Phoenix, AZ
5. The Runs folder contains subfolders where results from the simulation runs are stored. The DLL
automatically creates a subfolder in the Runs folder for each realization when the save option is
enabled. For deterministic calculations only the subfolder named realization_0 is created.
6. The THAMES folder is currently not used but is included as a place holder for planned Phase II
development work that will create an interface to this additional CBP partner code.
Table III. Input Chemical Compositions (mmol/L)
OHNa+
K+
SO42Ca2+
Al(OH)4ClH2SiO42CO32NO32NO22-
Concrete
Type I Type II
400.00 449.00
282.10 215.00
138.00 234.00
8.00
1.00
0.50
1.00
0.10
0.00
5.00
0.00
0.00
0.00
0.00
0.00
0.00
0.00
0.00
0.00
Salt Waste
Type I
Type II
670.08
766.40
4420.00 4420.00
120.00
120.00
130.70
82.00
0.41
0.30
0.14
0.40
9.00
9.00
9.70
12.50
2.90
0.40
2000.00 2000.00
1575.00 1575.00
Soil
0.5
0.25
0.25
0
0
0
0
0
0
0
0
Table IV. Input Mineral Compositions (g/kg)
Portlandite
CaH2SiO4
Ettringite
Monosulfate
AFmOH
Thaumasite
Calcite
Monocarboaluminate
Gypsum
Concrete
Type I Type II
13.60
29.20
37.90
75.10
0.00
0.00
19.40
29.80
14.80
7.30
0.00
0.00
0.00
0.00
0.00
0.00
0.00
0.00
Salt Waste
Type I Type II
41.90
34.30
103.30
86.40
28.60
30.10
0.00
11.30
0.00
0.00
0.00
0.00
4.80
0.00
11.00
39.20
0.00
0.00
Soil
0
0
0
0
0
0
0
0
0
Table V. Input Physical Parameters
Temperature, C
Water/Binder Ratio
Binder, kg/m3
Aggregates, kg/m3
Binder Density, kg/m3
Porosity
Permeability, m2
OH Diffusion Coefficient, m2/s
Isotherm Parameter b
Concrete
Type I
Type II
23
23
0.38
0.38
405
424
1659
1787
2885
3158.4
0.135
0.12
1.80E-21 1.80E-21
1.40E-11 3.67E-11
-25.928
-25.928
Salt Waste
Type I
Type II
23
23
0.595
0.595
930
930
0
0
2603.5
2603.5
0.65
0.65
4.00E-19 4.00E-19
7.50E-11 7.50E-11
-6.4651
-6.4651
6
Soil
23
0
1291.5
1358.5
3150
0.35
5.00E-11
5.27E-10
-29
WM2011 Conference, February 27 – March 3, 2011, Phoenix, AZ
Isotherm Parameter d
Relative Permeability
Initial Hydration, days
Reference Time, days
Hydration Parameter a
Hydration Parameter a, 1/s
Thermal Conductivity, W/m/C
Specific Heat, J/kg/C
Concrete
Type I
Type II
0.4285
0.4285
18
18
28
28
28
28
0.8
1
0.015
0
2
2
1000
1000
Salt Waste
Type I
Type II
1.7825
1.7825
18
18
28
28
28
28
0.3
0.3
0.003
0.003
2
2
1000
1000
Soil
1.25
18
28
28
1
0
2
1000
GoldSim Integrated Model Controls
The CBP Phase I code integration model currently provides interfaces to the STADIUM® and
LeachXS™/ORCHESTRA external codes. Operation of the interface is controlled through a series of GoldSim
“dashboards” (i.e., screens with simulation control and display functionality) that have been created within the
GoldSim software. When the user first opens the CBP model, the top level dashboard shown in Fig. 2 appears.
Dashboards have been developed so that the user can set up and run a simulation and view the results without
having to interact directly with the underlying GoldSim model or the external codes. The dashboard functions
will be explained in the following sections using an example of running a STADIUM® simulation using the
CBP GoldSim model.
Fig. 2. Top-level GoldSim dashboard for the CBP code integrated model
Selecting the START button in Fig. 2 opens the GoldSim dashboard control shown in Fig. 3 where the user
accesses the simulation controls. These top level simulation controls are used to select either a STADIUM® or
LeachXS™/ORCHESTRA simulation and allow the user to open additional dashboards that can be used to
7
WM2011 Conference, February 27 – March 3, 2011, Phoenix, AZ
create a simulation mesh, modify GoldSim simulation settings, and setup and run a STADIUM® or
LeachXS™/ORCHESTRA simulation.
Fig. 3. GoldSim Simulation Control for the Integrated CBP Model
Mesh Generation for STADIUM® Simulation
Clicking on the STADIUM® Mesh button in the simulation control dashboard takes the user to the mesh
definition dashboard. The user must also enter the number of layers in the model, and the layer dimensions in
the input blocks below the buttons so this information is available to the GoldSim model. The simulation mesh
dashboard allows the user to create input files for the Mesh2d program, run Mesh2d, and view the resulting
grid. Tecplot viewer and Gnuplot plotting software are provided for plotting the resulting mesh because they
do not require licensing costs. The mesh is also written as a VTK graphics file suitable for viewing in VisIt and
Paraview, which are also available at no cost. The text output uses the user's default text editor to view the
mesh file formatted for Tecplot viewing.
GoldSim Simulation Settings
Clicking the Simulation Settings button on the simulation control dashboard Fig. 3 (or selecting the F2
key) opens the GoldSim Simulation Settings window (Fig. 4). The left-most tab (Time) is used to control the
total simulation duration and the time steps used. The simulation duration is passed to the STADIUM® and
LeachXS™/ORCHESTRA codes; however, the time step control is managed separately for both external
codes. For the Phase I calculations, there is no coupling between the codes so, for demonstration purposes, the
codes are run separately and a single GoldSim time step is used.
8
WM2011 Conference, February 27 – March 3, 2011, Phoenix, AZ
Fig. 4. GoldSim settings tab for controlling the Simulation Time
The second tab (Monte Carlo) on the GoldSim simulation settings window is used to specify whether a
deterministic or Monte Carlo simulation is to be made and the parameters to use in either case. For a
deterministic simulation, the parameters representing the Stochastic elements must be specified (from the
element deterministic values, element means, or a specific quantile). For Monte Carlo simulations, the number
of realizations to be made, the results to be saved, and stochastic sampling parameters are set. An example of
the Monte Carlo simulation settings panel is shown in Fig. 5 that were used to run the STADIUM® example
problem described below.
9
WM2011 Conference, February 27 – March 3, 2011, Phoenix, AZ
Fig. 5. GoldSim simulation settings window
Example STADIUM® Simulation using the Integrated GoldSim Model
An example calculation using the STADIUM® code is provided to demonstrate the code interfacing possible
within the GoldSim framework and the capabilities of current versions of the partner codes for problems of
interest to the CBP [12]. The example studies the leaching and diffusion of contaminants from a SRS salt
waste (Saltstone) through a concrete barrier into the environment and the durability of the concrete barrier over
time. The test case modeled represents one-dimensional diffusion through a two-layer system consisting of 50
cm of SRS Saltstone and 20 cm of concrete. Each layer was assigned 50 nodes using the Mesh2d program that
is included in the CBP integration software (as described above).
Clicking the STADIUM button on the simulation control dashboard (Fig. 3) opens the STADIUM® simulation
control dashboard shown in Fig. 6. This dashboard allows the user to enter the basic information used for a
STADIUM® simulation (where there is an analogous control for running LeachXS™/ORCHESTRA). Using
the group of inputs labeled Scenario Options, the user selects whether a two- or three-layer system is
modeled. The material in each layer is selected from a list of available materials, and the layer thickness is
entered. The user specifies the standard deviation (Concentration RSD) applied to the initial compositions
for use in probabilistic calculations. For probabilistic calculations, the compositions provided in the materials
property spreadsheets are currently assumed to be the mean values of Gaussian distributions with the relative
standard deviations specified. Additional distributions for concentrations will be considered during the next
phase of the CBP code integration.
The General Run Settings block on the STADIUM® run control dashboard contains four text boxes
that allow the user to enter time step control parameters for the STADIUM® simulation [1] and a box where
the number of nodes in the mesh are entered. A check box is also provided where the user selects whether or
not to save the output from individual STADIUM® realizations in separate folders. Other options for running
STADIUM® models are provided in additional GoldSim control dashboards.
10
WM2011 Conference, February 27 – March 3, 2011, Phoenix, AZ
Fig. 6. STADIUM® simulation control dashboard
The simulation control dashboard and the underlying GoldSim model provide the data needed to run the
STADIUM® code via the DLL interface [8, 9]. Clicking the Run Simulation button in the Simulation
Controls box (or selecting the F5 key) begins the two-layer simulation described in Fig. 6. Buttons are
provided on the simulation control dashboard to allow the user to view both the inputs to the STADIUM®
code and the results returned from the simulation(s). Clicking the View Results button opens the dashboard
shown in Fig. 7 which allows the user to view predefined graphs of STADIUM® results for a particular
mineral or chemical. These graphs are generated using the built-in GoldSim plotting functions. Results
available for plotting are those transferred back to GoldSim from the STADIUM® output files through the
DLL interface.
11
WM2011 Conference, February 27 – March 3, 2011, Phoenix, AZ
Fig. 7. GoldSim Dashboard control for viewing selected STADIUM® results
An example GoldSim graph is shown in Fig. 8 for the concentration of chlorine (Cl) at each computational
(STADIUM®) node is plotted. The plot in Fig. 8 is for 100 years into the simulation of a two-layer system (see
Fig. 6) with the interface between the layers at node 50. GoldSim results capabilities are primarily designed to
produce time history graphs. Plots of special distributions, which may be of significant interest for evaluating
the performance of cementitious materials, can be created in GoldSim but the results may not suffice for all
purposes. In general the Phase I dashboard controls can be used to create quick plots of the results from the
external codes. As a Phase II enhancement, additional plotting capabilities will be provided through the code
interface.
Fig. 8. Example GoldSim results display plot for chloride (Cl) STADIUM® results by node
12
WM2011 Conference, February 27 – March 3, 2011, Phoenix, AZ
CBP PHASE II CODE INTEGRATION PLAN
Fig. 9 shows a diagram of the planned CBP Phase II code integration framework. Solid arrows show the
existing framework. Dashed arrows indicate additional capabilities planned for the next phase of integration.
Fig. 9. CPB Phase II Code Integration Framework
Items that will be addressed in Phase II of the CBP code integration include:
•
The DLL interface will be improved to include additional text handling capabilities and enhanced
error trapping. Other improvements will be made to the interface as needed.
•
Improved data visualization capabilities will be added to the CBP integrated model by including a
direct interface from GoldSim to plotting software. The Phase I code provides the ability to view
simulation results using built-in GoldSim graphics, but this approach can be somewhat limited
especially for spatial data. In Phase II the methodology currently used to display the mesh will be
extended to the display of simulation results using a DLL interface to an external plotting code.
•
A composition and material property database is under development that will be linked to GoldSim
and thereby available for use by the CBP codes.
•
GoldSim will be coupled to the NIST THAMES code using the existing DLL interface.
•
The CBP partner code calculations will be coupled for important phenomena (e.g., cracking) to reduce
uncertainty in the results.
CONCLUSIONS
The CBP Phase I code integration work has developed an integration methodology and demonstrated its
applicability with the STADIUM® and LeachXS™/ORCHESTRA codes. The code integration was
accomplished using the GoldSim software and a generalized DLL to interface with other codes. GoldSim,
using the DLL interface, allows the user to perform probabilistic or deterministic simulations with the partner
CBP codes. The generalized DLL can be used to couple GoldSim to any such code that uses text files to
control program execution and save results.
13
WM2011 Conference, February 27 – March 3, 2011, Phoenix, AZ
Currently, the user can work entirely with the GoldSim interface to modify important input to the linked CBP
codes, run simulations using these codes, and view the results from the codes. The user is able to select the
materials used in the simulation and modify important material properties and initial compositions within the
GoldSim model. The integration software also allows the user to control simulation numerics without working
directly with the codes. Using the GoldSim interface, the external codes can be run either deterministically or
probabilistically. For this initial phase of CBP code integration, operation of the partner codes is not coupled –
the codes are run independently. Methods to view simulation results are also somewhat limited within the
existing integrated framework. These and other issues will be addressed in the second phase of the code
integration effort described in the following Section. The methods and software developed as part of the Phase
I code integration effort can be directly applied to other external codes.
ACKNOWLEDGEMENT AND DISCLAIMER
This report was prepared for the United States Department of Energy under Interagency Agreement No. DEAI09-09SR22667 and is an account of work performed under that contract. Reference herein to any specific
commercial product, process, or service by trademark, name, manufacturer, or otherwise does not necessarily
constitute or imply endorsement, recommendation, or favoring of same by Savannah River Nuclear Solutions
or by the United States Government or any agency thereof. The views and opinions of the authors expressed
herein do not necessarily state or reflect those of the United States Government or any agency thereof. This
report is part of a larger multi-investigator project supported by the U. S. Department of Energy entitled the
Cementitious Barriers Partnership. The opinions, findings, conclusions, or recommendations expressed herein
are those of the authors and do not necessarily represent the views of the U.S. Department of Energy. This
work was also partially supported by the National Institute of Standards and Technology Sustainable Concrete
Materials program.
and
This report is based on work supported by the U. S. Department of Energy, under Cooperative Agreement
Number DE-FC01-06EW07053 entitled ‘The Consortium for Risk Evaluation with Stakeholder Participation
III’ awarded to Vanderbilt University. The opinions, findings, conclusions, or recommendations expressed
herein are those of the author(s) and do not necessarily represent the views of the Department of Energy or
Vanderbilt University.
Disclaimer: This work was prepared under an agreement with and funded by the U. S. Government. Neither
the U.S. Government or its employees, nor any of its contractors, subcontractors or their employees, makes
any express or implied: 1. warranty or assumes any legal liability for the accuracy, completeness, or for the use
or results of such use of any information, product, or process disclosed; or 2. representation that such use or
results of such use would not infringe privately owned rights; or 3. endorsement or recommendation of any
specifically identified commercial product, process, or service. Any views and opinions of authors expressed in
this work do not necessarily state or reflect those of the United States Government, or its contractors, or
subcontractors, or subcontractors.
REFERENCES
1. SIMCO, “Software for Transport And Degradation in Unsaturated Materials (STADIUM) Version 2.8
User Guide”, SIMCO Technologies, Inc. (2008).
2. ECN, “LeachXS User Manual”, Energy research Centre of the Netherlands (2007).
3. J.C.L. MEEUSSEN, “ORCHESTRA: An Object-Oriented Framework for Implementing Chemical
Equilibrium Models”, Environmental Science & Technology, 37(6), 1175-1182 (2003).
4. GTG, “GoldSim User's Guide: Probabilistic Simulation Environment (Volume 1 of 2; Version 10.0)”,
GoldSim Technology Group (2009).
5. K.G. BROWN and G.P. FLACH, “Detailed Description of the GoldSim Integrating Platform Selected for
the CBP Project”, CBP-TR-2009-003, Rev. 0. Vanderbilt University/CRESP and Savannah River National
Laboratory; Cementitious Barriers Partnership (2009).
14
WM2011 Conference, February 27 – March 3, 2011, Phoenix, AZ
6. T. EARY, “Example 3: Direct Linkage between GoldSim and PHREEQC through a ‘DLL’ Element”,
GoldSim Technology Group (2007).
7. P.D. MATTIE, R.G. KNOWLTON, and B.W. ARNOLD, “A User’s Guide to the GoldSim/BLT-MS
Integrated Software Package: A Low-Level Radioactive Waste Disposal Performance Assessment Model”,
Report No. SAND2007-1354. Sandia National Laboratories (2007).
8. F.G. SMITH III, G. FLACH, and K.G. BROWN, “CBP Code Integration GoldSim DLL Interface”, CBPTR-2010-009-2, Rev. 0. Savannah River National Laboratory and Vanderbilt University/CRESP;
Cementitious Barriers Partnership (2010).
9. K. G. BROWN, F.G. SMITH III, and G. FLACH, “GoldSim Dynamic-Link Library (DLL) Interface for
Cementitious Barriers Partnership (CBP) Code Integration”, manuscript submitted to Waste management
2011, Vanderbilt University/CRESP and Savannah River National Laboratory; Cementitious Barriers
Partnership (in Press).
10. GTG, “GoldSim Distributed Processing Module User's Guide (Version 10.0)”, GoldSim Technology
Group (2009).
11. CBP, “Description of the Software and Integrating Platform (Contains 4 Chapters),” CBP-TR-2009-003,
Rev. 0, Cementitious Barriers Partnership, Available from: http://cementbarriers.org/reports.html (2009).
12. SIMCO, “Demonstration of STADIUM® for the Performance Assessment of Cementitious Structures,”
CBP-TR-2010-0007-C3, Rev. 0. SIMCO Technologies Inc. and Cementitious Barriers Partnership,
Available from: http://cementbarriers.org/reports.html (2010).
15