1
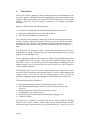
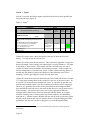
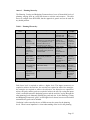
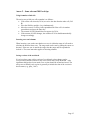
PLANNING
COSTING
&
BUDGETING
FRAMEWORK
USER’S MANUAL
August 2007
David Collins
Management Sciences for Health
Page 1
The Planning, Costing and Budgeting Framework was developed by David Collins of
Management Sciences for Health. No part of the framework or this accompanying
manual may be reproduced or transmitted without prior permission of Management
Sciences for Health. In any use of the framework or manual, credit must be given to
Management Sciences for Health.
The use of the spreadsheet-based tool requires a license for Microsoft Excel, available
under license from Microsoft Corporation. This tool is not a product of Microsoft
Corporation and is not guaranteed by that company.
Page 2
Acknowledgements
The framework was originally developed for workshops organized and hosted by
UNAIDS Eastern and Southern Africa and which were held in Lusaka, Zambia in
2002 and in Dar es Salaam, Tanzania in 2003.
Thanks go to Bunmi Makinwa, Team Leader, Inter-country Team ESA, UNAIDS and
other staff from UNAIDS and UNDP for contributing towards the development of the
original framework.
Page 3
I.
Introduction
The need for effective planning, costing and budgeting tools and methodologies has
never been greater. Significant amounts of funding have been made available to help
countries combat major health crises such as HIV/AIDS, malaria and TB, and yet the
funding is often not accessed because of weaknesses in the plans and budgets
submitted.
Specific weaknesses often encountered include:
•
•
•
The absence of quantified, time-bound measurable goals and objectives.
The incorrect quantification of activities and resources
The inaccurate calculation of resource costs.
An overall and critical weakness in many cases is the lack of clear linkages between
activities, strategies, objectives and goals. In such cases it is not clear how much the
completion of a set of activities will contribute to the achievement of an objective, or
how much the achievement of an objective will contribute to the achievement of a
goal.
This framework was developed to help overcome these weaknesses by providing a
methodology for setting out elements of a plan and for translating these into costs and
budgets in a clear and logical way.
It was originally developed to assist countries in Eastern, Central and Southern Africa
to strengthen their local capacity to develop their National Strategic Plans for
HIV/AIDS. However, it has also been used in the planning and budgeting of other
health programs, such as child survival, and can be used for any type of health or
other development activities.
The framework can be used as a tool for a simple planning and costing exercise and it
can also be used to summarize and present the results of a more complex planning and
costing exercise. It can also be used for teaching purposes since it shows the
principles of planning, costing and budgeting in a practical and easy-to-follow way.
The framework provides a method for:
•
•
•
•
•
•
Setting out quantified, time-bound measurable goals and objectives.
Describing and quantifying the activities needed to achieve the goals and
objectives.
Showing the resources required to carry out the activities.
Calculating the costs of the resources,
Showing the sources of funding and estimating financing gaps, and
Producing a budget.
The framework is structured to encourage the user to clearly identify the linkages
between each of these elements, which means that the budget should accurately
reflect the resources required to achieve the goals and objectives. However, the use of
Page 4
additional formulas is required if the costs are to be linked automatically to the
outcomes or outputs in the spreadsheets.
The framework is best used by planners, program managers and financial analysts as a
team, since this should help to improve their planning and budgeting skills and their
understanding of the relationship between the programmatic and financial elements.
The resulting plan should be more logical and realistic and more likely to be funded
and successfully implemented.
Page 5
II.
Layout and Methodology of the Framework
The Planning, Costing and Budgeting Framework is laid out in a logical, step-by-step
format, which:
•
Encourages the user to move from each goal down through the planning levels
to the activities and inputs level, which accentuates the need to quantify each
level and to link each level to the preceding level.
•
Encourages the identification and quantification of the critical inputs needed
for each activity and putting a cost to each of these inputs, thereby arriving at
an informed cost of each activity, strategy and objective.
•
Shows the funding commitments for the plan and provides estimates of the
funding gap.
The Framework uses common planning terminology which is explained in Annex 1.
The planning, costing and budgeting framework is provided in a Microsoft Excel
spreadsheet workbook.1 It includes a blank version and an example of a completed
plan covering one Goal and two objectives. The example shows the formulas used to
calculate figures and totals. The blank version only includes formulas that are needed
irrespective of the specific contents.
While the framework can be used purely as a layout for a plan, it is best done on a
spreadsheet, which will allow for the automatic calculation of figures, such as total
inputs and costs and the impact of inflation. If the relationships between the indicators
for the different planning levels are also set out as formulas in the spreadsheet, the
framework can be used as a dynamic model. For example, if formulas are used to
relate the costs to number of inputs, the numbers of inputs to the numbers of activities
and the numbers of activities to the number of outputs shown for the objective, then
the costs can be adjusted automatically by adjusting the number of outputs (see Annex
3 for more discussion).
The framework is divided into two separate spreadsheets: a Background Data Sheet
and a Planning Sheet. These are described in the following sections. When reading
the guide it is useful to refer to the spreadsheet example.
It is important to note that the data and calculations used in the example are not
from a real situation.
Note that colours were used in the example to indicate the way the cells in the
spreadsheets are used:
• The cells coloured grey are not to be used
• The cells coloured green contain formulas that are used to pull the information
from another part of the workbook.
1
The use of the spreadsheet-based tool requires a license for Microsoft Excel, available under license from
Microsoft Corporation. This tool is not a product of Microsoft Corporation and is not guaranteed by that company.
Page 6
•
The uncoloured cells are intended for use.
The workbook has not been protected so it is best to save an original version before
starting to make changes.
Note also that some tips on using Microsoft Excel are attached in Annex 2. These
include using formulas to link cells, adding rows and columns, and saving versions of
the workbook
Background Data Sheet
The Background Data Sheet contains common population, input and cost data used in
the plan. Most of the data used in the Planning Sheet are drawn from the Background
Data Sheet. This avoids cluttering the Planning Sheet and also avoids having to enter
the same data more than once. It also means that if it is necessary to change a figure
used in different parts of the plan it only has to be changed once in the Background
Data spreadsheet.
As the user moves through each section of the Plan and determines which data are
required, that data should be entered in the Background Data spreadsheet.
Planning Sheet
The Planning Sheet contains all the elements of the plan – the descriptions, targets,
inputs, unit costs, total costs and financing.
Vertically, the Plan spreadsheet is divided into sections as follows:
•
•
•
Introduction
Goals Summary
Descriptions of goals, objectives and strategies.
1. Introduction
The Introduction section is used to enter some basic information on the plan. Most of
this is self-explanatory except for the following:
• Version date: this should be entered manually every time the plan is changed.
• Inflation rate: this figure is used to inflate the cost estimates automatically in
the second and subsequent years of the plan. It should be set at whatever rate
is likely for the currency used and can also be set at zero if required.
Page 7
Figure 1 - Introduction
INTRODUCTION
NAME OF PLAN:
PLAN PREPARER:
PERIOD COVERED
VERSION DATE:
CURRENCY:
INFLATION RATE:
Ruritania HIV/AIDS Plan
Lead - Nancy Kumalo
5 years from 1st January 2008 through 31st December 2012
1st August 2007
US$
5%
2. Goals summary
The Plan spreadsheet has a Goals Summary near the top which is used to show an
overview of the goals contained in the plan, together with the target for each goal.
Each goal is entered on a separate line. The description should be the same as the one
entered in the main section of the plan.
Under the Target description column enter the description for the target for each goal.
The example shows that the target is the figure to be achieved in Year 5. In some
cases it could be the total for the planning period (e.g. persons treated).
Under the Target column enter the target figure. This should be linked to the figure
shown for each goal in the main body of the plan for the total over 5 years so that it
will update automatically. In the example, each target figure in the summary is linked
to the figure for each goal in Column O.
Figure 2 – Goals summary
GOALS SUMMARY
Description
GOAL 1: Reduce the number of new HIV infections per year
GOAL 2: Provide treatment and care for all persons with HIV/AIDS
GOAL 3: Reduce the impact of HIV/AIDS on individuals, families and communities
Target
description
Year 5
Year 5
Year 5
Target
7.5%
2,330,527
2,330,527 infected persons
3. Goals, objectives and strategies
The rest of the Plan spreadsheet contains the main body of the plan. This is divided
into sections, both vertically and horizontally.
Vertically there is a section for:
• Each goal,
• Each objective under a goal,
• Each strategy under an objective.
Horizontally, the sections are also divided into sections and each section is comprised
of a group of columns. The horizontal sections are described in the following
paragraphs.
Note that each column has been given an identification letter to help explain the
framework. They are not the column letters allocated by Microsoft Excel, although
Page 8
they coincide in the example. If another column is inserted into the actual spreadsheet
the identifying letter will no longer be the same as the Excel column letter. The user
can either leave the new column without an identifying letter or can use a different
format (eg B(2).
Section 1 - Description
Section 1 is used to describe the goals, objectives, strategies and activities and to
describe and show the indicators (Figure 3). Note that the heading of each section is
shown in the second row in the top grey area of the figure.
Figure 3 – Description
A
B
C
DESCRIPTION
D
Notes
INDICATOR
Target
#
DESCRIPTION
OBJECTIVE (O) STRATEGY (S) ACTIVITY (A)
GOAL 1: Reduce the number of new HIV
infections per year
Number
Objective 1: Make voluntary counselling and testing
services available to all sexually active persons at risk
(30%)
S1.1. Expand VCT services to all PHC facilities
A1.1.1 Train 2 Nurse/Practitioners in VCT per PHC facility
A1.1.2. Increase number of VCT sites by
A1.1.3. Test all persons at risk
Total Strategy 1.1.
New infections
Persons in Y5
Total sites
Nurses trained
Additional sites
Total for 5 years
7.5%
463,839
1,021,805
300
580
290
5,506,071
The first section has 4 columns – A, B, C and D.
Column A is used to enter a brief description of each goal, objective, strategy and
activity. Each goal, objective etc is numbered. Strategies are indicated by using the
letter “S” and activities by using the letter “A”. (See Annex 1 for a description of the
relationships between goals and objectives etc.).
Column B can be used to enter a reference number to a note made at the bottom of the
spreadsheet.
Column C is used to enter a description of the target indicator used for each goal,
objective, strategy and activity. The description should state if, for example, the
indicator is the figure for the final year or the total over the length of the plan. Each
target represents an output.
Column D is used to show the target indicator. These cells should be linked to the
corresponding cells in the Units section (Section 3 as described below) so that they
are automatically updated when changes are made. This could be the figure in the
column for the last year of the plan or in the Total Column. In the example the
figures are linked to the figures in Column O or P.
Page 9
Section 2 – Inputs
Section 2 is used to describe the inputs required for the activities and to quantify the
units and unit costs (Figure 4).
Figure 4 - Inputs2
A
E
DESCRIPTION
OBJECTIVE (O) STRATEGY (S) ACTIVITY (A)
Description
F
INPUTS
Units
Measure
G
H
I
# Units
Unit
per Output Cost Y 1
Cost
Type
1
1
1
C
G
E
GOAL 1: Reduce the number of new HIV
infections per year
Number
Objective 1: Make voluntary counselling and testing
services available to all sexually active persons at risk
(30%)
S1.1. Expand VCT services to all PHC facilities
A1.1.1 Train 2 Nurses in VCT per PHC facility
A1.1.2. Increase number of VCT sites by
A1.1.3. Test all persons at risk
Total Strategy 1.1.
Training
Furn & Equipment
VCT testing kits
Nurse/course
Set
Kit
837.50
200.00
3.00
Total Objective 1
Column E is used to enter a brief description of the type of input used for each
activity. It is only used at the activity level.
Column F is used to enter the unit measure. This is the unit of input that is required to
achieve the output. In the example, the output target is to train 580 nurses. The input
is described as “nurse/course” which means each nurse will take only one course.
Column G is used to state the number of input units per output. In the example, the
unit for training nurses is one nurse/one course. If three separate training courses are
needed, then the number of units would be three to show that each nurse will be
attending 3 courses (providing the courses have the same cost).
Column H is used for the unit cost and must be the cost of each unit shown in Column
G. For the nurse training shown in the example it is the cost of one nurse/course. So,
it costs $837.50 to put one nurse through one course. It is possible to enter the cost
directly in this column if there is just one composite cost (such as a BCC campaign).
However, it is generally best to enter all the costs details on the Background Data
sheet and link the total unit costs to the totals on that sheet (see cost per nurse/course
in the example). One reason is that a unit cost is often comprised of different
elements and it is better not to clutter the main plan with the details. An example
would be a training course, which can have per diems, transport, accommodation,
materials etc.). Another reason is that this unit cost may be used several times within
the plan, and if all those unit costs are linked to the one cell in the Background Data
spreadsheet, then the user only has to change the cost in the Background Data
2
Column A is not adjacent to Column E in the spreadsheet but is shown here to help explain the
relationships.
Page 10
spreadsheet and it will automatically change in each place in the plan. (This only
applies if all the training courses have the same cost).
Note that the unit cost entered into Column H is the estimated unit cost in Year 1 of
the plan. If the user has the historical unit cost for a previous year, then it may need
to be inflated to be realistic for Year 1. The model assumes that the cost of the input
does not change over the years covered by the plan, other than for inflation, which is
automatically taken into account as described later.
Column I is used to enter a code letter to identify the type of cost. This can follow a
government account code structure or that of a major donor, such as the Global Fund.
The codes can be used to help aggregate the costs by cost type. (This can be done
automatically but the required format and formulas have not been included at this
time.)
Section 3 – Units – targets and inputs
Section 3 is used to show the total numbers of outputs and inputs (quantities, not
monetary values) (Figure 5).
Figure 5 – Units – targets and inputs
A
J
K
L
DESCRIPTION
OBJECTIVE (O) STRATEGY (S) ACTIVITY (A)
GOAL 1: Reduce the number of new HIV
infections per year
Number
Objective 1: Make voluntary counselling and testing
services available to all sexually active persons at risk
(30%)
S1.1. Expand VCT services to all PHC facilities
A1.1.1 Train 2 Nurses in VCT per PHC facility
A1.1.2. Increase number of VCT sites by
A1.1.3. Test all persons at risk
Total Strategy 1.1.
Y0
Y1
M
N
UNITS (TARGETS AND INPUTS)
Y2
Y3
Y4
O
Y5
P
TOTAL
10.0%
9.5%
9.0%
8.5%
8.0%
7.5%
800,000
712,500
637,335
572,027
514,685
463,839
1,200,000
10
1,176,000
300
1,142,280
300
1,103,423
300
1,062,562
300
1,021,805
300
5,506,071
20
0
1,200,000
580
290
1,176,000
0
0
1,142,280
0
0
1,103,423
0
0
1,062,562
0
0
1,021,805
580
290
5,506,071
Column J is used to enter the estimated actual figures for the current year (Year 0)
which should be the base year. These figures are not included in the calculations and
are for comparison only. The cells can even be left empty from the perspective of the
cost estimates although the information is needed for proper planning. Ideally, these
figures are entered in the Background Data sheet and linked to the figures in this
Section.
Columns K through O are used to enter the targets for each year (in this example, for
a 5-year plan). In the example, 20 nurses were already trained in the base year and
the remaining 580 were included in the plan under Year 1. No further training was
deemed necessary in the following years. Ideally, these figures are entered in the
Background Data sheet and linked to the figures in this Section.
Column P shows the total numbers of outputs and inputs over the plan years. The
base year is excluded so the total reflects the number achieved during the years
Page 11
planned. These figures are calculated automatically and it is not necessary to enter
the figures manually.
Note that totals are not calculated for each year since the figures in each column are
not compatible (e.g., numbers of nurses trained and kits),
Section 4 – Total Costs
Section 4 shows the total costs for each activity, strategy and objective (Figure 6).
The total for each strategy is the sum of the figures for all the activities under the
strategy.
Figure 6 – Total costs
A
Q
R
S
T
TOTAL COSTS
DESCRIPTION
OBJECTIVE (O) STRATEGY (S) ACTIVITY (A)
Y1
Y2
Y3
Y4
U
Y5
V
TOTAL
GOAL 1: Reduce the number of new HIV
infections per year
Number
Objective 1: Make voluntary counselling and testing
services available to all sexually active persons at risk
(30%)
S1.1. Expand VCT services to all PHC facilities
A1.1.1 Train 2 Nurses in VCT per PHC facility
A1.1.2. Increase number of VCT sites by
A1.1.3. Test all persons at risk
Total Strategy 1.1.
485,750
58,000
3,528,000
4,071,750
0
0
3,598,182
3,598,182
0
0
3,475,784
3,475,784
0
0
3,347,071
3,347,071
0
0
3,218,687
3,218,687
485,750
58,000
17,167,724
17,711,474
Columns Q through U show the total costs for each year and Column V shows the
total costs for all the years planned (5 in the example). All of these figures are
calculated automatically with formulas that multiply the unit cost in Column H by the
number of units in each of the Units columns (K though O). In years 2 and beyond
inflation is also included in the formula using the figure entered in the Introduction
section.
Section 5 – Financing and responsibility
Section 5 can be used to show the sources of the financing for the plan, the gap and
also the agency responsible for implementation (Figure 7).
Figure 7 – Financing and responsibility
Page 12
A
W
X
FINANCED BY
DESCRIPTION
OBJECTIVE (O) STRATEGY (S) ACTIVITY (A)
Gov't
Donor
Y
Z
AA
Financing
AB
Resp.
Other
Total
Gap
Agency
GOAL 1: Reduce the number of new HIV
infections per year
Number
Objective 1: Make voluntary counselling and testing
services available to all sexually active persons at risk
(30%)
S1.1. Expand VCT services to all PHC facilities
A1.1.1 Train 2 Nurses in VCT per PHC facility
A1.1.2. Increase number of VCT sites by
A1.1.3. Test all persons at risk
Total Strategy 1.1.
NDOH
480,000
10,000,000
10,480,000
6,000,000
6,000,000
0
480,000
0
16,000,000
16,480,000
5,750
58,000
1,167,724
1,231,474
Columns W, X and Y are used to enter the funding from different sources. If there
are multiple finance sources it would be better to show these on another spreadsheet
and just link the totals here to the totals on the other spreadsheet. In the example,
Column W shows the amount to be financed by the government.
Column Z shows the total for Columns W, X and Y. These figures are calculated
automatically.
Column AA shows the financing gap which is the difference between the total costs in
Column V and the total financing in Column Z. These figures are calculated
automatically.
Column AB can be used to show the name of the agency responsible for
implementation and can be completed for activities, strategies and objectives. In the
example, the National Department of Health (NDOH) is shown as having overall
responsibility for the objective.
Converting the costing to a budget
The costing of the plan is a “needs-based” costing since at this stage it assumes that
all the funding will be available. If the amount of funding available is less than the
total cost, then either the costs or the activities have to be reduced for the costing to
become a budget.
The first step is to review the activities, inputs and costs to see if there are cheaper
ways to carry them out without reducing the quality of the results.
If that possibility has been eliminated then the goals, objectives, strategies and
activities may need to be reduced and some of them may need to be eliminated
completely. Removal of activities, strategies or objectives should be carried out with
care since they generally form parts of packages required to achieve the goals and
removing one or more may result in the goals not being achieved. Reducing the
number of units per output is not recommended since it is likely to reduce quality, for
example, less training for a nurse. Reductions should, therefore, generally be made
by changing the target population, providing the target and numbers of activities have
been linked to the target population.
Page 13
The above changes should not be made in the original workbook which should be
saved and retained. Instead a copy should be made and the adjustments are then made
in the copy. The original plan represents a “needs-based” plan and should be kept for
advocacy for additional funding. The reduction in interventions and funding reflect
the unmet needs of the programme, and this should be noted in the narrative
accompanying the plan.
After the plan has been adjusted to match the available funding it effectively becomes
a budget.
Page 14
Annex 1 – Planning hierarchy
The Planning, Costing and Budgeting Framework used a set of hierarchical levels of
planning; ranging from an overall aim down to activities and resources. The table
shows an example from HIV/AIDS, but the approach is generic and can be used for
any health problem.
Table 1. Planning Hierarchy:
Hierarchical
level
Aim
Definition
Example
Overall desire
Reduce morbidity and mortality
Goals
Summarised
elements
required to
achieve the aim
Objectives
Detailed
elements
required to
achieve each
goal
Combinations of
interventions
used to achieve
each objective
Reduce the number of new HIV
infections per year from 20,000
(10% of population) in year
2000 to 5,000 (2.5% of
population) in year 2005
Provide voluntary counselling
and testing services to 100% of
the sexually active persons at
risk from 2002
Strategies
Expand VCT services to all
public primary health care
facilities
Activity
Each
intervention used
in a strategy
Train 2 nurses in VCT in each
public PHC facility
Inputs
The resources
required to
implement each
activity
Treatment guidelines for each
nurse
Indicator type
Impact.
Morbidity and
mortality rates
Outcome.
Number of
persons infected
by HIV per year
Final output.
Number of
persons
counselled and
tested
Intermediate
output. Number
of facilities
providing VCT
services
Intermediate
output. Number
of nurses trained
Input. Copies of
guidelines
received
Target
example
Increase in
life
expectancy
75%
reduction
(15,000 less
people per
year)
30,000 people
in 2002
Expand from
10 to 300
facilities by
2001
Expand from
20 to 600
trained nurses
in 2001
600 copies
received by
the trained
nurses in
2001
Reference “Guidelines for District Health Planning and Reporting, April 2003, National Department of Health,
Republic of South Africa.
Each lower level is required to achieve a higher level. The inputs (resources) are
required to achieve the activities, the activities are required to achieve the strategies,
the strategies are required to achieve the objectives, the objectives are required to
achieve the goals, and the goals are required to achieve the aim. By costing the inputs
a link is created between the budgeting process and the activities, and up through the
other planning levels ultimately attaining the goals and aim. In the Planning, Costing
and Budgeting Framework “goals” are the highest level shown, but an overall aim that
summarises the goals can be included.
Confusion is often caused by the use of different words or terms for the planning
levels. What is most important is a clear understanding of the level in the planning
Page 13
hierarchy – how the level being described relates to the level above it and the level
below it.
Alternative terms for some of the different planning levels are shown in Table 2.
Table 2 – Alternative planning terms
Level 1
Level 2
Level 3
Level 4
Level 5
Level 6
Page 14
Per Table 1
Aim
Goals
Objectives
Strategies
Activities
Inputs
Alternative
Vision
Strategic objectives
Strategies
Intermediate results
Resources
Annex 2 – Some relevant MS Excel tips
Using formulas to link cells
The easiest way to link one cell to another is as follows:
• Click on the cell selected (Cell A) to receive the data from the other cell (Cell
B).
• Press the Shift key and the + key simultaneously.
• Move the cursor to Cell B (via the spreadsheet tab if the cell is in another
spreadsheet) and press the Enter key.
• The content of Cell B should also now appear in Cell A.
• If the content of Cell B changes, the content of Cell A should automatically
change accordingly.
Inserting rows and columns
When inserting a row, make sure that the new row is within the range of cells used to
calculate the total for those rows. The range used can be seen by putting the cursor on
the total. If the new row is outside the range, then the range must be expanded to
include it. The same instruction applies to inserting columns.
Saving versions of the workbook
It is wise to keep some earlier versions of a workbook so that changes can be
reviewed easily and the reasons for any errors can be more easily identified. After
significant changes have been made a new version should be created and saved. The
easiest was to identify each version is generally to include the date of the version in
the file name (e.g., plan_3.4.07).
Page 15
Annex 3 - Planning linkages
The achievement of the aim of a plan depends on the accomplishment of all of the
elements of the plan, which, in turn, depends on the provision and proper use of the
necessary inputs (resources). The inputs (resources) are required to achieve the
activities, the activities are required to achieve the strategies, the strategies are
required to achieve the objectives, the objectives are required to achieve the goals,
and the goals are required to achieve the overall aim.
When the inputs are properly costed, a link is created between the costs and the
activities, and up through the other planning levels to the goals and aim. If sufficient
funding is not available, the elements of the plan and the related costs must be
reduced so that they match with the available funding, and the resulting costs become
the basis for a budget. When those adjustments are made, the integrity of the linkages
between the various levels of the plan must be maintained.
In a simple model, the targets and numbers of activities can often be driven by the
catchment population. However, in some cases, the modeling involves more complex
relationships and is not wholly dependent on the population. For example, a target
figure for condoms will rely partly on an estimate of the number of sexually active
men, which is based on the population. The number of new infections is based partly
on the population but is also based on the infection rate, which is affected by the
number of sexually active men using condoms properly.
The purpose of the framework is to provide structure to planning, costing and
budgeting, not to serve as a model. Modelling was, therefore, not used in
deriving the figures used in the example and the data and calculations used in the
example are not from a real situation.
Page 16