1
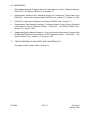
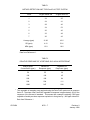
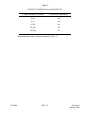
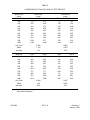
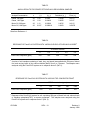
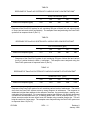
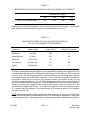
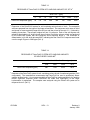
METHOD 9074
TURBIDIMETRIC SCREENING METHOD FOR TOTAL RECOVERABLE
PETROLEUM HYDROCARBONS IN SOIL
1.0
SCOPE AND APPLICATION
1.1
This method may be used to screen soil samples to determine the total amount of
recoverable petroleum hydrocarbon contamination in soil including a wide range of fuels, oils, and
greases. The turbidimetric approach in this method is designed to quickly screen soil samples using
a system calibrated with a blank and a single calibration standard.
1.2
The definition of total recoverable petroleum hydrocarbons for this method can be found
in the section on definitions (Sec. 3.0).
1.3
This screening technique is specifically designed to be used in the field but may also
have some screening applications in the laboratory. The system analysis range is 10-2000 ppm for
most hydrocarbons.
1.4
This method is considered a screening technique because of the broad spectrum of
hydrocarbons it detects. The method may be especially useful in quickly determining that a site does
not contain hydrocarbon contamination. However, it cannot be used to determine specific
hydrocarbon compounds or groups of compounds that may be part of a larger hydrocarbon mixture.
As with other screening techniques, it is advisable to confirm a certain percentage of both positive
and negative test results, especially when near or above a regulatory action limit or when the
presence of background or interfering hydrocarbons is suspected. The limitations of this procedure
are described in more detail in the section on interferences (Sec. 4.0).
1.5
This method does not address the evaporation of volatile petroleum hydrocarbon
mixtures (i.e. gasoline) during sample collection, preparation, and analysis. Although the screening
kit can be used to qualitatively detect volatile hydrocarbons, it is NOT recommended that the system
be used to quantitatively determine volatile petroleum hydrocarbons unless evaporation during
sample handling is addressed, appropriate response factor corrections are made, and method
performance is demonstrated on real world samples.
1.6
This method is restricted to use by or under the supervision of trained analysts. Each
analyst must demonstrate the ability to generate acceptable results with this method.
2.0
SUMMARY OF METHOD
2.1
A 10 ± 0.1 g sample of soil is extracted with a solvent mixture composed primarily of
methanol. The resulting mixture is allowed to settle and the free liquid is decanted into the barrel
of a filter-syringe assembly. The liquid is filtered through a 0.2-µm filter into a vial containing an
aqueous emulsifier development solution. The filtered sample is allowed to develop for 10 minutes.
During the development, any hydrocarbons present precipitate out and become suspended in
solution.
2.2
The developed sample is placed in a turbidimeter that has been calibrated using a
blank and a single calibration standard. A beam of yellow light at 585 nm is passed through the
CD-ROM
9074 - 1
Revision 0
January 1998
sample and the scattering of light through the suspension at 90° is measured. The concentration
of total recoverable petroleum hydrocarbons present is calculated relative to the standard curve.
3.0
DEFINITIONS
3.1
See Sec. 5.0 of Chapter 1 and the manufacturer’s instructions for definitions associated
with this analytical procedure.
3.2
For the purpose of this method, “total recoverable petroleum hydrocarbons” is defined
as those hydrocarbons that are recovered using the solvent-specific extraction procedure provided
with this kit. Since there is no cleanup step to separate any co-extracted naturally occurring
hydrocarbons from the petroleum hydrocarbons, elevated turbidimetric readings are likely without
performing background correction. See the interferences section (Sec. 4.0) for additional details.
4.0
INTERFERENCES
4.1
This method is considered a screening technique because of the broad spectrum of
hydrocarbons it detects. It cannot distinguish between co-extracted naturally occurring hydrocarbons
and petroleum hydrocarbons. Using background correction and/or a selected response factor
discussed in the manufacturer’s instructions, an analyst may be able to eliminate some of the
interferences caused by co-extracted naturally occurring hydrocarbons. However, it is very difficult
to find a truly clean, representative sample for use as a background.
4.2
This method has been shown to be susceptible to interference from vegetable oils
(positive interference). It is anticipated that co-extracted naturally occurring oils from vegetative
materials would be one of the most probable positive interferants found in the field. To demonstrate
this interference, standard soil samples were spiked with corn oil at levels of 50 to 1000 ppm and
tested with PetroFLAGTM system. Soil samples spiked with mineral oil were also analyzed for
comparison. These data indicate that, over the range tested, the slope of the PetroFLAG™
vegetable oil response is approximately 18% of the response of the mineral oil standard. Supporting
data are presented in Table 2.
4.3
This method has been shown to be susceptible to interference from water (negative
interference). To demonstrate this interference, soils were spiked with diesel fuel at 100 ppm. The
samples were then spiked with varying amounts of water, up to saturation. The samples were
analyzed using the PetroFLAG™ system and the results were below that expected for the spike
added. The low bias may be due to a decrease in extraction efficiency in samples containing large
amounts of water, as a result of dilution of the extraction solvent. Supporting data are presented in
Table 3.
4.4
This method has been shown to NOT be significantly affected by up to 5% sodium
chloride contamination. Supporting data are presented in Table 6.
4.5
This method has been shown to NOT be significantly affected by up to 1000 ppm of
common surfactants such as trisodium phosphate (TSP), soap, and sodium dodecyl sulfate (SDS).
Supporting data are presented in Tables 7, 8, and 9.
4.6
Polycyclic aromatic hydrocarbons (PAHs) are a class of compounds present in many
hydrocarbon mixtures that are detected by the PetroFLAG system. These compounds are often
targeted because of their toxic characteristics and may be present individually as soil contaminants.
CD-ROM
9074 - 2
Revision 0
January 1998
However, the response of the individual PAHs varies greatly from compound to compound.
Therefore, use of the PetroFLAG system to quantitate individual PAHs is not recommended without
good knowledge of the site and after adjusting the analytical approach. Quantitation of PAHs as part
of a larger hydrocarbon fraction, such as diesel fuel, is recommended. Supporting data are
presented in Table 12.
4.7
The PetroFLAG™ analyzer can be used at temperatures from 4°C to 45°C. The
analyzer is equipped with an on-board temperature sensor to measure the ambient temperature at
which measurements are being made. The software uses this temperature reading to correct the
optical drift caused by temperature fluctuations.
4.8
Temperature at which the calibration is run should be recorded because of the effect
temperature has on the suspension. This can be done by taking a reading without inserting a vial.
If, during sample analysis, the temperature fluctuates more than ±10°C from the temperature at the
calibration, the calibration should be rerun at the new temperature.
5.0
SAFETY
Safety practices appropriate for handling potentially contaminated hazardous or toxic samples
and extraction solvents should be employed.
6.0
EQUIPMENT AND SUPPLIES
PetroFLAGTM Hydrocarbon Analysis System, (Dexsil Corporation, One Hamden Park Drive,
Hamden, CT), or equivalent. Each commercially-available test kit will supply or specify the apparatus
and materials necessary for successful completion of the test.
7.0
REAGENTS AND STANDARDS
Each commercially-available test kit will supply or specify the reagents necessary for
successful completion of the test. Reagents should be labeled with appropriate expiration dates,
and reagents should not be employed beyond such dates.
8.0
SAMPLE COLLECTION, PRESERVATION, AND STORAGE
8.1
See the introductory material to this chapter, Organic Analytes, Sec. 4.1.
8.2
Soil samples may be contaminated, and should therefore be considered hazardous and
handled accordingly. All samples should be collected using a sampling plan that addresses the
considerations discussed in Chapter Nine.
8.3
To achieve accurate analyses, soil samples should be well homogenized prior to
testing. The hydrocarbons may not be evenly distributed in a soil sample and extensive mixing is
necessary to assure homogeneity.
NOTE:
CD-ROM
It is strongly recommended that any free aqueous liquid be decanted from samples prior
to analysis with the PetroFLAG system. Free aqueous liquid will dilute the extraction
solvent and produce a negative interference.
9074 - 3
Revision 0
January 1998
NOTE:
9.0
When users of the PetroFLAG system wish to report their results on a dry weight basis,
additional representative samples should be collected for percent moisture determination.
See the extraction Methods 3540 or 3550 for the procedure for determining percent
moisture.
QUALITY CONTROL
9.1
Follow the manufacturer's instructions for quality control procedures specific to the test
kit used. Additional guidance on quality control is provided in Chapter One.
9.2
Use of replicate analyses, particularly when results indicate concentrations near the
action level, is recommended to refine information gathered with the kit.
9.3
Method 9074 is intended for use as a screening procedure in either the field or a fixed
laboratory. Wherever it is employed, a quality assurance program appropriate for a screening
procedure should be employed as a means of documenting the quality of the resulting data.
10.0 CALIBRATION AND STANDARDIZATION
See the PetroFLAGTM Hydrocarbon Analyzer User’s Manual for instruction on generating an
initial calibration curve using the PetroFLAG™ analyzer. Contact the manufacturer for specific
details on the calibration calculations programmed into the PetroFLAG™ analyzer.
11.0 PROCEDURE
Follow the manufacturer's instructions in the PetroFLAGTM Hydrocarbon Analyzer User’s
Manual to extract, develop, and analyze soil samples. Those test kits used must meet or exceed
the performance specifications indicated in Tables 1 through 3.
12.0 DATA ANALYSIS AND CALCULATIONS
Consult the PetroFLAGTM Hydrocarbon Analyzer User’s Manual for the procedure used to
generate concentration readings from samples using the PetroFLAG™ analyzer. Contact the
manufacturer for specific details on the concentration calculations programmed into the
PetroFLAG™ analyzer.
13.0 METHOD PERFORMANCE
13.1 Method Detection Limits were determined using a modification of the procedures in
Chapter One and in 40 CFR, Part 136. The procedure was modified slightly because the instrument
automatically subtracts an average blank value for each analysis (blank analysis is part of the
calibration procedure of the PetroFLAG™ test system). Two sets of seven samples each were
prepared, one set spiked with 30 ppm of diesel fuel, and one set spiked with 30 ppm of used motor
oil. The standard deviation (SD) of the results for each oil type were calculated. The method
detection limit (MDL) was determined by multiplying the SD by the Student's t value (3.143). These
data are presented in Table 1. The MDL for diesel fuel was 13 ppm and for used motor oil was 18.6
ppm (Ref 1).
CD-ROM
9074 - 4
Revision 0
January 1998
13.2 Samples of a standard soil were prepared by spiking with either diesel fuel or used
motor oil at 100 ppm intervals from 100 ppm to 1000 ppm. Each sample was analyzed in duplicate
by the PetroFLAG™ system and by Methods 3550 and 8015B. The results are shown in Table 4.
These data were analyzed using regression analysis. The results of the regression analysis are also
provided in Table 4. In addition, an analysis of variance (ANOVA) analysis was performed. The Fstatistic from the ANOVA revealed a significant bias between the two methods, with the
PetroFLAG™ providing consistently higher values for both types of contamination. The results
confirm that the kit design is intentionally conservative, in that it favors a high bias in order to avoid
reporting false negative results (Ref. 1).
13.3 Precision and bias were determined by analysis of variance (ANOVA) of the results
obtained from spiked soil samples. Four sets of spiked samples were prepared, containing either
diesel fuel or used motor oil at two different concentrations (200 and 1000 ppm). Each analyte at
each concentration was analyzed in duplicate 10 times (e.g., 20 replicates of each). The results
were transformed into recovery data. The ANOVA used these transformed data. The results are
presented in Table 5. The F-statistic for the diesel fuel analysis indicate a slight day effect for these
samples. The F-statistic seems to be driven more by the very low value of the mean square error
within days rather than by any large value for the mean square error between days (Ref. 1).
13.4 The response of the PetroFLAG System to a soil spiked with 500 ppm of diesel fuel and
0 to 5% of dry sodium chloride is provided in Table 6 (Ref. 2).
13.5 The responses of the PetroFLAG System to a soil spiked with 500 ppm of diesel fuel
and up to 1000 ppm of common surfactants such as trisodium phosphate (TSP), soap, and sodium
dodecyl sulfate (SDS), are presented in Tables 7, 8, and 9 (Ref. 2).
13.6 Performance of the PetroFLAG™ system on anthracene from 100 to 2000 ppm and on
creosote from 100 to 1000 ppm are presented in Tables 10 and 11, respectively. An explanation of
the erratic performance of anthracene is provided in the Table 10 narrative (Ref. 2).
13.7 The performance of the PetroFLAG system for several PAHs relative to the mineral oil
calibrator on soil is presented in Table 12 (Ref. 4).
13.8 Performance of the PetroFLAG™ system on Jet-A from 40 to 2808 ppm (Ref. 4) and
on gasoline from 1000 to 4070 ppm (Ref. 2) are provided in Tables 13 and 14, respectively. An
explanation of the performance of Jet-A and gasoline are provided in the narrative in Tables 13 and
14.
14.0 POLLUTION PREVENTION
This method does not use any halogenated solvents and may be used to help reduce the
number of samples sent to the laboratory under certain project scenarios. Traditional laboratory
extraction methods (i.e. Soxhlet or sonication) would generally require much larger volumes of
solvent to extract the sample.
15.0 WASTE MANAGEMENT
Waste management procedures must be consistent with federal, state, and local regulations.
CD-ROM
9074 - 5
Revision 0
January 1998
16.0 REFERENCES
1.
Data Validation Package, Testing for Petroleum Hydrocarbons in Soil by Turbimetric Analysis,
PetroFLAG™ Test System, DEXSIL Corp., Hamden, CT.
2.
Supplementary Validation Data, Additional Analyte and Contaminant Testing Data for the
PetroFLAG™ Hydrocarbon Analysis System, DEXSIL Corp., Hamden, CT, August 24, 1995.
3.
PetroFLAG™ Hydrocarbon Analyzer User’s Manual, DEXSIL Corp., Hamden, CT.
4.
Supplementary Data Validation Package III, Additional Analyte Testing Data for Petroleum
Hydrocarbons in Soil by Turbimetric Analysis - PetroFLAG™ Test System, DEXSIL Corp.,
Hamden, CT, June 20, 1997.
5.
Supplementary Data Validation Package IV, Polycyclic Aromatic Hydrocarbon Response data
for Method 9074 Petroleum Hydrocarbons in Soil by Turbimetric Analysis - PetroFLAG™ Test
System, DEXSIL Corp., Hamden, CT, August 22, 1997.
17.
TABLES, DIAGRAMS, FLOWCHARTS, AND VALIDATION DATA
The pages to follow contain Tables 1 through 14.
CD-ROM
9074 - 6
Revision 0
January 1998
TABLE 1
METHOD DETECTION LIMIT FOR PetroFLAG TEST SYSTEM
Trial #
30 ppm diesel fuel
30 ppm motor oil
1
34
35
2
24
41
3
28
40
4
34
53
5
36
46
6
32
48
7
30
42
Average (ppm)
31.03
43.6
SD (ppm)
4.12
5.91
MDL (ppm)
13.0
18.6
Data from Reference 1.
TABLE 2
RELATIVE RESPONSE OF VEGETABLE OILS AS AN INTERFERANT
a
Analyte Spike
Concentration (ppm)
Mineral Oil
Response (ppm)
Vegetable Oil
Responsea (ppm)
50
55
30
100
100
45
200
189
94
500
504
111
1000
947
208
The vegetable oil samples were analyzed using the PetroFLAG system set to response
factor 10. The slope of the PetroFLAG vegetable oil response is approximately 18% of the
response of the mineral oil standard. This means that a sample containing 5,560 ppm
vegetable oil would provoke a response equivalent to that given by 1,000 ppm mineral oil.
Data from Reference 1.
CD-ROM
9074 - 7
Revision 0
January 1998
TABLE 3
EFFECT OF WATER ON PetroFLAG RESULTS
a
CD-ROM
a
% Water Saturation (% Water)
% Recovery of Mineral Oil
0 (0)
100
5 (1)
94
25 (5)
98
50 (10)
95
100 (20)
85
Soil sample spiked with 100 ppm of mineral oil. (Ref. 1)
9074 - 8
Revision 0
January 1998
TABLE 4
COMPARISON OF PetroFLAG AND GC TEST RESULTS
Spike Conc.
(µg/g)
PetroFLAG
(µg/g)
3550/8015B
(µg/g)
Diesel Fuel
Trial 1
Trial 2
Trial 1
Trial 2
100
200
300
400
500
600
700
800
900
1000
112
230
312
420
538
626
774
910
1091
1182
116
248
370
455
564
654
790
900
977
1062
73
158
242
299
342
460
509
612
678
646
82
156
218
275
344
439
494
607
614
649
Corr Coef
Slope
Intercept
0.999
1.126
-2.8
0.992
0.679
30.5
Motor Oil
Trial 1
Trial 2
Trial 1
Trial 2
100
200
300
400
500
600
700
800
900
1000
121
243
381
428
531
654
717
880
931
1014
128
292
408
497
554
668
771
883
1052
1098
123
200
301
341
441
534
609
711
835
887
82
200
275
343
452
528
652
746
881
846
Corr Coef
Slope
Intercept
0.998
1.02
50.9
0.997
0.887
20.5
Data from Reference 1.
CD-ROM
9074 - 9
Revision 0
January 1998
TABLE 5
ANOVA RESULTS FOR SPIKED PETROLEUM HYDROCARBON SAMPLES
Analyte/Concentration
n
Diesel, 200 ppm
Diesel, 1000 ppm
Motor Oil, 200 ppm
Motor Oil, 1000 ppm
20
20
20
20
Mean
(0)
1.09
1.00
1.12
0.937
Variance
(Fn-12)
Standard
Deviation (Fn-1)
0.0059
0.00430
0.00266
0.000919
Standard
Error (F0)
0.0768
0.0656
0.0515
0.0303
0.0172
0.0147
0.0115
0.00678
Data from Reference 1.
TABLE 6
RESPONSE OF PetroFLAG SYSTEM WITH VARIOUS LEVELS OF SODIUM CHLORIDEa
% Sodium Chloride
PetroFLAG Response (ppm)
a
0
0.5
1.0
2.0
5.0
518
539
529
516
524
A series of soil samples consisting of sand, clay, and topsoil was spiked with 500 ppm of diesel
fuel and varying levels of dry sodium chloride (NaCl) from 0 to 5 percent. The samples were
analyzed using the PetroFLAG system set to response factor 5 (Ref. 2).
TABLE 7
RESPONSE OF PetroFLAG SYSTEM WITH VARIOUS TSP CONCENTRATIONSa
TSP Concentration (ppm)
PetroFLAG Response (ppm)
a
0
100
200
500
1000
522
511
512
500
492
Response of the PetroFLAG system for soil containing 500 ppm of diesel fuel and various levels
of trisodium phosphate(TSP), a common surfactant. The samples were analyzed using the
PetroFLAG system set to response factor 5 (Ref. 2).
CD-ROM
9074 - 10
Revision 0
January 1998
TABLE 8
RESPONSE OF PetroFLAG SYSTEM WITH VARIOUS SOAP CONCENTRATIONSa
Soap Concentration (ppm)
PetroFLAG Response (ppm)
a
0
100
200
500
1000
500
494
488
502
528
Response of the PetroFLAG system for soil containing 500 ppm of diesel fuel and various levels
of soap (non-ionic and anionic surfactants). The samples were analyzed using the PetroFLAG
system set to response factor 5 (Ref. 2).
TABLE 9
RESPONSE OF PetroFLAG SYSTEM WITH VARIOUS SDS CONCENTRATIONSa
SDS Concentration (ppm)
PetroFLAG Response (ppm)
a
0
100
200
500
1000
472
474
488
486
496
Response of the PetroFLAG system for soil containing 500 ppm of diesel fuel and various
levels of sodium dodecyl sulfate, a surfactant. The samples were analyzed using the
PetroFLAG system set to response factor 5 (Ref. 2).
TABLE 10
RESPONSE OF PetroFLAG SYSTEM WITH VARIOUS AMOUNTS OF ANTHRACENEa
Anthracene Conc. (ppm)
PetroFLAG Response (ppm)
a
100
200
500
1000
2000
798
1376
1641
1380
1735
Response of the PetroFLAG system for soil containing various levels of anthracene. The results
show that the PetroFLAG system returns a strong response to anthracene. The response to
anthracene is higher than response to the calibrator, therefore, the meter displays a reading overestimating the concentration. For concentrations greater than 200 ppm, the turbidity developed
exceeds the recommended level (i.e. a reading greater than 1000 on response factor 10). To
obtain accurate results the user should rerun the sample using a smaller sample size. This will
bring the results into linear range. The samples were analyzed using the PetroFLAG system set
to response factor 10 (Ref. 2).
CD-ROM
9074 - 11
Revision 0
January 1998
TABLE 11
RESPONSE OF PetroFLAG SYSTEM WITH VARIOUS AMOUNTS OF CREOSOTEa
Creosote Conc. (ppm)
PetroFLAG Response (ppm)
a
100
200
500
1000
103
210
538
1043
Response of the PetroFLAG system for soil containing various levels of creosote. The samples
were analyzed using the PetroFLAG system set to response factor 8 (Ref. 2).
TABLE 12
RELATIVE RESPONSE OF PetroFLAG SYSTEM TO VARIOUS
POLYCYCLIC AROMATIC HYDROCARBONSa
a
Compound
Spike Level in ppm
(Matrix Used)
PetroFLAG Reading
in ppm (Rf 10)
Response Relative to
Mineral Oil Calibrator
Anthracene
100 (Soil)
798
8
Benzo[a]pyrene
50 (Soil)
180
3.6
Chrysene
16 (Solvent)
172
11
Fluoranthene
200 (Solvent)
101
0.5
Pyrene
200 (Solvent)
216
1.1
The data for anthracene and benzo(a)pyrene were generated by spiking each compound onto a
composite sandy clay loam soil and homogenizing the sample for later analysis. The soil sample
size was 10 g. The soil spiking procedure used for anthracene and benzo(a)pyrene produced
inconsistent results for the other PAH compounds. These compounds (chrysene, flouranthene,
and pyrene), which are very soluble in the extraction solvent, were spiked directly into the
extraction solvent and analyzed. All of the PAHs samples were analyzed on response factor 10
(the correct response factor for mineral oil). The data indicate that, for example, using a standard
sample size analyzed on response factor 10 (the correct response factor for mineral oil), a 100
ppm anthracene sample read 798 ppm. The PetroFLAG response to the above analytes is equal
to or greater than the calibrator in all cases except for fluoranthene which has a response
equivalent to diesel fuel.
NOTE: When analyzing soils containing anthracene, benzo(a)pyrene, or chrysene the PetroFLAG
meter will read over range for concentrations of 250, 550, and 180 ppm respectively. These soils
can be analyzed using a 1 gram sample size to increase the maximum quantifiable concentration.
CD-ROM
9074 - 12
Revision 0
January 1998
TABLE 13
RESPONSE OF PetroFLAG SYSTEM WITH VARIOUS AMOUNTS OF JET-Aa
Jet-A Conc. (ppm)
PetroFLAG Response (ppm)
a
0
40
79
198
397
793
1586
2776
54
110
162
208
368
700
1592
2808
Response of the PetroFLAG system for soil containing various levels of Jet-A. The composite
soils were prepared from two types of clay-loam soil and sand. The component soils were air dried
and sieved to remove particles larger than 850 µm and then mixed in the ratio 2:1:1, followed by
tumbling for one hour. The soil was weighed out into 10 g aliquots. Each of the soil aliquots was
spiked by direct injection of Jet-A fuel onto the soil using a microliter syringe, mixed, and analyzed
by the PetroFLAG system with the instrument set to response factor 4. The coefficient of
determination (r2) for the Jet-A data was 0.997, indicating that the PetroFLAG response was linear
over the range 40 ppm to 2808 ppm (Ref. 4).
TABLE 14
RESPONSE OF PetroFLAG SYSTEM WITH VARIOUS AMOUNTS
OF WEATHERED GASOLINEa
Weathered Gasoline Conc. (ppm)
PetroFLAG Response (ppm)
a
1000
2040
3050
4070
285
1780
4335
6870
Response of the PetroFLAG system for soil containing various levels of weathered gasoline (50%
evaporated). The manufacturer recommends that PetroFLAG be used to qualitatively detect
gasoline at these levels. It is not recommended that PetroFLAG be used quantitatively for gasoline
unless significant response factor corrections are made and evaporation of the target
hydrocarbons is addressed. The samples were analyzed using the PetroFLAG system set to
response factor 2 (Ref. 2).
CD-ROM
9074 - 13
Revision 0
January 1998